
Bitcoin Price Breaks $64,000: Is the Iran Truce Really the Reason?

0
0
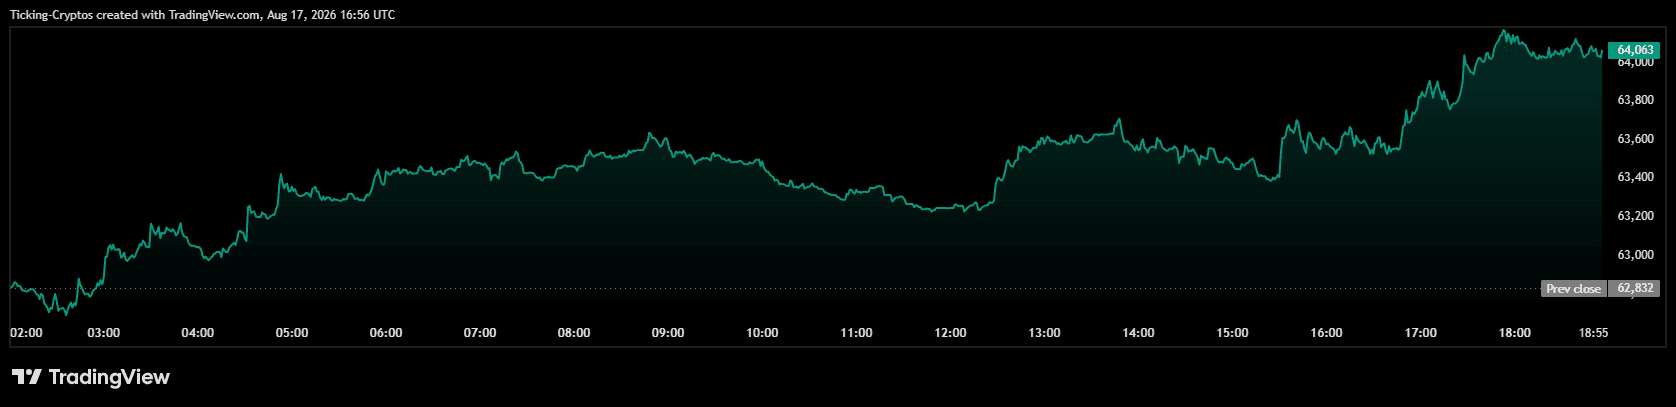
Bitcoin price pushed above $64,000 on Monday for the first time since 11 August, printing $64,063 at 18:55 UTC against a previous close of $62,832. That is a gain of roughly $1,230, or almost 2 percent on the day.
The obvious explanation is sitting right there in the newsflow. Saudi broadcaster Al Arabiya reported on Monday, citing sources, that the United States and Iran had agreed to extend their 60-day truce, which expired today. Turkish agency Anadolu carried a similar report citing Pakistani government sources.
It is a tidy story. It is also, on the evidence of the intraday chart, only partly true.
How much did Bitcoin actually gain on Monday?
$Bitcoin reclaimed the $64,000 level it lost on 11 August, closing the European session up close to 2 percent after a full day of steady buying.
🔸 $BTC price: $64,063 at 18:55 UTC
🔸 Previous close: $62,832
🔸 Session gain: about $1,230, or roughly 1.96 percent
🔸 Session low: near $62,830 around 02:00 UTC
🔸 Session high: about $64,150 around 17:50 UTC
Context: BTC ended last week near $62,900, down about 3 percent on the week
Did the US and Iran really extend the ceasefire?
The extension is a sourced media report, not a confirmed agreement, and Iranian officials have publicly contradicted it.
Al Arabiya and Anadolu both point to an extension. The Jerusalem Post, however, reports that the deadline passed without a breakthrough, with Washington and Tehran still divided over the Strait of Hormuz and Iran's nuclear program. A senior Iranian official told reporters there were no talks about extending the 60-day period at all. Tehran's position for weeks has been that the arrangement never had a defined start date, so in its reading there is nothing to extend.
The document in question is the memorandum of understanding signed by Donald Trump and Masoud Pezeshkian on 17 June 2026, covering removal of the US naval blockade and free passage for commercial vessels through the Strait of Hormuz for 60 days only. That clock ran out today, and shipping through the strait has ground to a near halt.
Does the chart show the Iran news caused the move?
No. The uptrend began around 02:00 UTC, many hours before the truce report circulated, so the headline accelerated a rally that was already underway rather than starting it.
Walk the intraday tape in order:
- 02:00 to 06:00 UTC. Bitcoin lifts off the $62,830 area in a stair-step pattern, tagging $63,400 by 06:00. This is the single cleanest leg of the day and it happens overnight in Europe, well before any Middle East report.
- 06:00 to 12:15 UTC. A broad $63,250 to $63,650 range. Buyers defend, but there is no expansion.
- 12:30 UTC. A sharp step up to roughly $63,550, coinciding with US futures repositioning ahead of the equity open.
- 14:00 to 15:30 UTC. The move fades back toward $63,380. If a market-moving peace headline had already landed and been believed, this fade should not have happened.
- 16:45 to 17:50 UTC. The strongest impulse of the session, running from about $63,550 to $64,150 in roughly an hour. This is the window that best matches the Al Arabiya report timing.
So roughly 60 percent of the day's gain was banked before the truce story reached the wires. The final leg is plausibly headline-driven, but it is an accelerant on an existing move, not the cause of it.
The second red flag is magnitude. Two percent is small. When the US and Iran agreed a ceasefire on 8 April, Brent fell close to 16 percent in a single session and the FTSE 100 jumped 2.8 percent. When the June MOU was signed, Bitcoin rallied toward the $66,000 zone. A genuine, believed Hormuz reopening is a far larger event than what Monday's tape is pricing. The market is treating this as a maybe, not a deal.
What else is driving Bitcoin higher?
The dominant driver on Monday was macro, specifically softer US inflation data trimming the odds of a September Fed hike and pushing the dollar to its weakest level since early June.
Three other factors matter here:
- Support defence. BTC fell toward $62,500 on Friday and the $62,500 to $63,000 zone has held. Monday's action reads as a controlled relief bounce off support with cleaner leverage conditions, not a high-conviction news rally.
- Volatility compression. Thirty-day implied volatility has been reported near 36 percent, close to its 2026 low. Compressed vol means any catalyst gets amplified more than it deserves. A modest headline can produce an outsized-looking candle when the market is this quiet.
- Positioning. The Binance long/short ratio has been running around 2.05, with roughly 67 percent of accounts long. Crowded positioning cuts both ways, but into a round number like $64,000 it tends to add fuel on the way up.
Is $64,000 a real breakout?
Not yet. $64,000 is a level Bitcoin lost on 11 August, and the resistance that actually matters sits at $64,500 to $65,000, where BTC failed last week.
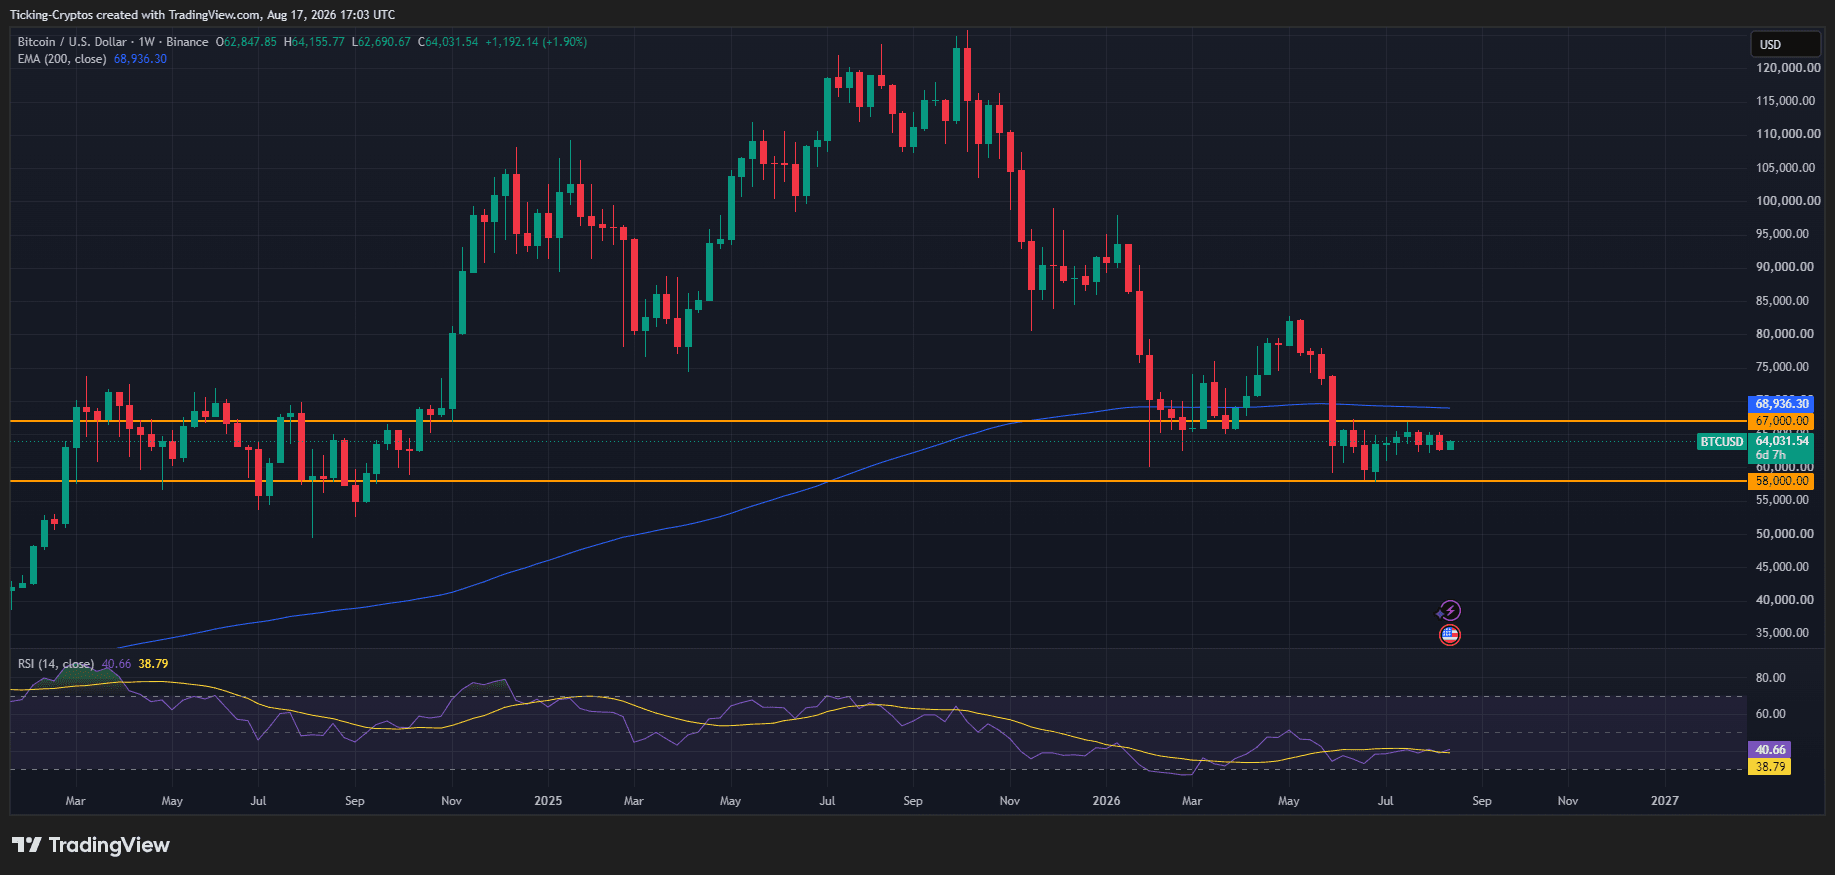
Reclaiming a level you recently lost is repair work, not a breakout. Some traders point to $66,000 as the upside target if BTC clears the $64,000 to $65,000 band, but confirmation would need two things the market does not have yet: renewed spot ETF inflows and rising open interest. Spot Bitcoin ETFs opened August strongly, then recorded consecutive outflow days last week. Flows are the tell here, and they have not turned decisively.
What should crypto traders watch next?
Watch Brent crude and Strait of Hormuz shipping volumes, because oil is the mechanism that would turn a headline into a durable crypto tailwind.
The transmission channel from the Middle East to Bitcoin runs through energy, not sentiment. Cheaper crude means lower inflation expectations, which means a more dovish Fed, which means better conditions for risk assets. If tanker traffic actually resumes and Brent breaks meaningfully lower, the rally has a foundation. If shipping stays halted, Monday's move was a support bounce that borrowed a headline for momentum, and $64,500 to $65,000 will likely reject it again.
What is the bottom line for crypto investors?
Bitcoin broke $64,000 on a mix of soft US inflation data, a defended support level, and an unconfirmed peace headline that arrived late in the session, which makes this a relief bounce to monitor rather than a geopolitical breakout to chase.
The Iran story is real and worth tracking, but attributing Monday's entire move to it does not survive contact with the intraday chart. Wait for oil, ETF flows, and a clean daily close above $65,000 before treating this as a trend change.
0
0

 Manage all your crypto, NFT and DeFi from one place
Securely connect the portfolio you’re using to start.

0
0

0
0


0
0