Dogecoin Price Holds Breakout Structure: DOGE to Rally Soon?

0
0

Dogecoin (DOGE) price has broken out of a multi-month bear trend, and was holding abovr the $0.16 mark.
The shift has attracted the interest of analysts, who have been observing whether such an arrangement would lead to a DOGE price rally soon.
Breakout Above $0.16 Positions Dogecoin Price for Upside Targets
Notably, a recent Dogecoin price arrangement indicated that the meme coin has regained the $0.16 position that has been a resistance zone over the better part of the second quarter.
This level is a support to a possible reversal, assuming that the purchasing forces continue.
Market analyst, Ledger Bull, has pointed to three upside targets, $0.20333, $0.22899, and $0.25383. These are the next zones where DOGE price may react if bullish strength returns.

In addition, the move above $0.16 followed a prolonged downtrend that had constrained Dogecoin’s progress for weeks. The breakout has been supported by an initial surge in volume, followed by a phase of consolidation.
Analyst Ledger Bull was keen to see whether volume returns on the next move upward. A firm close above $0.20333 would validate the shift in market structure and open the door for Dogecoin price to test the higher targets mapped on the chart.
DOGE Retests Descending Trendline
More so, Trader Tardigrade noted that Dogecoin was retesting a long-term descending trendline on the 4-hour chart. This line, drawn from the series of lower highs that formed between late May and mid-June, had previously acted as a ceiling for every rally attempt.

The meme price action this week showed DOGE pulling back to the trendline after breaking through it. This is a common pattern in technical analysis that often tests the strength of a new trend direction.
Besides, the zone around $0.158 to $0.162 was the retest region. This may be a firm bounce at this level, showing that there is no breakout and maybe the bulls are defending the new support.
Furthermore, a higher low and an increase in volume on the resulting upward candle should confirm that a higher low is followed by a suspension of the downward trend.
Should this retest be successful, the market may see Dogecoin price resume its upward path to $0.20.
Fractal Pattern Suggests DOGE May Repeat 2015–2017 Setup
Another analyst, GalaxyBTC, noted a longer-term repeating pattern that drew comparisons to Dogecoin price structure from 2015 to 2017.
During that period, the asset followed a three-wave accumulation pattern before launching into a major uptrend.
The analyst noted that a similar sequence is appearing again on the weekly timeframe, supported by a rising trendline that remains intact.
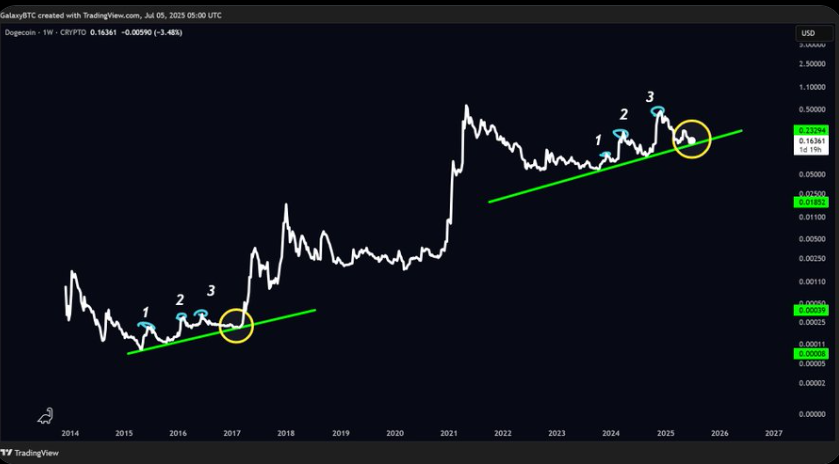
In the historical pattern, the third wave was completed just before a major breakout. Dogecoin price now appears in a similar cycle, with the third trend moving up. Support remains on the same rising line that has held for several quarters.
This progressive line, along with parallels to historical price activity, has led to speculation that Dogecoin may be in a similar bullish phase.
Meanwhile, recent analysis showed Dogecoin price reinforcing its base with a strong trendline and horizontal support at $0.159. The second weekly touch of the long-term ascending trendline aligns with historical bullish reversals.
Moreover, analysts expected a push toward $0.25 and potentially $1 if momentum continues, supported by rising trading volume.
The post Dogecoin Price Holds Breakout Structure: DOGE to Rally Soon? appeared first on The Coin Republic.
0
0


 Manage all your crypto, NFT and DeFi from one place
Securely connect the portfolio you’re using to start.

0
0

0
0

