
Dogecoin Price Prediction: DOGE Eyes Big Move From Triangle

0
0

Dogecoin Price Prediction: What's Brewing
Dogecoin price prediction chatter is heating up again this week, and honestly, it's not hard to see why.
DOGE has spent days coiling tighter and tighter, the kind of quiet-before-the-storm setup that makes traders start refreshing charts every ten minutes.
Something's building under the surface. Whales are stirring, volume's picking up, and the price action itself is basically begging for a resolution one way or the other.
So is Dogecoin gearing up for another shot at $1, or is a sharper pullback waiting in the wings first? That comes down to which side of the squeeze gives way.
Let's get into what the charts, the liquidation data, and the social chatter are actually saying.
Current Market Snapshot
| Metric | Value |
|---|---|
| Price | $0.07245 (+0.27% 24h) |
| Market Cap | $12.37B (+10.59%) |
| 24h Volume | $344.2M (+19.37%) |
| Vol/Mkt Cap | 2.77% |
| Circulating Supply | 170.85B DOGE |
| Max Supply | Infinite (∞) |
Source: Data from CoinMarketCap as of 20/07/2026. Figures may vary slightly across other tracking websites.
Barely moving on the day, but under the hood, volume jumped nearly 20%. That's not nothing; someone's positioning ahead of a move.
Dogecoin Liquidation Data: Who's Under Pressure
According to the Coinglass liquidation data over the past day, the imbalance jumps out:
Longs have eaten roughly 73% of all liquidations in the last 24 hours. That's not a small tilt. It tracks with the descending triangle's lower-high pattern too.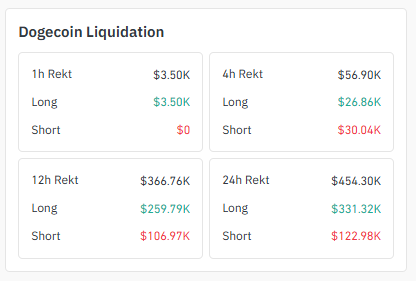
Source: Liquidation Data Taken From Coinglass.
| Timeframe | Total Rekt | Longs | Shorts |
|---|---|---|---|
| 1h | $3.50K | $3.50K | $0 |
| 4h | $56.90K | $26.86K | $30.04K |
| 12h | $366.76K | $259.79K | $106.97K |
| 24h | $454.30K | $331.32K | $122.98K |
Traders keep jumping the gun on a breakout, getting squeezed out before the price can actually punch through resistance. Frustrating pattern if you've been on the wrong side of it.
$Dogecoin Exchange Volume Heatmap
According to Coinglass, exchange volume is still heavily stacked toward futures, and Binance is running away with most of it: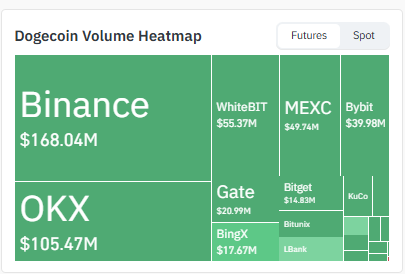
Source: Volume Heatmap Data Taken From Coinglass.
| Exchange | 24h Futures Volume |
|---|---|
| Binance | $168.04M |
| OKX | $105.47M |
| WhiteBIT | $55.37M |
| MEXC | $49.74M |
| Bybit | $39.98M |
| Gate | $20.99M |
| BingX | $17.67M |
| Bitget | $14.83M |
Binance alone is close to half of everything tracked here. When one venue holds that much weight, its order book can move the price on its own.
Good to keep in mind if you're wondering why a move sometimes starts on one exchange before spreading.
4-Hour Chart: Descending Triangle at the Apex
Pull up the 4-hour chart, and you'll see it immediately: a textbook descending triangle. A flat floor holding steady, a ceiling that keeps stepping lower with every bounce.
Price is now sitting right at the tip of that wedge, around $0.07257, and triangles at the apex don't usually sit still for long.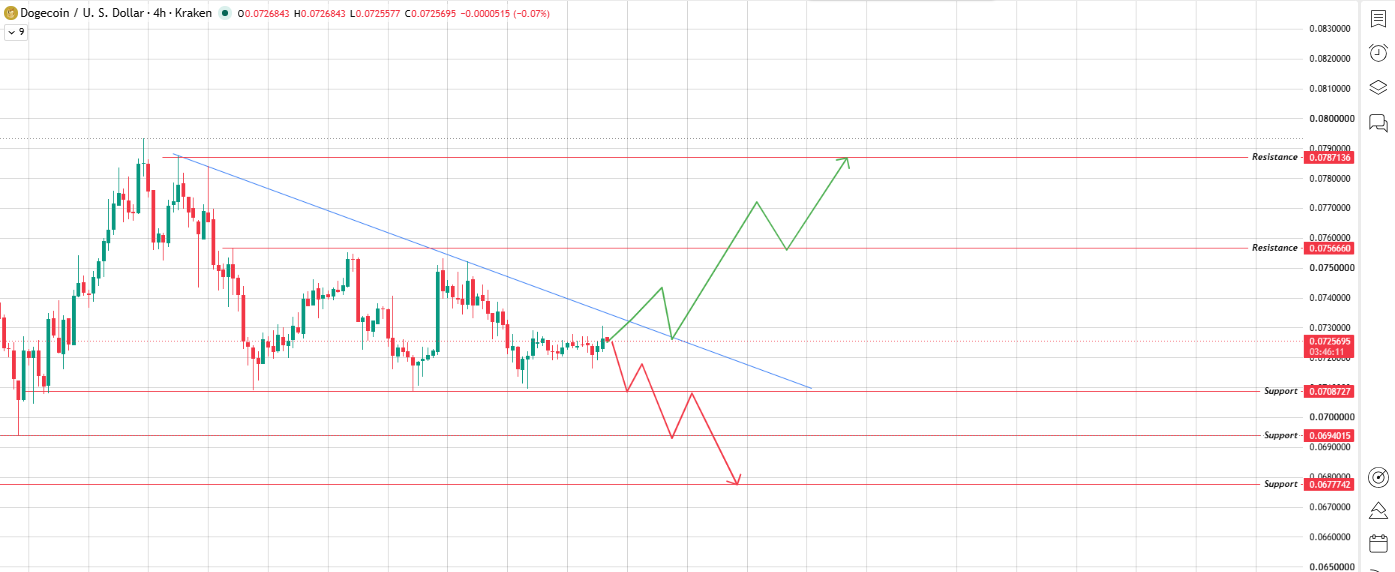
Source: Chart Taken From TradingView
| Level | Price |
|---|---|
| Resistance Level 1 (First Wall) | $0.0757 |
| Resistance Level 2 | $0.0787 |
| Support Zone 1 | $0.0709 |
| Support Zone 2 | $0.0694 |
| Support Zone 3 | $0.0678 |
Clear $0.0757 with conviction, and $0.0787 opens up fast. That's the bullish breakout case. But here's the catch: descending triangles lean bearish by nature; more often than not they resolve down, not up.
Lose the apex and a bearish breakdown through $0.0709 could snowball toward $0.0694 and then $0.0678. Worth marking these levels correctly, because this pattern doesn't leave much room for error.
1-Day Chart: Symmetrical Triangle Squeeze
Zoom out to the daily chart and the story rhymes, but the stakes get bigger.
DOGE has been grinding inside a symmetrical triangle for weeks now, highs stepping down, lows stepping up, both converging on the exact same point: roughly $0.0726, right where price sits today.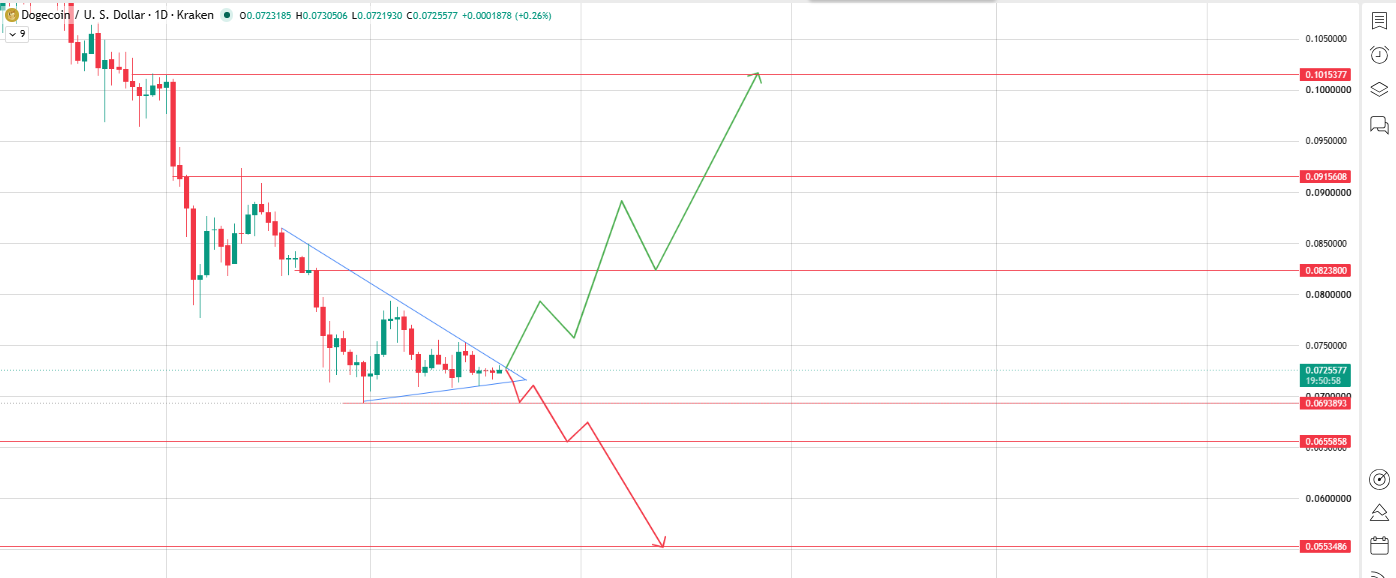
Source: Chart Taken From TradingView
-
Long-term breakout resistance level: $0.0824 → $0.0916 → $0.1015
-
Long-term breakdown support zone: $0.0694 → $0.0656 → $0.0553
A daily close above $0.0824 flips this bullish in a meaningful way, with $0.0916 and then $0.1015 as the follow-through stops.
Fail there, and a daily breakdown under $0.0694 risks snowballing toward $0.0656, then $0.0553. No middle ground; once this thing breaks, it just doesn't have room left to stay quiet.
Three-Scenario Outlook
| Scenario | Short-Term (4H) Target | Long-Term (1D) Target |
|---|---|---|
| Bullish | $0.0757 → $0.0787 | $0.0824 → $0.0916 → $0.1015 |
| Neutral / Range | Chop near $0.0726 apex | Consolidation near $0.0726 apex |
| Bearish | $0.0709 → $0.0694 → $0.0678 | $0.0694 → $0.0656 → $0.0553 |
Social Sentiment: Whale Activity and Trader Targets
There's been a noticeable uptick in chatter around dogecoin whale accumulation lately, lining up neatly with the triangle squeeze on both timeframes.
One post making the rounds from Trader Hailey (@TheMoonHailey) argues DOGE's macro chart is echoing its old breakout-and-run cycles, calling the current phase a temporary stagnation window right before Dogecoin's most parabolic stretches historically. 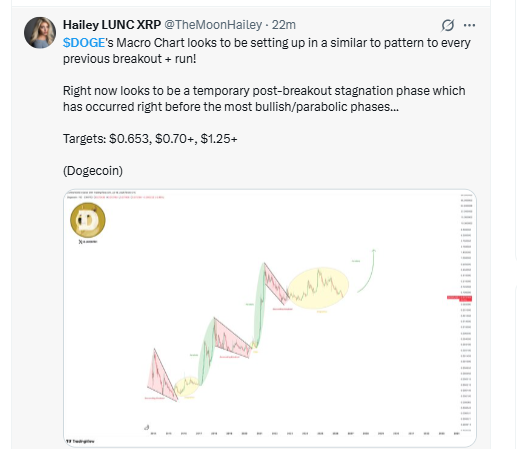
Source: Data Taken From X
The targets floated: $0.653, $0.70+, and $1.25+.
Fair enough as a thesis, but let's run the numbers before getting carried away. At $1.25, DOGE's market cap on today's circulating supply of 170.85B coins would land north of $213 billion, bigger than Dogecoin's entire prior all-time-high valuation, by a wide margin.
Not impossible, sure, but it's the kind of target that needs a lot more than one triangle breakout to justify.
It take real shifts in BTC dominance and DOGE's ETH correlation before something on that scale becomes realistic. File it under high conviction, low near-term probability.
Technical vs. Sentiment Targets Compared
| Source | Time Frame | Target Range |
|---|---|---|
| 4H Chart (Descending Triangle) | Short-term | $0.0678 – $0.0787 |
| 1D Chart (Symmetrical Triangle) | Medium-term | $0.0553 – $0.1015 |
| Social Sentiment (Trader Target) | Long-term / Speculative | $0.653 – $1.25+ |
Look at the gap between those rows. Chart-based levels and social sentiment targets aren't even in the same ballpark, which is exactly why the latter belongs in the "opinion" column rather than treated as a hard price target.
BTC Dominance and ETH Correlation Context
Dogecoin rarely trades on its own terms. BTC dominance shifts tend to decide whether money rotates into altcoins like DOGE or retreats back to Bitcoin.
DOGE's ETH correlation means broader risk sentiment across majors usually shows up in Dogecoin's chart before it shows up anywhere in the headlines.
Both are worth a glance alongside any dogecoin price prediction; the coin doesn't move in a vacuum.
Final Outlook
Two triangles, one apex, and the same coin—that's a lot of compressed energy sitting at $0.0726 right now, and setups like this rarely stay boring for long.
The long-heavy liquidations over the past day suggest the market hasn't earned its breakout just yet. A real move needs volume behind a close above $0.0757 short-term or $0.0824 long-term.
Until either happens, $0.0694–$0.0709 is the zone to watch if things tip the other way.
As for the dollar-plus targets floating around social media, treat those as a long-horizon bet, not a technical signal you should be trading around today.
Glossary
Descending Triangle: A flat floor underneath, a ceiling that keeps stepping lower on top. Leans bearish more often than not.
Symmetrical Triangle: The opposite squeeze. Highs and lows both close in on the same point, and a breakout's coming. The pattern just won't tell you which way.
Two more worth knowing: A resistance level is basically a price ceiling sellers keep defending, while a support zone is the floor buyers keep showing up to defend.
The liquidation heatmap tracks forced closures across exchanges; it's how you spot which side of the market is getting squeezed hardest.
Exchange volume, meanwhile, is just the raw trading activity tallied up across venues over a given window.
The last two are more macro. BTC dominance measures Bitcoin's share of the total crypto market cap, and ETH correlation tells you how tightly an asset's price moves alongside Ethereum's.
Methodology
Every chart level in this dogecoin price prediction is pulled straight from the uploaded 4H and 1D TradingView chart nothing extrapolated, nothing estimated.
Liquidation and exchange volume numbers come from live derivatives dashboards.
The social sentiment range is quoted from a public trader post and kept clearly separate from the technical read.
Reflects market conditions as of July 20, 2026. Informational only, not financial advice.
Disclaimer: This article is for informational and educational purposes only and should not be considered financial advice. Cryptocurrency investments carry risks, and prices can be highly volatile. Always conduct your own research and consult a qualified financial advisor before making any investment decisions.
0
0

 Manage all your crypto, NFT and DeFi from one place
Securely connect the portfolio you’re using to start.


