SUI dips 5%, targets the $0.70 support level: check forecast

0
0

SUI is down 5% in the last 24 hours, making it the third-worst performer among the top 30 cryptocurrencies by market cap.
This latest development extends SUI’s downside breakout of a short-consolidation range confirmed the previous day.
Currently, retail sentiment remains bearish, thanks to the increased long liquidations and a sharp drop in the funding rate.
Technical outlook also suggests a steeper correction could be underway, with the bears targeting the $0.70 support level.
Derivatives data supports bearish outlook
SUI is down 11% in the last seven days despite the positive developments within the Sui ecosystem.
The Grayscale Sui Staking Exchange-Traded Fund (ETF) launched last week, allowing investors to gain exposure to the SUI token.
Furthermore, Canary Capital's SUIS launched on Nasdaq last week, giving investors regulated spot exposure to SUI with staking rewards reflected in net asset value where applicable.
However, these were not enough to boost SUI’s performance as the coin is down 5% in the last 24 hours.
Derivatives market data shows a bearish bias among traders, aligning with the risk-averse broader market conditions.
According to CoinGlass, SUI’s Open Interest (OI) reads $462 million, down 2% in the last 24 hours, showing a capital outflow from the derivatives market.
The massive long liquidations in the last 24 hours have resulted in SUI’s long-to-short ratio dropping below 1, to 0.9558. This indicates a greater number of active short positions.
SUI’s OI-weighted funding rate is down to -0.0096%, suggesting more retail interest in short positions.
Will the bears push SUI towards $0.70?
The SUI/USD 4-hour chart is bearish and efficient, as SUI extends its decline for the fourth consecutive day.
Currently, SUI is trading below the $0.88 support level and could dip lower in the near term.
The resistance levels at $0.88 and $1.05 could cap upward movements in the near term.
Surpassing these resistance levels would allow the bulls to target the $1.272 psychologcal level in the near to medium term.
The technical indicators on the 4-hour chart suggest that the short-term buying pressure is fading.
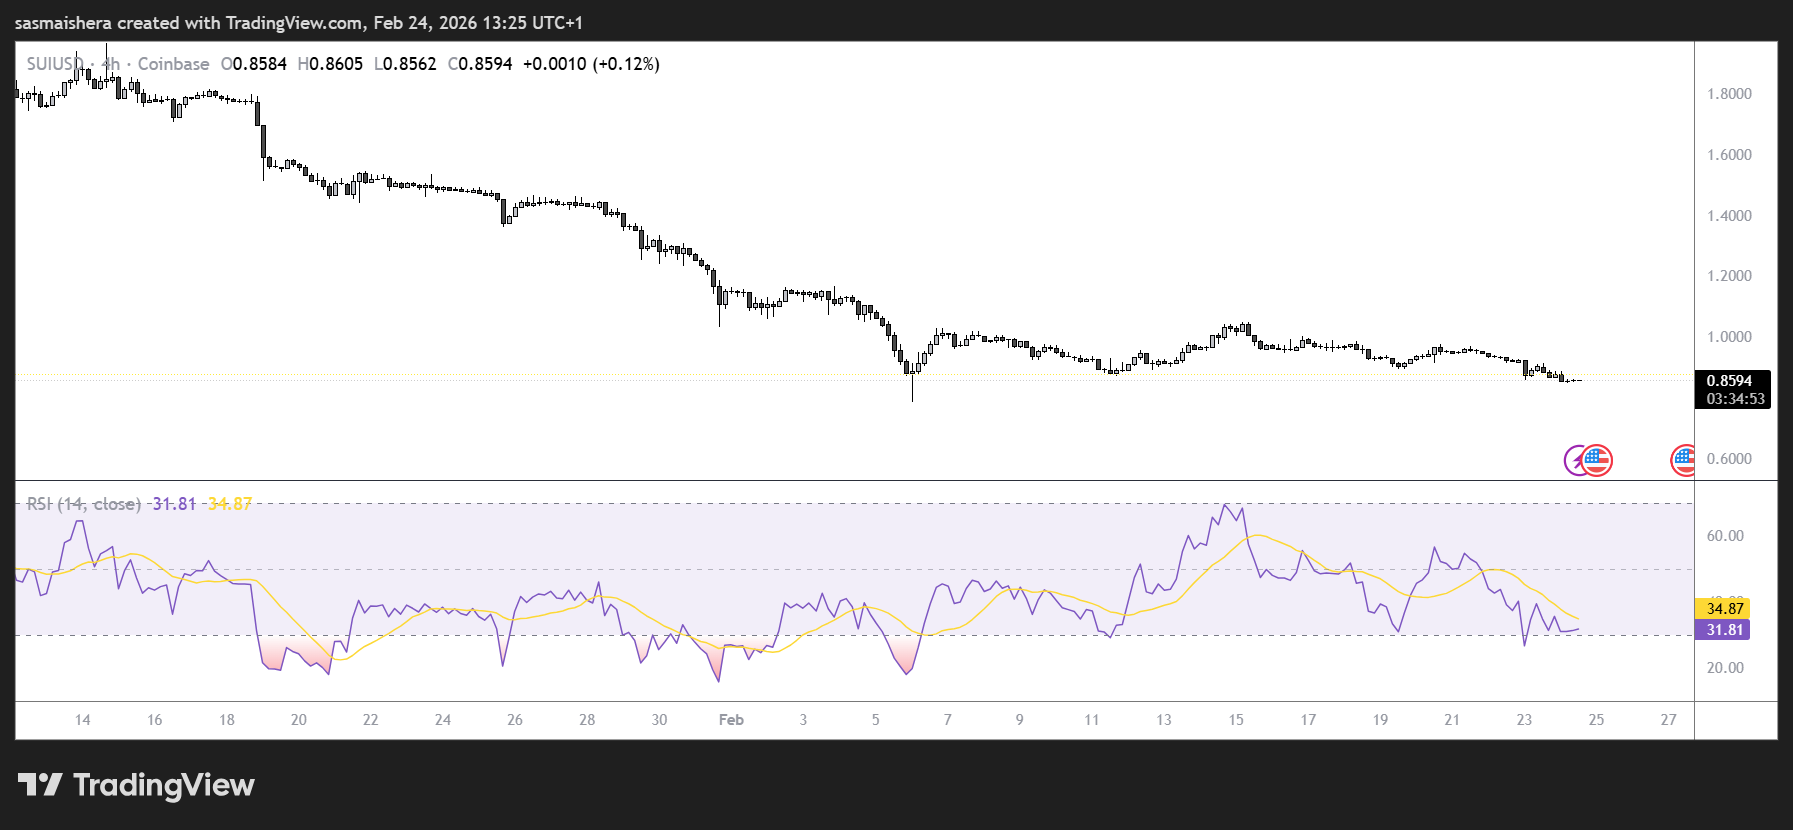
The Relative Strength Index (RSI) at 34 is below the neutral 50, indicating a growing bearish momentum. If the RSI continues to decline, it will soon enter the oversold region.
Meanwhile, the Moving Average Convergence Divergence (MACD) remains close to its signal line, indicating the risk of a bearish crossover.
The indicator flashed a sell signal a week ago, suggesting a strong bearish momentum.
If the bearish trend persists, SUI would likely retest the $0.70 support level in the near term.
However, the February 6 low of $0.7956 could allow the bulls to experience a relief.
The technical outlook for Sui remains bearish, implying a potential drop toward the nearest support.
The post SUI dips 5%, targets the $0.70 support level: check forecast appeared first on Invezz
0
0

 Manage all your crypto, NFT and DeFi from one place
Securely connect the portfolio you’re using to start.


0
0

0
0

0
0