Worldcoin (WLD) Derivatives Activity Down, Market Optimism Stays Strong

0
0

The value of WLD, the token that powers Worldcoin, the crypto project co-founded by OpenAI CEO Sam Altman, has witnessed a 40% price decline in the past 30 days.
This value dip has led to a reduction in activity in the token’s derivatives market.
Worldcoin Open Interest Falls to Six-Month Low
Worldcoin’s price decline in the last few days has led to a significant drop in activity in its derivatives market. This decline can be gleaned from the token’s open interest, which has now sat at its lowest since January.
WLD’s total open interest was $98 million as of this writing. It has been in a downtrend since it rallied to an all-time high of $440 million on March 9. This month alone, it has decreased by 51%.
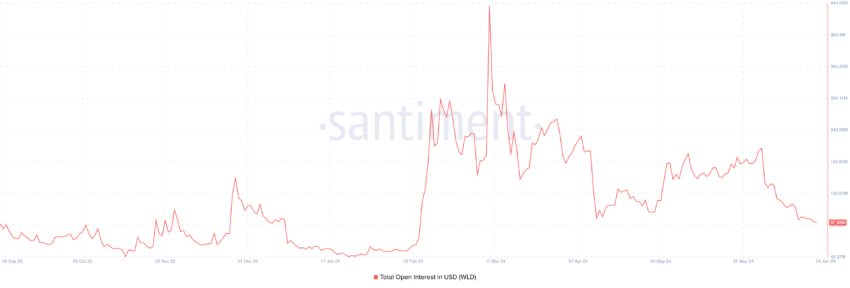 Worldcoin Open Interest. Source: Santiment
Open interest measures the total number of outstanding futures or options contracts that have not been settled or closed. When it declines, it suggests that traders are closing out their positions.
This leads to fewer active contracts in the market. It is often regarded as a bearish signal because it reduces market activity and traders’ interest.
However, despite WLD’s price decline and the drop in its open interest, the token’s aggregated funding rate across cryptocurrency exchanges has remained predominantly positive. At press time, WLD’s funding rate is 0.01%.
Read More: Worldcoin (WLD) Price Prediction 2024/2025/2030
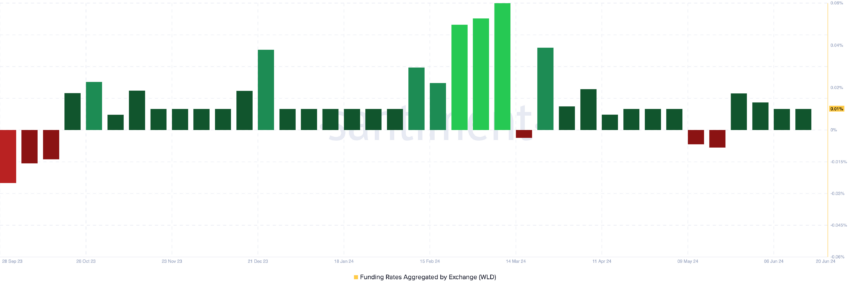 Worldcoin Funding Rate. Source: Santiment
Funding rates are a mechanism used in perpetual futures contracts to ensure the contract price stays close to the spot price.
When its value is positive, more traders hold long positions. This means that more traders expect the asset’s price to increase than buy it with the expectation of selling it at a lower price.
WLD Price Prediction: Spot Market Strategies Differ
WLD’s spot market participants have adopted a different approach. Readings from some of the token’s key technical indicators confirm the bearish bias towards it.
For example, WLD’s Accumulation/Distribution (A/D) Line has been in a downtrend since May. Since the beginning of June, the indicator’s value has plunged by 60%.
An asset’s A/D Line measures the cumulative flow of money into and out of the asset. Traders use it to gauge the buying and selling pressure in the market. When the A/D Line declines, it indicates a spike in selling pressure. This is a bearish sign, which implies that an asset’s supply is exceeding its demand.
Further, WLD’s Chaikin Money Flow (CMF), which measures how money flows into and out of its market, is -0.29 at press time.
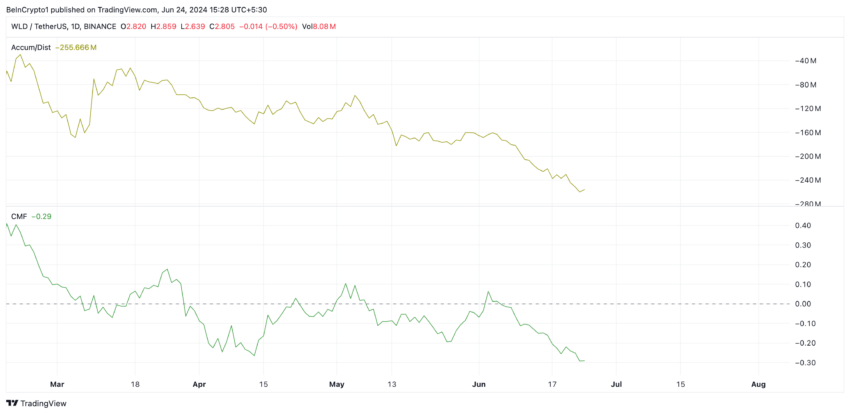 Worldcoin Analysis. Source: TradingView
A CMF value below zero is a sign of market weakness. It suggests liquidity exit and is often an indicator of a further price decline.
If this trend continues, WLD’s price may plummet to $2.50.
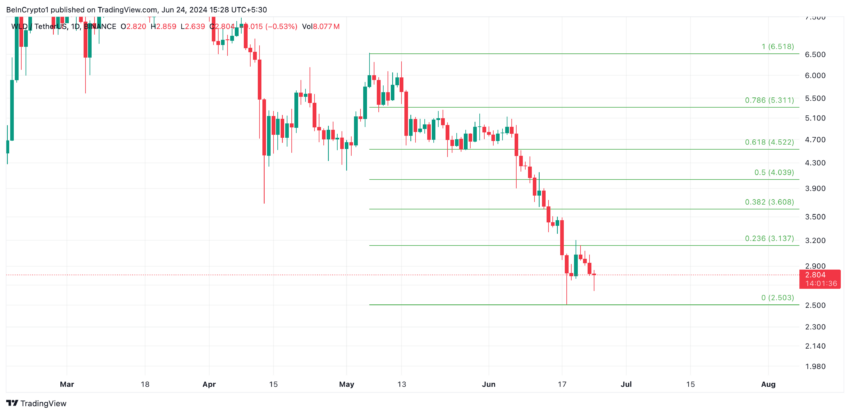 Worldcoin Analysis. Source: TradingView
However, if the bulls regain control and buying activity resumes, the token’s price might reach $3.13.
0
0


 Verwalten Sie alle Ihre Kryptowährungen, NFTs und DeFi an einem Ort
Verbinden Sie sicher das Portfolio, das Sie zu Beginn verwenden möchten.


0
0


0
0