
SPX6900 price prediction 2026-2032: Will SPX6900 soar 10x or crash?

0
0
Key takeaways:
- SPX6900 could climb toward $0.3975 by the end of 2026 based on current projections.
- SPX may reach $0.8461 by 2028 while averaging around $0.7488 during the year.
- Long-term forecasts place SPX6900 between $1.44 and $1.91 by 2032.
SPX6900 (SPX) is a meme cryptocurrency operating mainly on Ethereum. Its value depends largely on community interest, social media activity, and speculation.
Traders can access SPX through spot markets and perpetual contracts across centralized and decentralized exchanges. Leveraged trading remains risky because meme coins often experience sharp price swings.
SPX can be stored in wallets such as Trust Wallet, Bitget Wallet, and Ledger hardware devices. The token has about 930.99 million SPX in circulation, with a maximum supply of 1 billion.
SPX6900 gained wider attention after a strong rally in 2024, when the token surged nearly 9,000% within one month. Its performance has kept traders focused on SPX price predictions for 2026 and beyond.
Overview
| Cryptocurrency | SPX6900 |
| Token | SPX |
| Price | $0.3240 |
| Market Cap | $301.7M |
| Trading Volume (24-hour) | $4.15M |
| Circulating Supply | 930.99M SPX |
| All-time High | $2.28 (July 28, 2025) |
| All-time Low | $0.000002634 (August 16, 2023) |
| 24-hour High | $0.3379 |
| 24-hour Low | $0.3235 |
SPX6900 price prediction: Technical analysis
| Metric | Value |
| Price Prediction | $ 0.2440 (-25.04%) |
| Price Volatility | 5.46% (High) |
| 50-Day SMA | $ 0.3519 |
| 200-Day SMA | $ 0.3401 |
| Market Sentiment | Bearish |
| Fear & Greed Index | 30 (Fear) |
| Green Days | 13/30 (43%) |
| 14-Day RSI | 47.66 (Neutral) |
SPX6900 price analysis
- SPX6900 holds above key support after recovering from an earlier intraday decline.
- Price remains close to resistance, keeping another upside attempt possible if momentum improves.
- The four-hour structure stays stable as repeated rebounds continue protecting the broader recovery pattern.
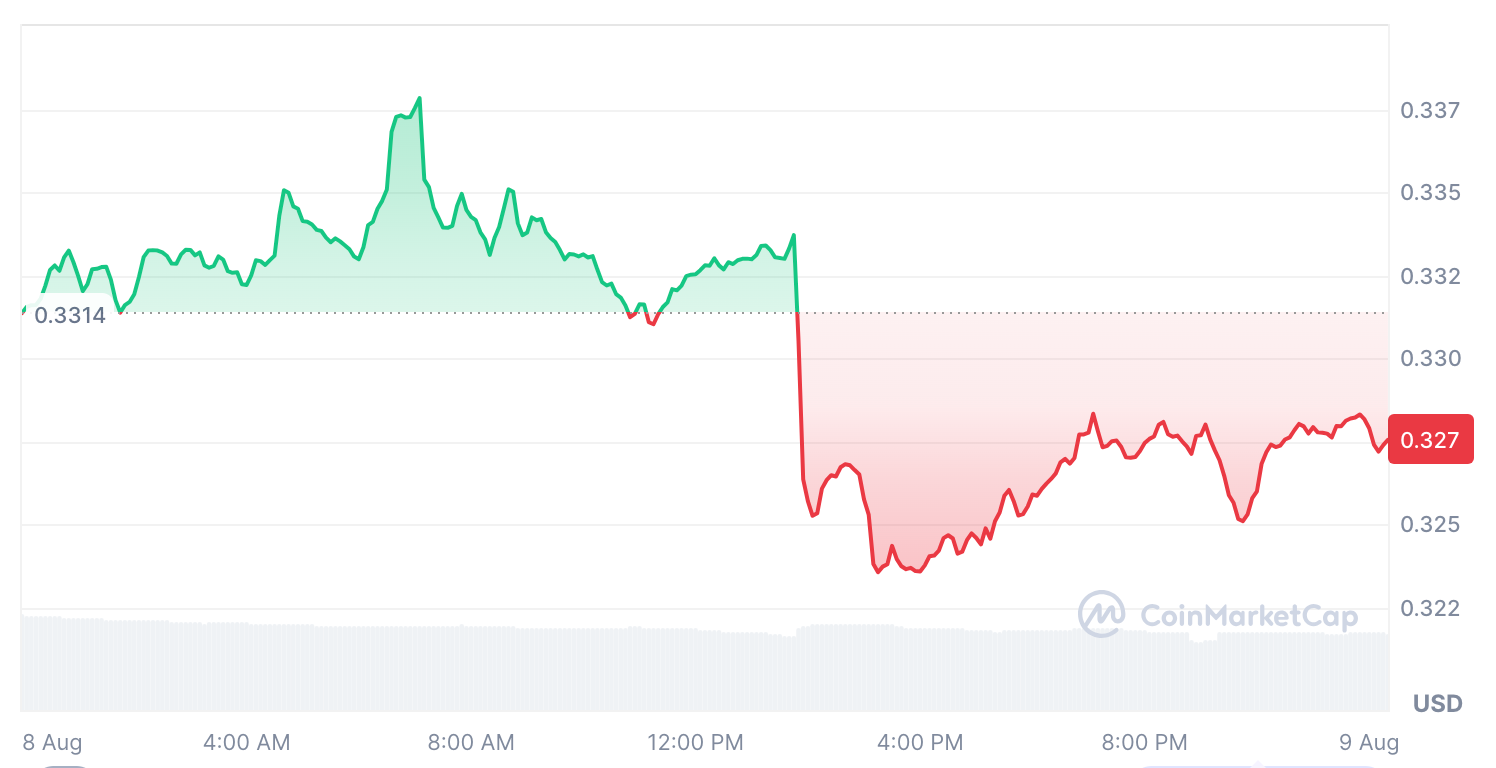
On 10 August 2026, SPX6900 SPX trades at $0.3264 after gaining 1.26% over the latest 24 hours. Immediate support stands near $0.3234, while resistance sits between $0.3300 and the $0.3326 daily high. SPX records a 24-hour low of $0.3179 before recovering sharply toward the upper range. The rebound follows an early drop below $0.3234, although SPX later regains that level and holds above it.
SPX6900/USD analysis on the 24-hour timeframe
The daily structure remains constructive as SPX holds above key support and preserves its recovery pattern. Sustained strength could support another attempt toward nearby resistance and keep the short-term outlook positive.
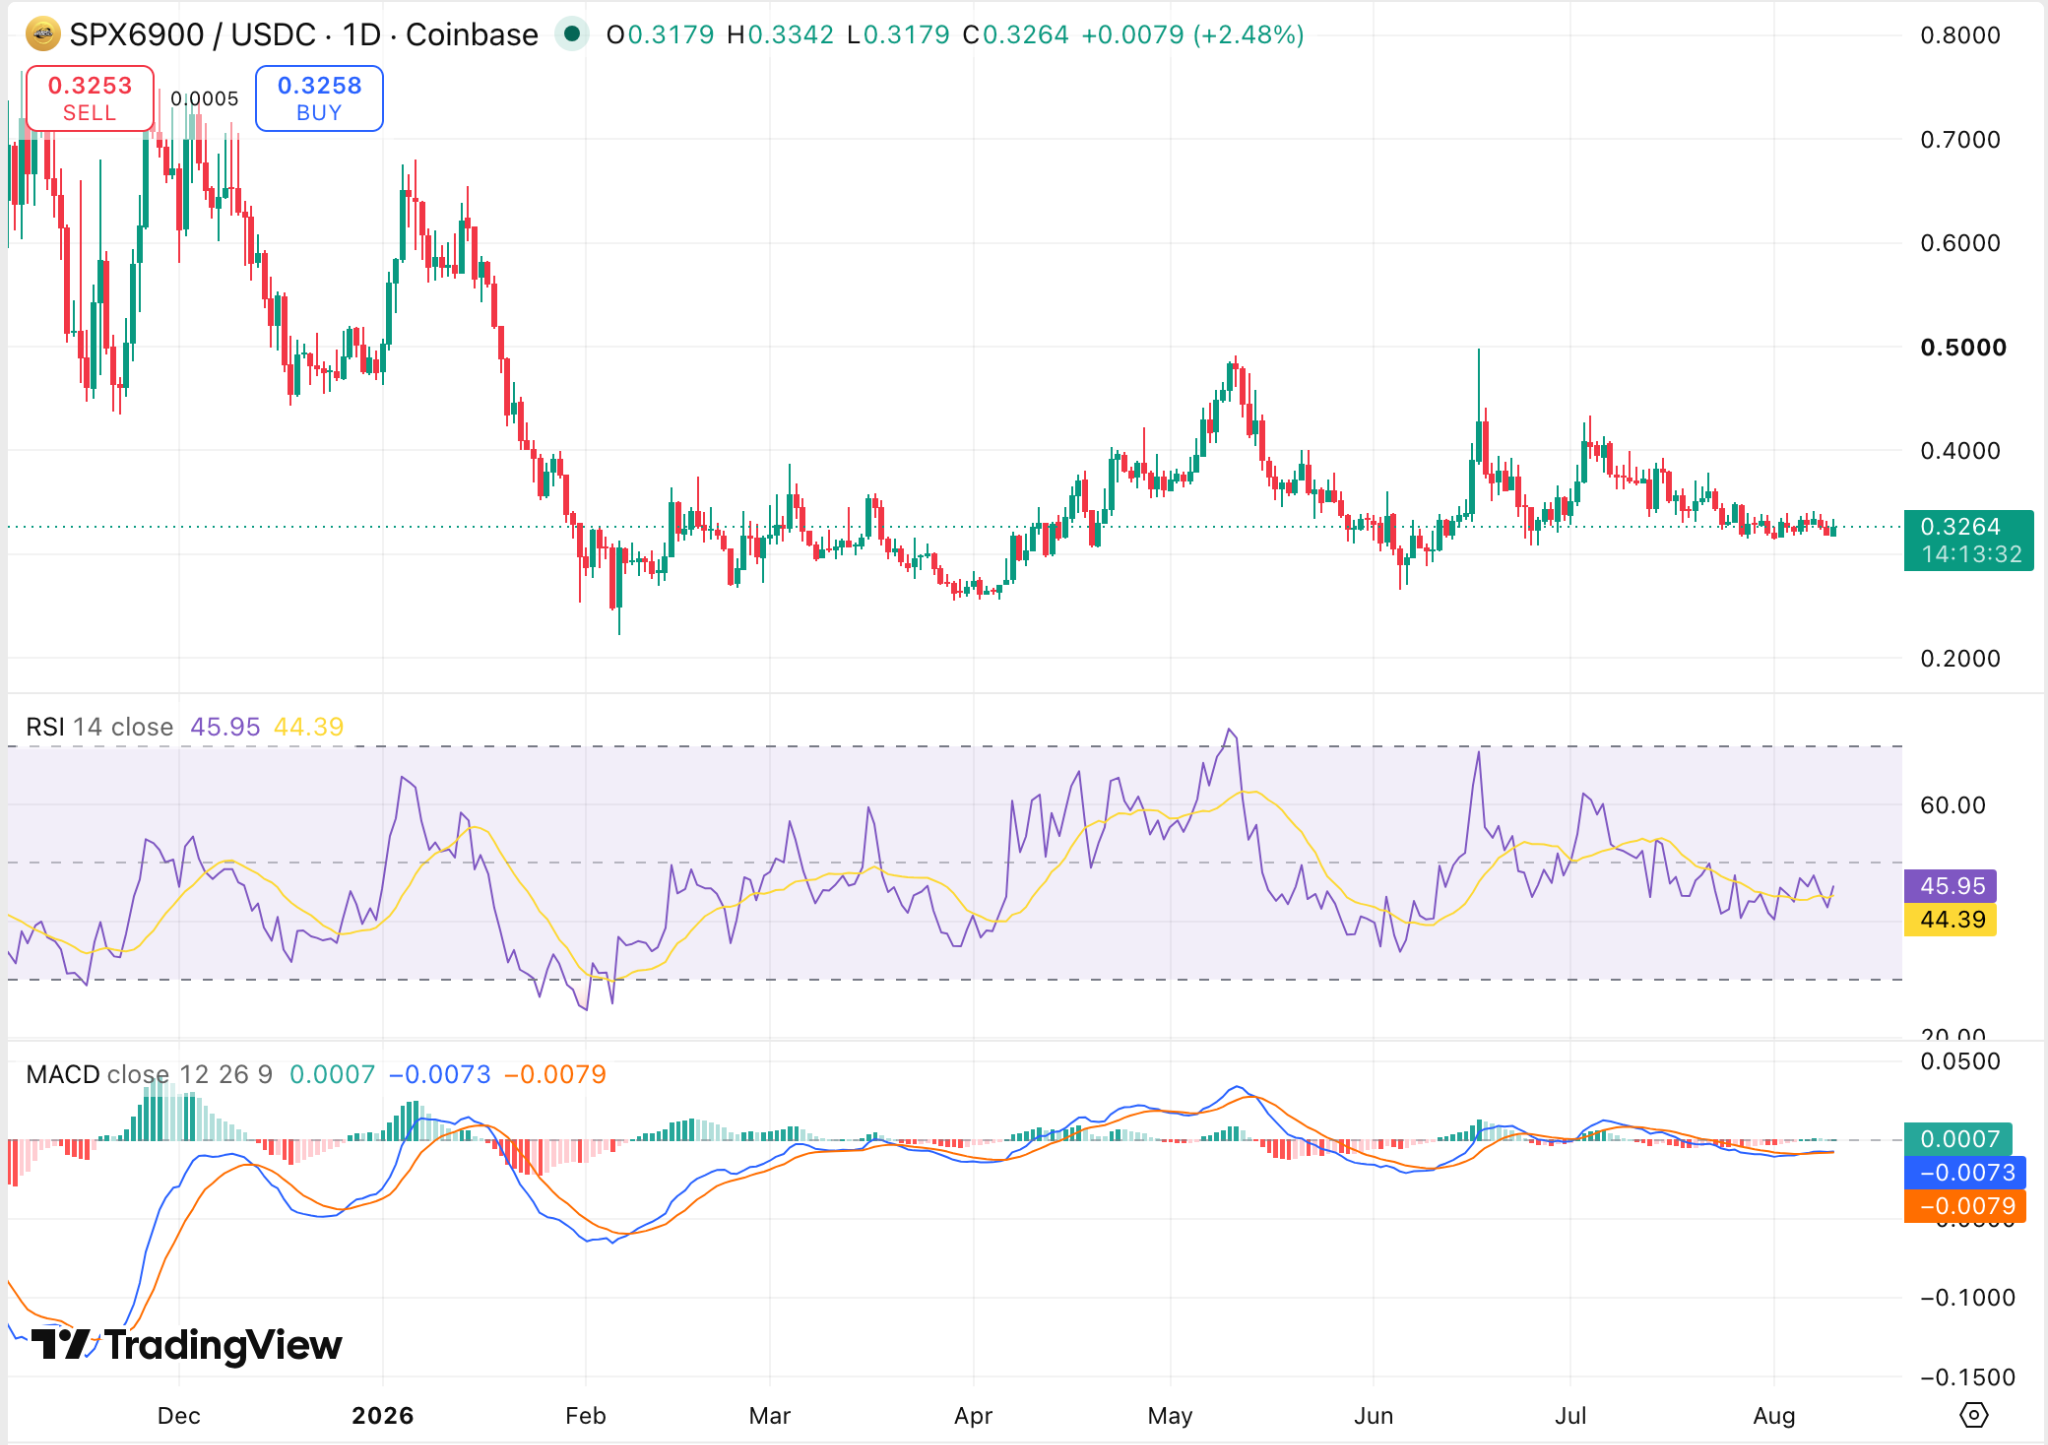
SPX6900 trades at $0.3264, while momentum indicators show signs of gradual improvement. The RSI stands at 45.95, slightly above its 44.39 average, indicating neutral momentum with a mild bullish tilt. The MACD line sits at -0.0073, above the -0.0079 signal line, while the histogram remains positive at 0.0007. This structure suggests momentum is stabilizing, although SPX still needs stronger follow-through to support a sustained upside move.
SPX6900 analysis on the 4-hour chart
The shorter-term structure shows repeated rebounds from key support areas during the displayed period. These recoveries indicate that SPX continues finding demand on pullbacks and maintains a relatively stable four-hour structure.
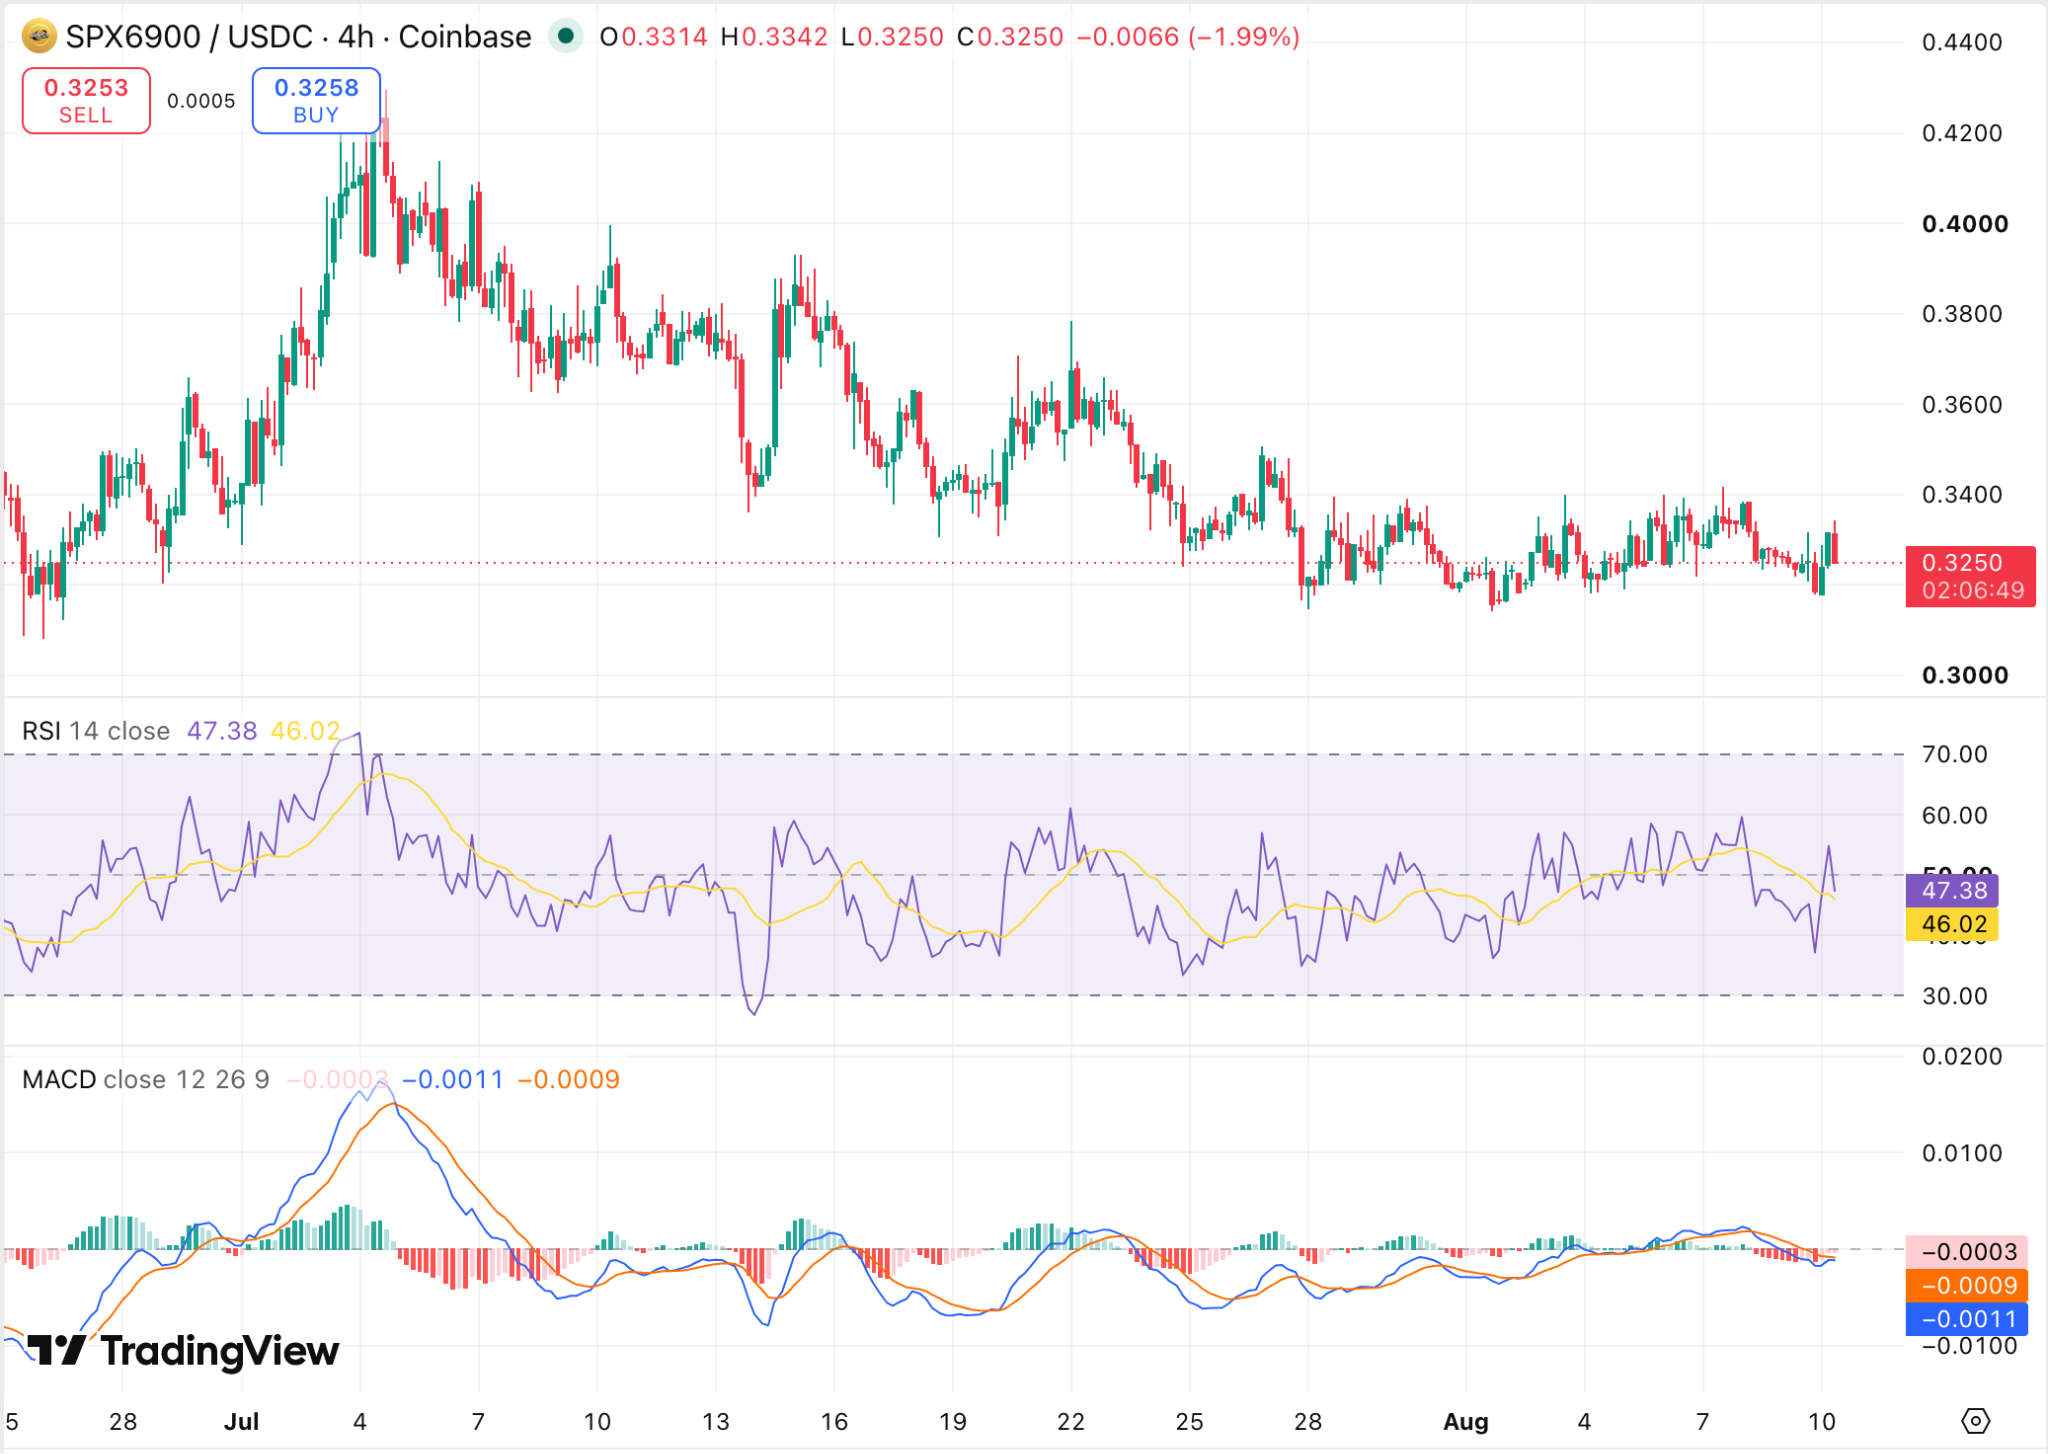
SPX6900 continues trading sideways on the four-hour timeframe as recent weakness limits directional momentum. The RSI stands at 47.38, slightly above its 46.02 average, indicating neutral conditions with a mild recovery bias. The MACD remains slightly negative, showing that short-term pressure has not fully cleared. Stronger momentum above nearby resistance could improve the four-hour structure and support further recovery.
SPX6900 technical indicators: Levels and action
Daily simple moving average (SMA)
| Period | Value | Action |
| SMA 3 | $ 0.3313 | SELL |
| SMA 5 | $ 0.3290 | SELL |
| SMA 10 | $ 0.3273 | SELL |
| SMA 21 | $ 0.3343 | SELL |
| SMA 50 | $ 0.3519 | SELL |
| SMA 100 | $ 0.3586 | SELL |
| SMA 200 | $ 0.3401 | SELL |
Daily exponential moving average (EMA)
| Period | Value | Action |
| EMA 3 | $ 0.3308 | SELL |
| EMA 5 | $ 0.3297 | SELL |
| EMA 10 | $ 0.3299 | SELL |
| EMA 21 | $ 0.3357 | SELL |
| EMA 50 | $ 0.3449 | SELL |
| EMA 100 | $ 0.3541 | SELL |
| EMA 200 | $ 0.4382 | SELL |
What to expect from SPX6900 price analysis?
SPX6900 remains positioned between nearby support and resistance, leaving the short-term outlook balanced. Holding above support could preserve the recovery structure and keep another upside attempt possible.
A stronger move through resistance would improve the bullish setup and open room for further gains. However, renewed weakness below support could shift momentum lower and expose SPX to another pullback.
Why is SPX up?
SPX is rising after recovering from an earlier intraday decline and reclaiming an important support area. The rebound has kept the short-term structure stable and pushed price back toward nearby resistance.
The advance also reflects improving momentum across both the daily and four-hour timeframes. Continued strength above support could keep the recovery intact and support another attempt higher.
Is SPX6900 a good investment?
SPX6900 could benefit from its limited token supply and continued market interest. However, future prices will depend on sentiment, broader crypto trends, and overall market conditions.
SPX remains highly volatile, making careful risk management important. Investors should research the project thoroughly and only commit funds they can afford to risk.
Will SPX reach $5?
SPX6900 would need significant price and market capitalization growth to reach $5. Although ambitious, this target could become possible with stronger adoption and sustained market demand. Current projections indicate SPX may approach the $5 level sometime after 2032.
Will SPX6900 reach $10?
SPX6900 is unlikely to reach $10 based on current price forecasts. Prediction models place its highest projected value near $8.06 by 2046. This suggests SPX could see long-term growth while remaining below the $10 target.
Does SPX6900 have a good long-term future?
Long-term forecasts point to gradual growth for SPX6900, with stronger momentum expected toward 2029. By 2032, SPX could trade above $1.30, alongside a projected FDV near $427.33 million.
SPX6900 depends mainly on community support, meme culture, and speculation rather than traditional utility. Its satirical branding and S&P 500 references parody conventional finance while reinforcing the project’s meme-driven identity.
SPX6900 price prediction August 2026
SPX is projected to trade within a range this month, with a potential high of $0.3378, an average price of $0.3156, and a minimum trading level of $0.27.
| SPX6900 price prediction | Minimum price | Average price | maximum price |
| SPX6900 price prediction August 2026 | $0.27 | $0.3156 | $0.3378 |
SPX6900 price prediction 2026
SPX6900 could trade between $0.2934 and $0.3975 during 2026, according to current projections. The token’s average price could remain near $0.3421 as market conditions develop throughout the year.
| SPX6900 price prediction | Minimum price | Average price | maximum price |
| SPX6900 price prediction 2026 | $0.2934 | $0.3421 | $0.3975 |
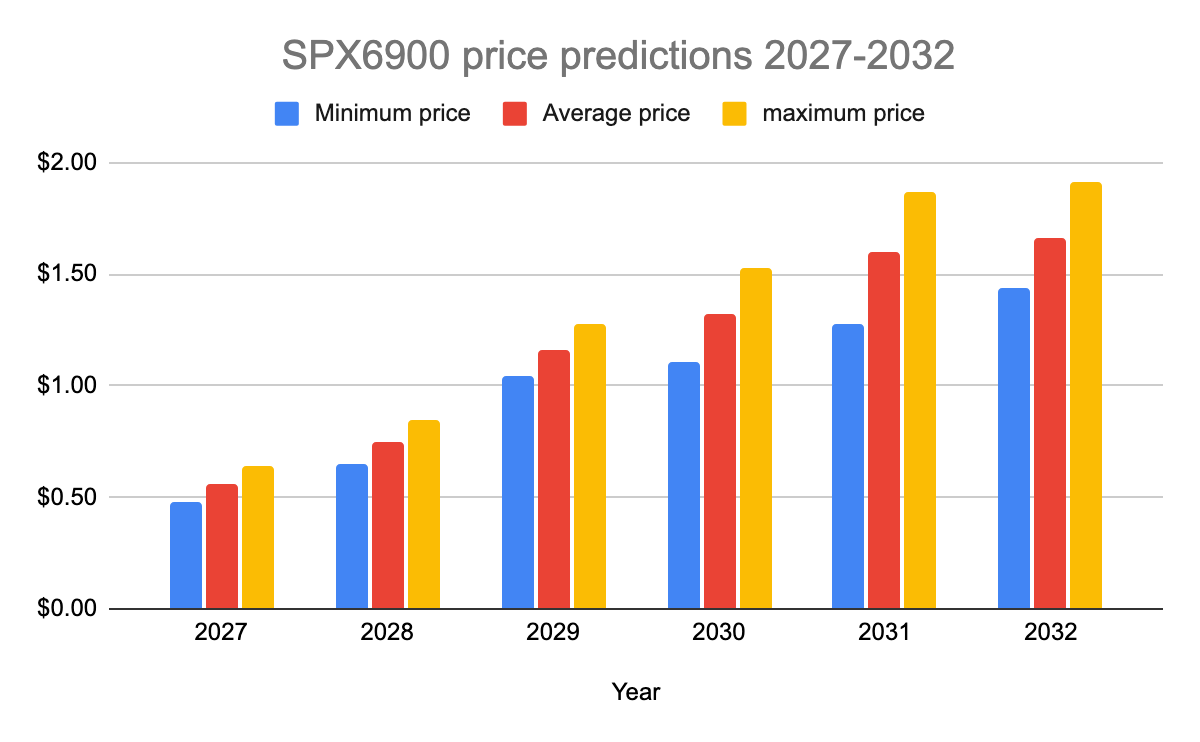
SPX6900 price predictions 2027-2032
| Year | Minimum price | Average price | maximum price |
| 2027 | $0.4823 | $0.5608 | $0.6393 |
| 2028 | $0.6514 | $0.7488 | $0.8461 |
| 2029 | $1.04 | $1.16 | $1.28 |
| 2030 | $1.11 | $1.32 | $1.53 |
| 2031 | $1.28 | $1.60 | $1.87 |
| 2032 | $1.44 | $1.66 | $1.91 |
SPX6900 price prediction 2027
SPX6900 could trade between $0.4823 and $0.6393 during 2027, based on current projections. The token’s average price is forecast near $0.5608 as market conditions and demand develop.
SPX6900 price prediction 2028
SPX6900 could trade between $0.6514 and $0.8461 during 2028, based on current price projections. The token’s average price is forecast near $0.7488 throughout the year.
SPX6900 price prediction 2029
SPX6900 could trade between $1.04 and $1.28 during 2029, based on long-term price projections. The token’s average trading price is forecast near $1.16 throughout the year.
SPX6900 price prediction 2030
SPX6900 could trade between $1.11 and $1.53 during 2030, according to current projections. The token’s average trading price is forecast near $1.32 throughout the year.
SPX6900 price prediction 2031
SPX6900 could trade between $1.28 and $1.87 during 2031, based on current price projections. The token’s average trading price is forecast near $1.60 throughout the year.
SPX6900 price prediction 2032
SPX6900 could trade between $1.44 and $1.91 during 2032, according to current price projections. The token’s average trading price is forecast near $1.66 throughout the year.
SPX6900 market price prediction: Analysts’ SPX price forecast
| Firm Name | 2026 | 2027 |
| DigitalCoinPrice | $ 0.3375 | $0.3380 |
| CoinCodex | $0.3366 | $0.3323 |
Cryptopolitan’s SPX6900 price prediction
SPX could reach a maximum price of $0.3975 by the end of 2026. In 2027, SPX may trade between $0.4823 and $0.6393, depending on broader market momentum. Looking further ahead, the 2032 forecast places SPX between $1.44 and $1.91, with an average price near $1.66.
These projections remain speculative and could shift as cryptocurrency market conditions change. Investors should conduct independent research and carefully assess potential risks before making investment decisions.
SPX6900 historic price sentiment
- SPX6900 was launched in August 2023 by its primary creators with an opening price of $0.003 but remained under the radar for over a year.
- In October 2023, SPX’s value spiked to $0.023 under bullish control, which was a considerable growth trajectory, but it remained far from market attention.
- December of 2023 saw a low price of $0.008, which was quite low compared to the price in October, as per crypto market historical data.
- SPX6900 saw a stagnating price movement from January to May 2024, only to rise periodically to $0.015.
- In September 2024, SPX6900 gained an enormous 5600% from September 12 to October 14, reaching $0.913, resulting in a massive market capitalization.
- The token made higher spikes till November 7, 2024, adding significantly to its market cap; however, the token’s price has deteriorated afterwards.
- On November 21, SPX6900 stooped to $0.450, losing 50% of its value, which made holders cautious. However, the token regained its lost value and ended the year at $0.856.
- The meme token entered January 2025 with a price tag of $0.866, but it soon jumped to $1.55 as its circulation and acceptance increased.
- It corrected strongly in search of support at the start of February, attaining an average price of $0.66, but came down to the 0.46 range in March.
- In April, the coin was trading near $0.386 on the lower side, while in May, it saw a fabulous recovery, peaking at $1.11 along with some other cryptocurrencies.
- On June 11, the meme coin attained its all-time high of $1.73, and on July 28, it marked another ATH at $2.27.
- SPX maintained a trading range of $1.06 to $2 in August under complete bullish dominance, proving itself a reliable asset, and was trading at an average price of $1.16 in September.
- In October 2025, SPX6900 was trading near $1.6, and in November, it fell to $0.78 after losing 50% of its value. In December, the downtrend continued as the token touched $0.63.
- At the start of January 2026, SPX6900 was trading near $0.648, but in March, it slipped to $0.336.
- In April, SPX6900 was trading near $0.28, and in May it increased to $0.42, but it decreased to $0.316 again in June, as the current market sentiment turned bearish to neutral.
- According to the latest data, SPX is trading near $0.3770 as July begins, reflecting its current market position at the start of the month.
- The token began August 2026 near $0.3204 before experiencing several volatile sessions. SPX briefly moved above $0.3000 as the month progressed, while remaining well below its historical peak.
0
0


 Manage all your crypto, NFT and DeFi from one place
Securely connect the portfolio you’re using to start.


0
0

0
0

0
0