Bitcoin Suffers Technical Setback, Loses 100-Day Average as XRP, ETH and SOL Hold Ground
0
0

This is a daily analysis by CoinDesk analyst and Chartered Market Technician Omkar Godbole.
Bitcoin's (BTC) technical outlook has deteriorated over the past 24 hours, with prices dropping below a key moving average for the first time since April. This breakdown has left BTC at a disadvantage compared to major tokens such as Ether (ETH), XRP, and Solana (SOL).
BTC loses 100-day SMA
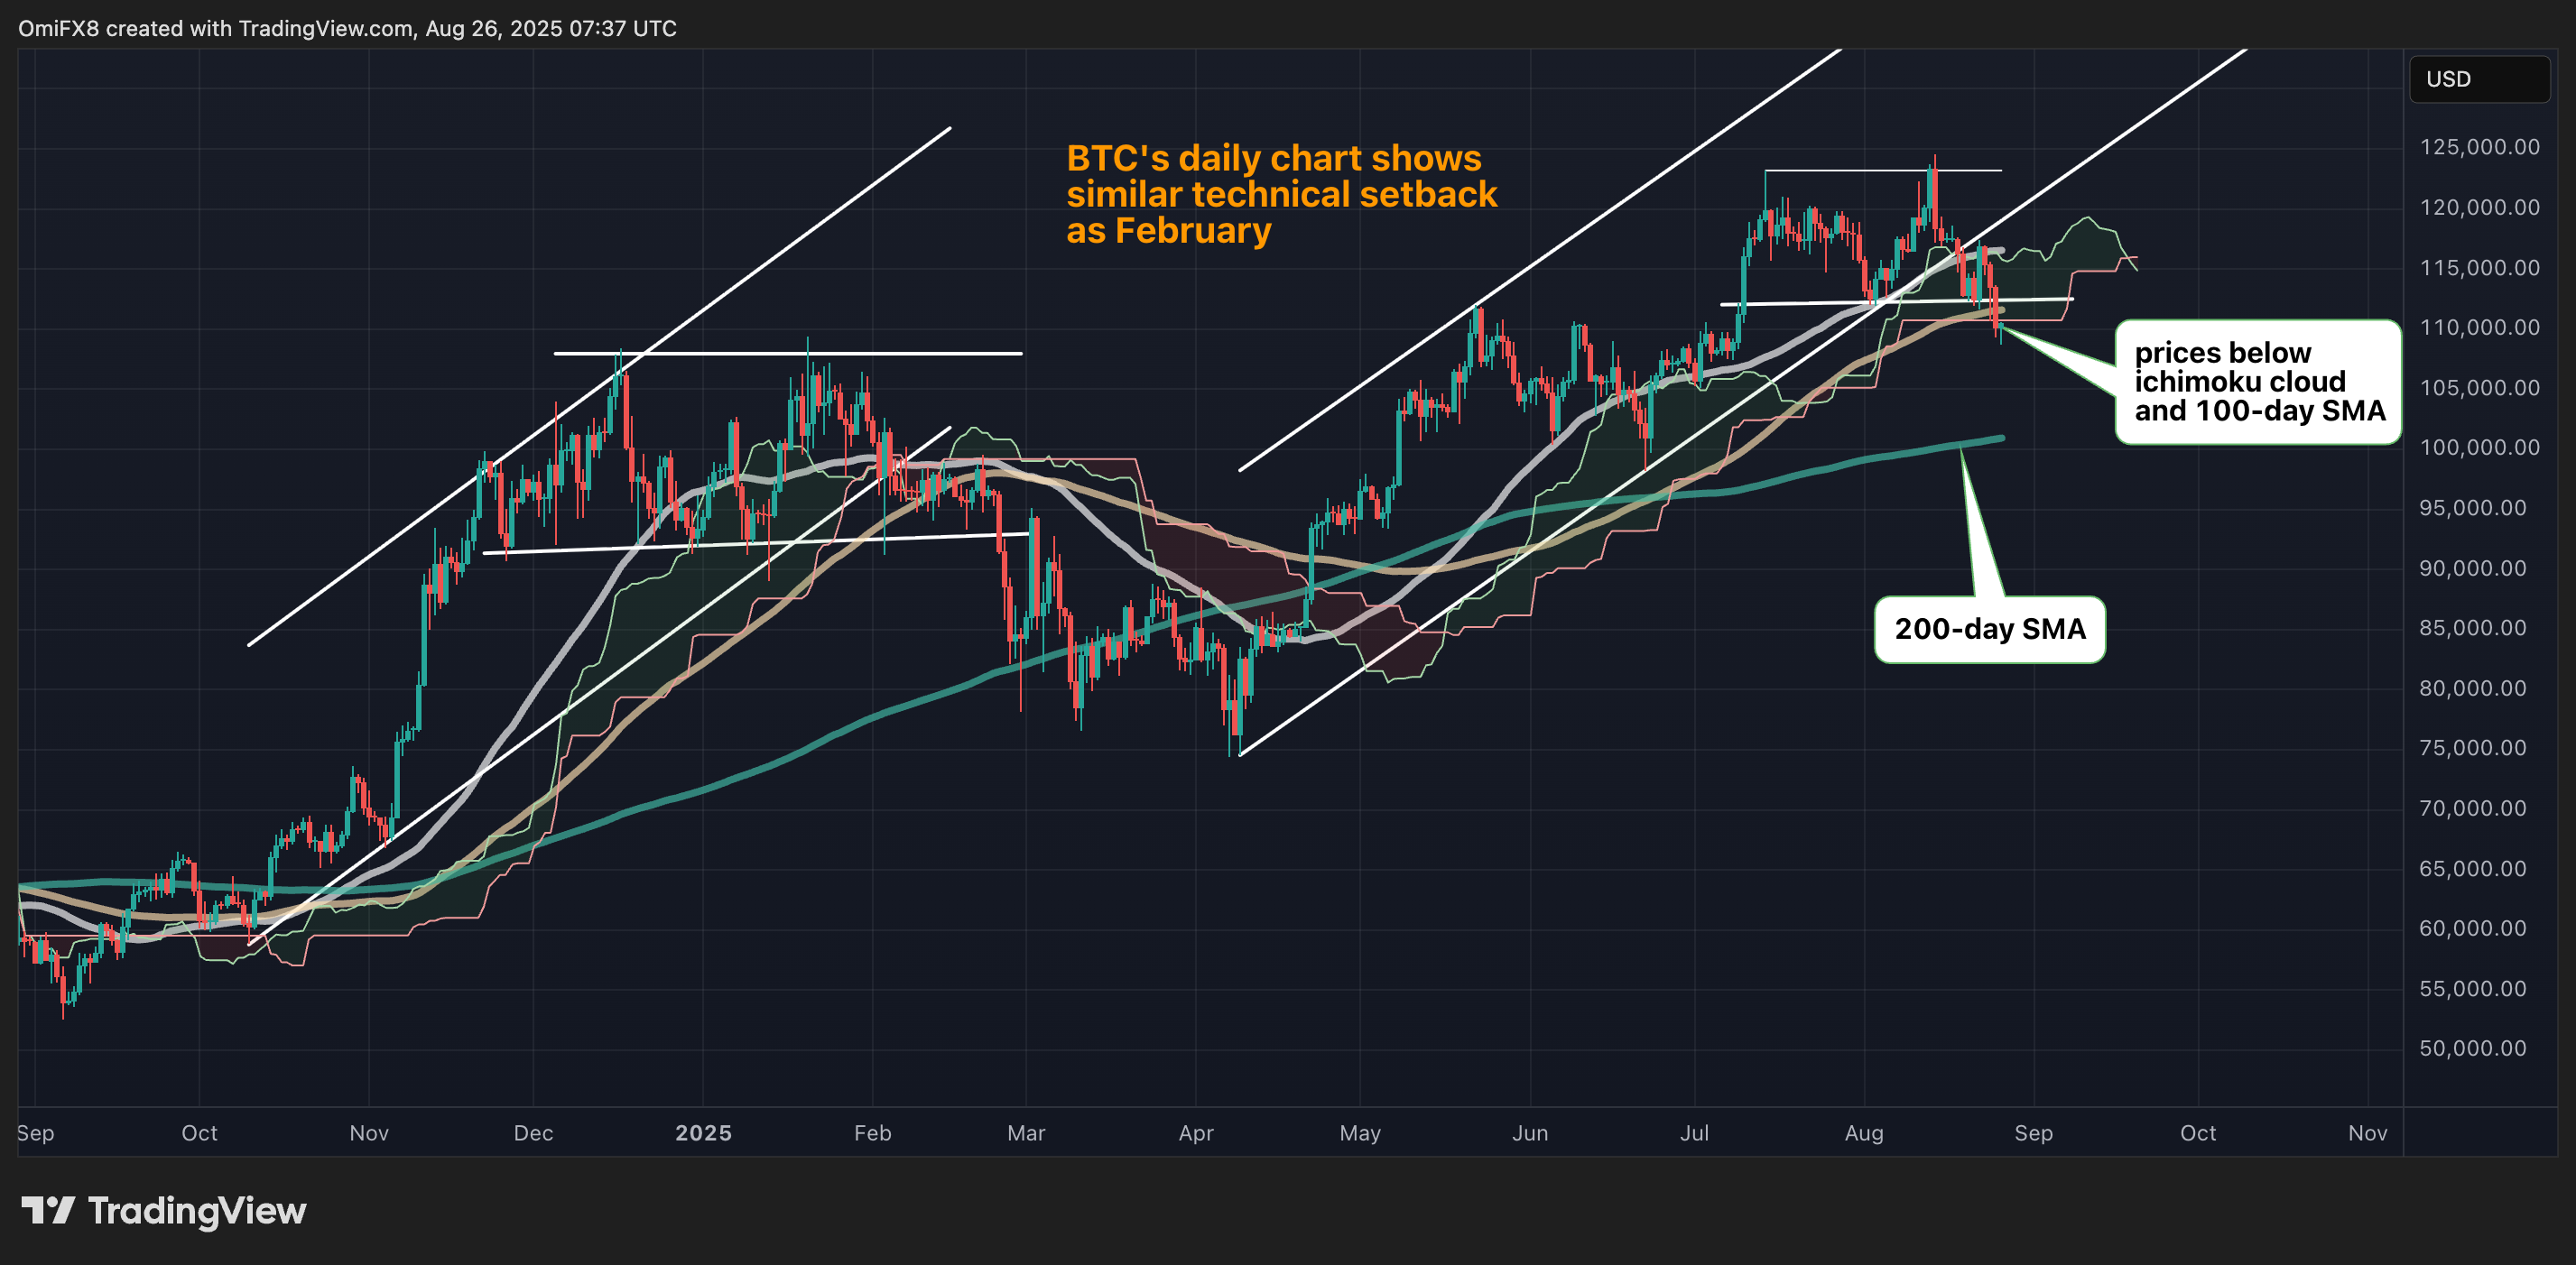
BTC has dropped over 1% in the past 24 hours, hitting a low of $109,172 at one point.
In the process, the cryptocurrency has convincingly dipped below the 100-day simple moving average (SMA), a widely tracked momentum indicator and support/resistance line, for the first time since April 22.
Further, prices have crossed below the Ichimoku cloud, indicating a bearish shift in momentum.
The dual breakdown has bolstered the bearish technical outlook suggested by the recent violation of the upward-sloping trendline from the April lows and the consecutive negative prints on the longer-duration MACD histogram. Taken together, the recent pattern looks similar to the February breakdown that set the stage for a deeper sell-off to $75K.

The next key level to watch out for is $105,390, which is the 38.2% Fibonacci retracement of the April-July rally, followed by the 200-day SMA at $100,928.
The bulls need to overcome the lower high of $117,416 created on Aug. 22 to negate the bearish technical setup.
- Resistance: $111,592, $117,416, $120,000
- Support: $105,390, $100,928, $100,000.
XRP, ETH and SOL hold ground
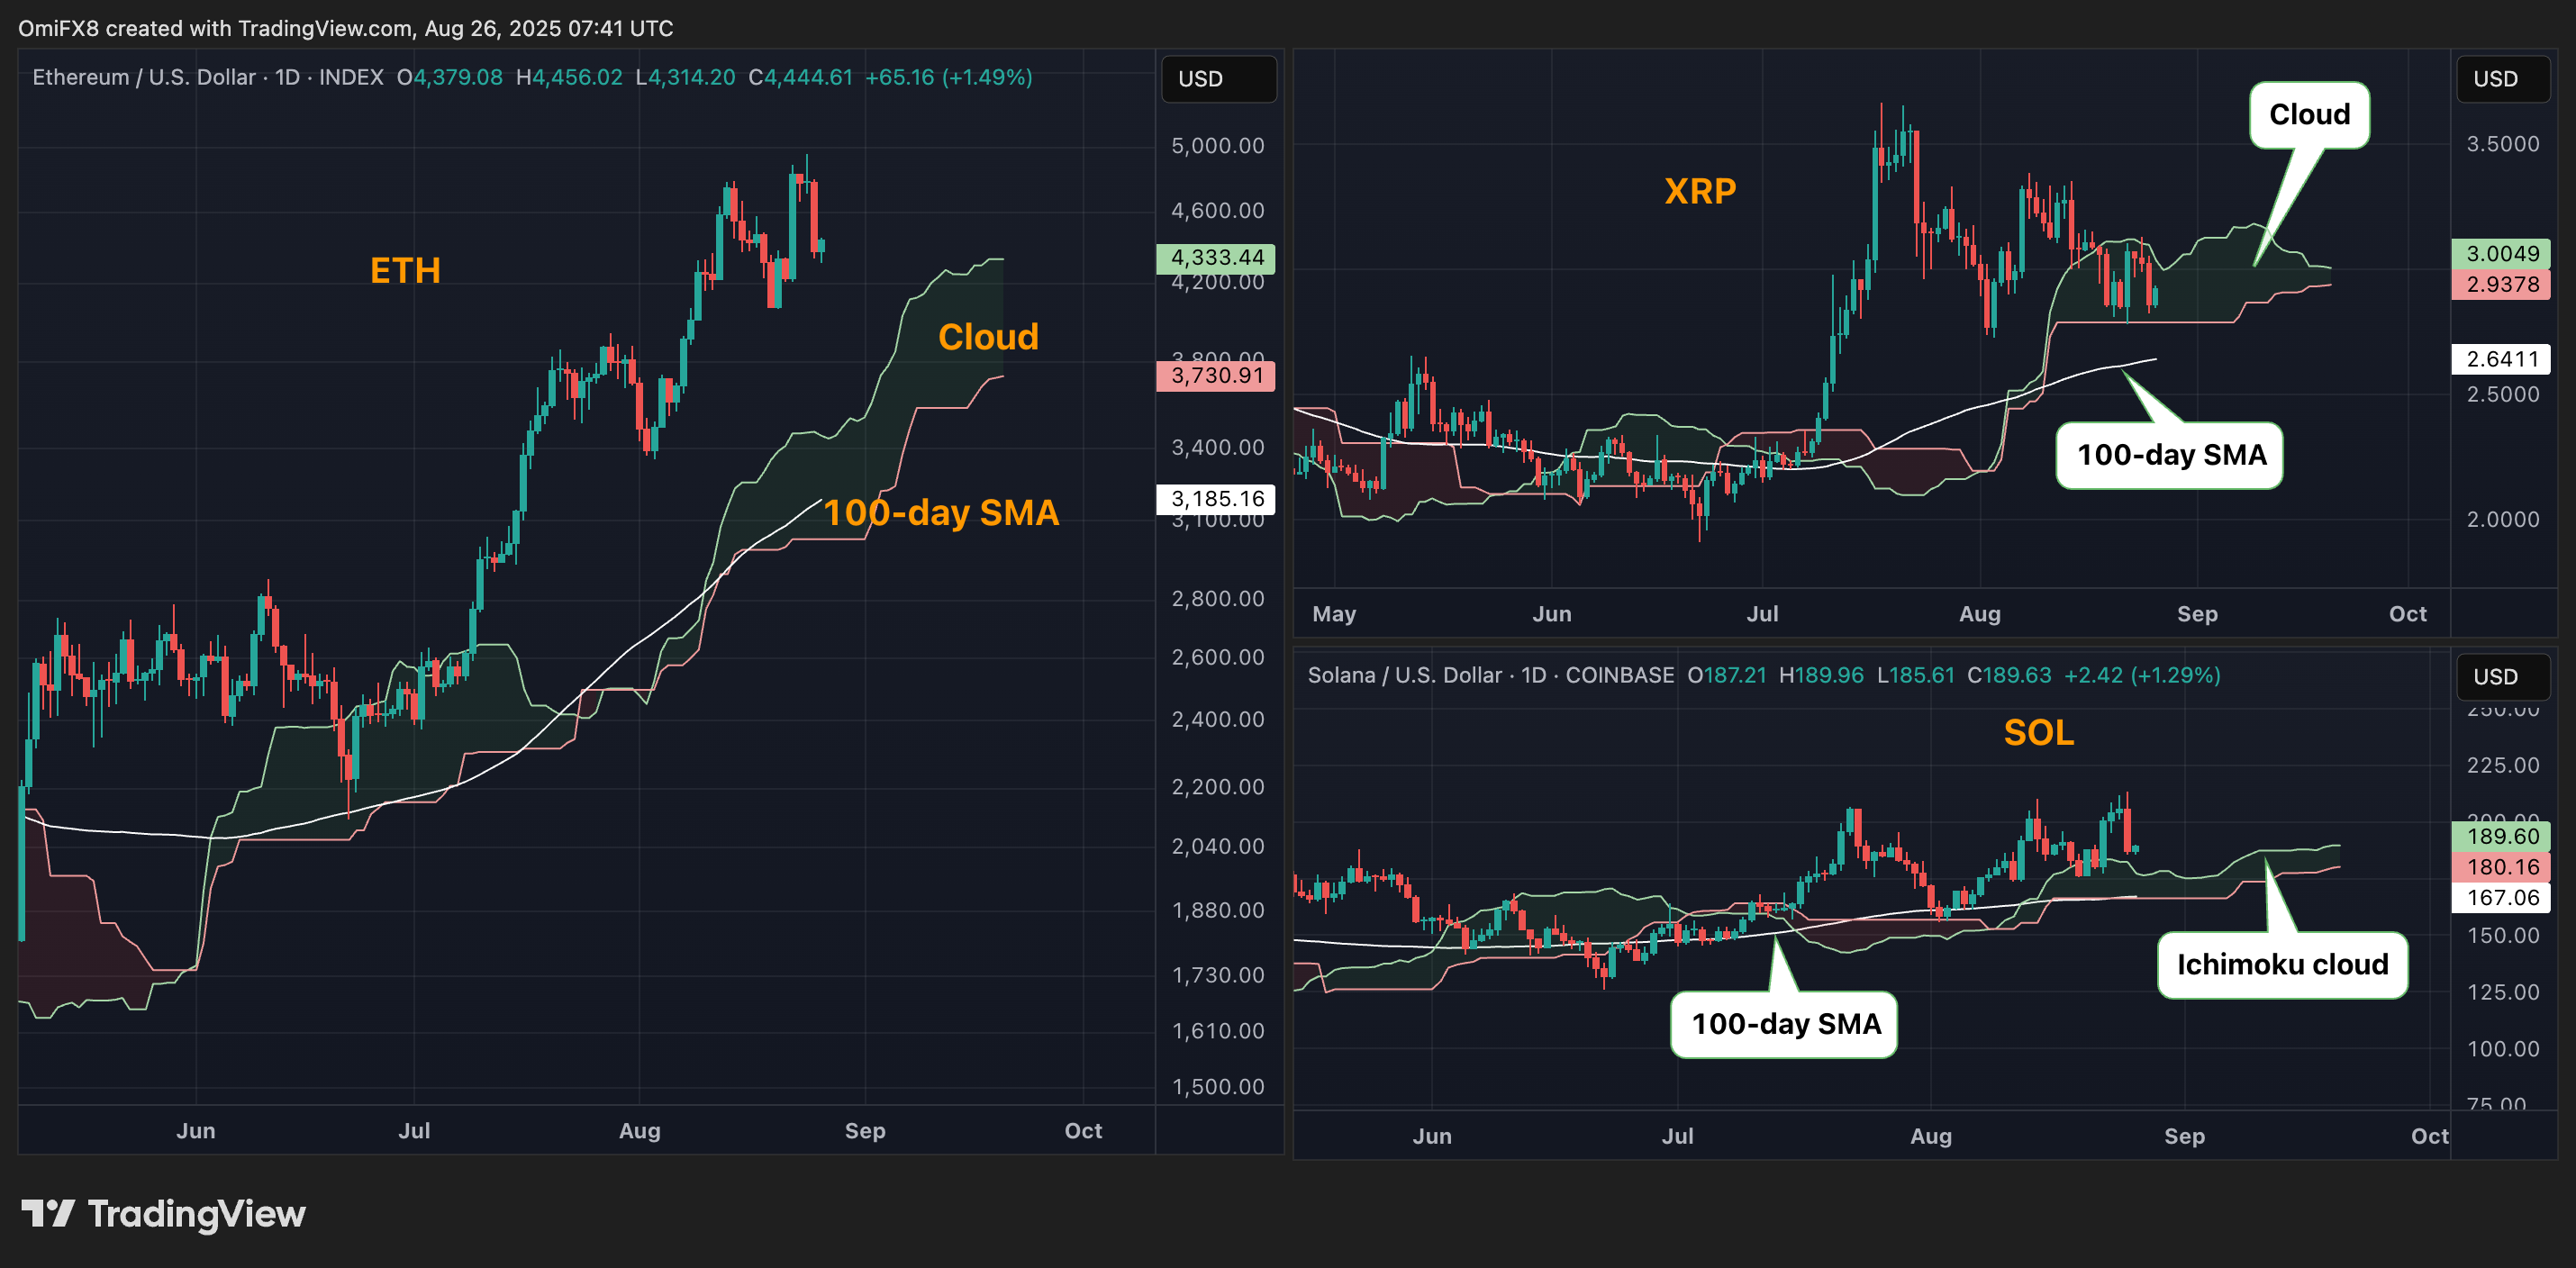
While bitcoin has suffered the dual breakdown, XRP continues to trade above its 100-day SMA. However, prices are "stuck in the Ichimoku cloud," whichmeans the token is trading within a zone of uncertainty and consolidation where neither bulls nor bears are willing to lead the price action. It suggests indecision and lack of a strong trend.
Meanwhile, ether and SOL continue to trade above their respective 100-day SMAs and Ichimoku clouds. Therefore, a potential risk-on could see both ETH and SOL outperform BTC and XRP.

Read more: Massive $14.6B Bitcoin and Ether Options Expiry Shows Bias for Bitcoin Protection
0
0
 Manage all your crypto, NFT and DeFi from one place
Securely connect the portfolio you’re using to start.


