Why Is The Crypto Market Down Today?

0
0

The total crypto market cap (TOTAL) and Bitcoin (BTC) both faced slight declines following the debacle of the CLARITY Act. Altcoins faced the bearishness as well, with Pippin (PIPPIN) marking a 35% drop in 24 hours.
In the news today:-
- A new US housing bill temporarily banned the Federal Reserve from issuing a digital dollar until 2030, marking a shift in CBDC opposition. The bipartisan 21st Century ROAD to Housing Act also addresses housing affordability and prevents large investors from acquiring single-family homes.
- Japanese Prime Minister Sanae Takaichi disavowed a cryptocurrency launched in her name, causing its value to plummet 58%. The token, issued by Yuji Mizoguchi’s NoBorder DAO, triggered regulatory investigations after launching without her consent.
The Crypto Market Is Stable
The total crypto market cap has decreased by $41.5 billion, now sitting at $2.29 trillion, slipping below the $2.30 trillion threshold. While this decline signals a shift in momentum, it does not necessarily indicate a long-term bearish trend. The market could still stabilize or experience a temporary recovery.
Investor sentiment remains cautious, contributing to the decline in market cap. If skepticism continues to dominate market behavior, the total crypto market cap (TOTAL) could fall further to $2.22 trillion. This would signal a deepening of negative momentum, but it may not trigger a full-blown bear market.
Want more token insights like this? Sign up for Editor Harsh Notariya’s Daily Crypto Newsletter here.
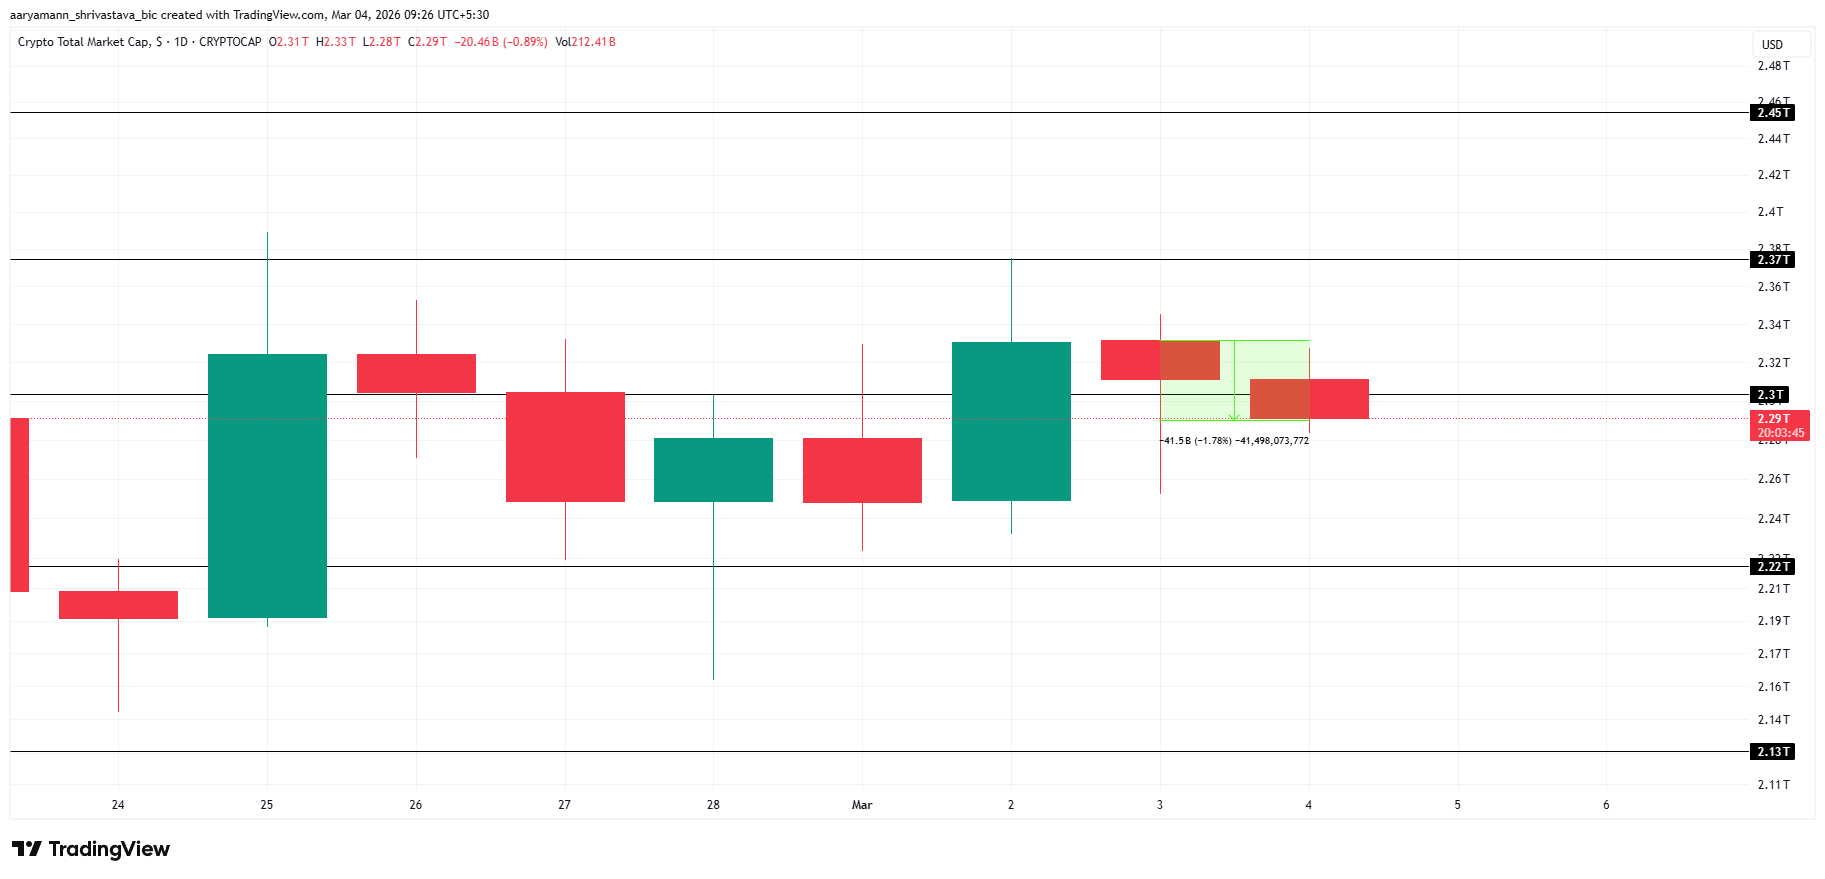 TOTAL Price Analysis. Source: TradingView
If the market rebounds before substantial damage occurs, the crypto market could recover and climb back to $2.37 trillion. A recovery to this level would help prevent further losses and signal a potential uptrend, offering a chance for a return to bullish conditions.
Bitcoin Is Under Resistance
Bitcoin’s price is currently at $67,585, just below the $68,830 resistance level. The cryptocurrency has been trading within a range of $70,000 and $65,000 for an extended period. This sideways movement suggests that Bitcoin is in a consolidation phase, lacking a clear direction for the near future.
At this point, no clear signs of a breakout or crash are visible. The market remains in a holding pattern, with Bitcoin needing to maintain support above $66,224 to avoid further downside. This level is key to ensuring that Bitcoin’s price remains stable in the short term.
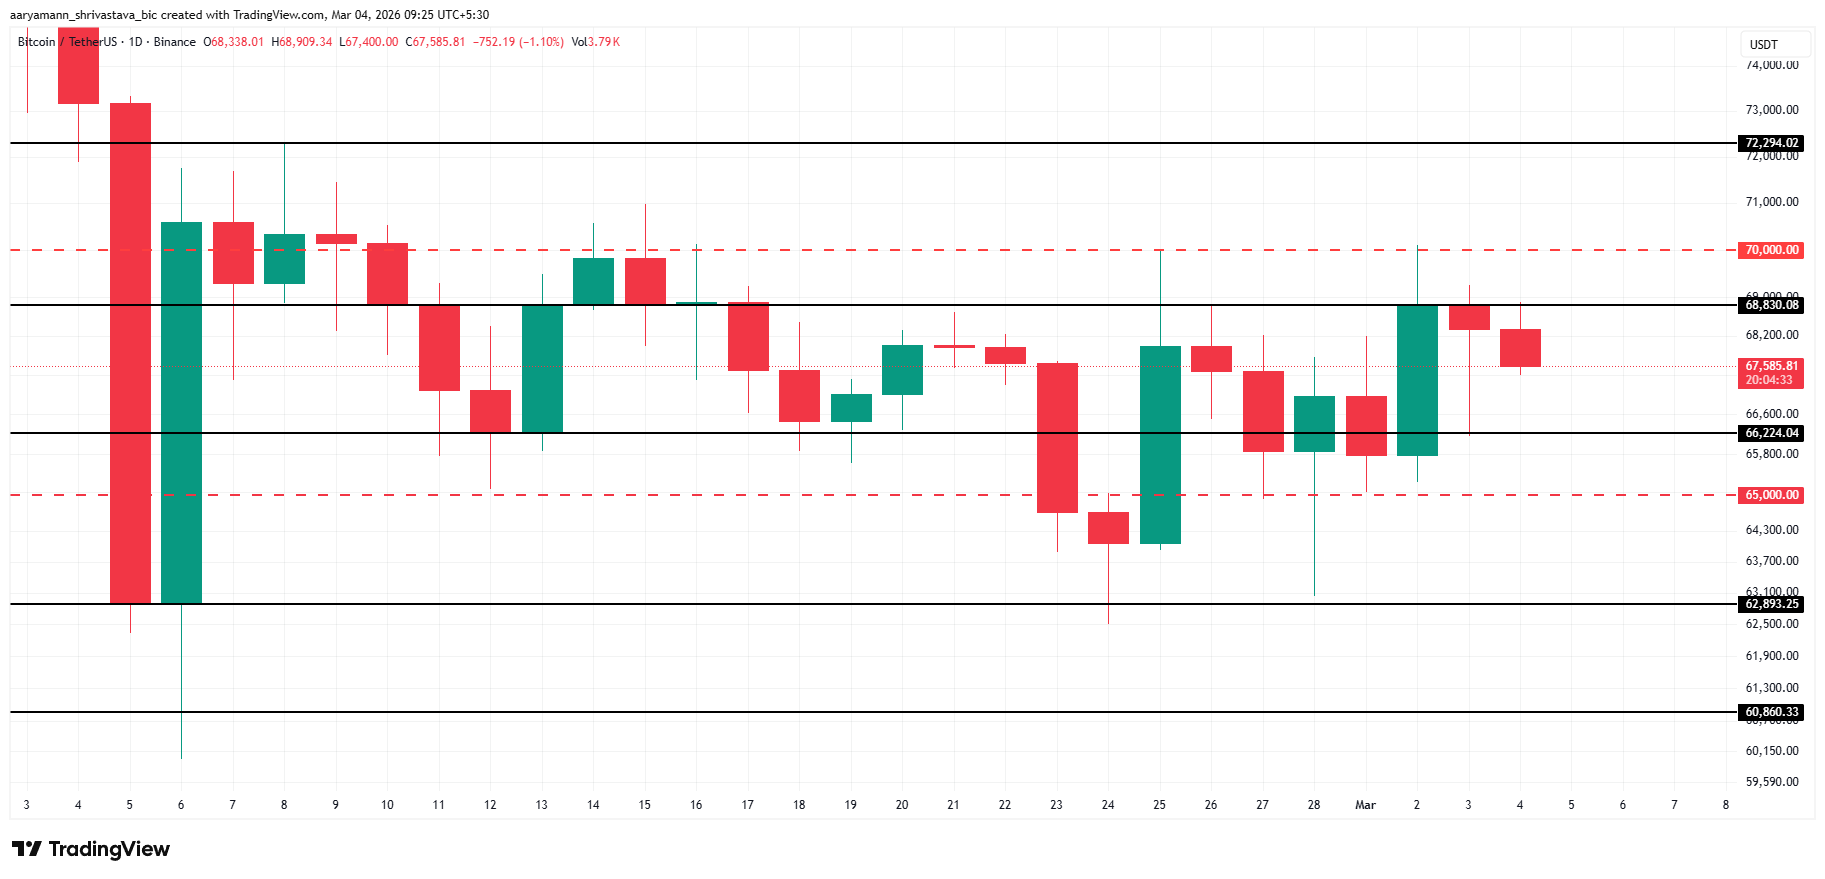 Bitcoin Price Analysis. Source: TradingView
If Bitcoin experiences sudden demand and breaks above the $70,000 barrier, it could see a rise to $72,294. This would invalidate the bearish outlook and signal that BTC is ready for an upward move, potentially signaling a new bullish trend in the market.
Pippin Is Validating The Crash Projection
PIPPIN recently broke down from a double top pattern, signaling a potential 44% crash toward $0.30. BeInCrypto had predicted this outcome earlier this week, and current market conditions have validated the bearish move. The downward momentum appears likely to continue unless a significant reversal occurs.
Currently trading at $0.35, PIPPIN has dropped 35% over the last 24 hours. The token is trading below the $0.38 resistance level. If the price continues to fall, it will likely reach the projected $0.30 level, confirming the bearish pattern and marking a 4-week low for the meme coin.
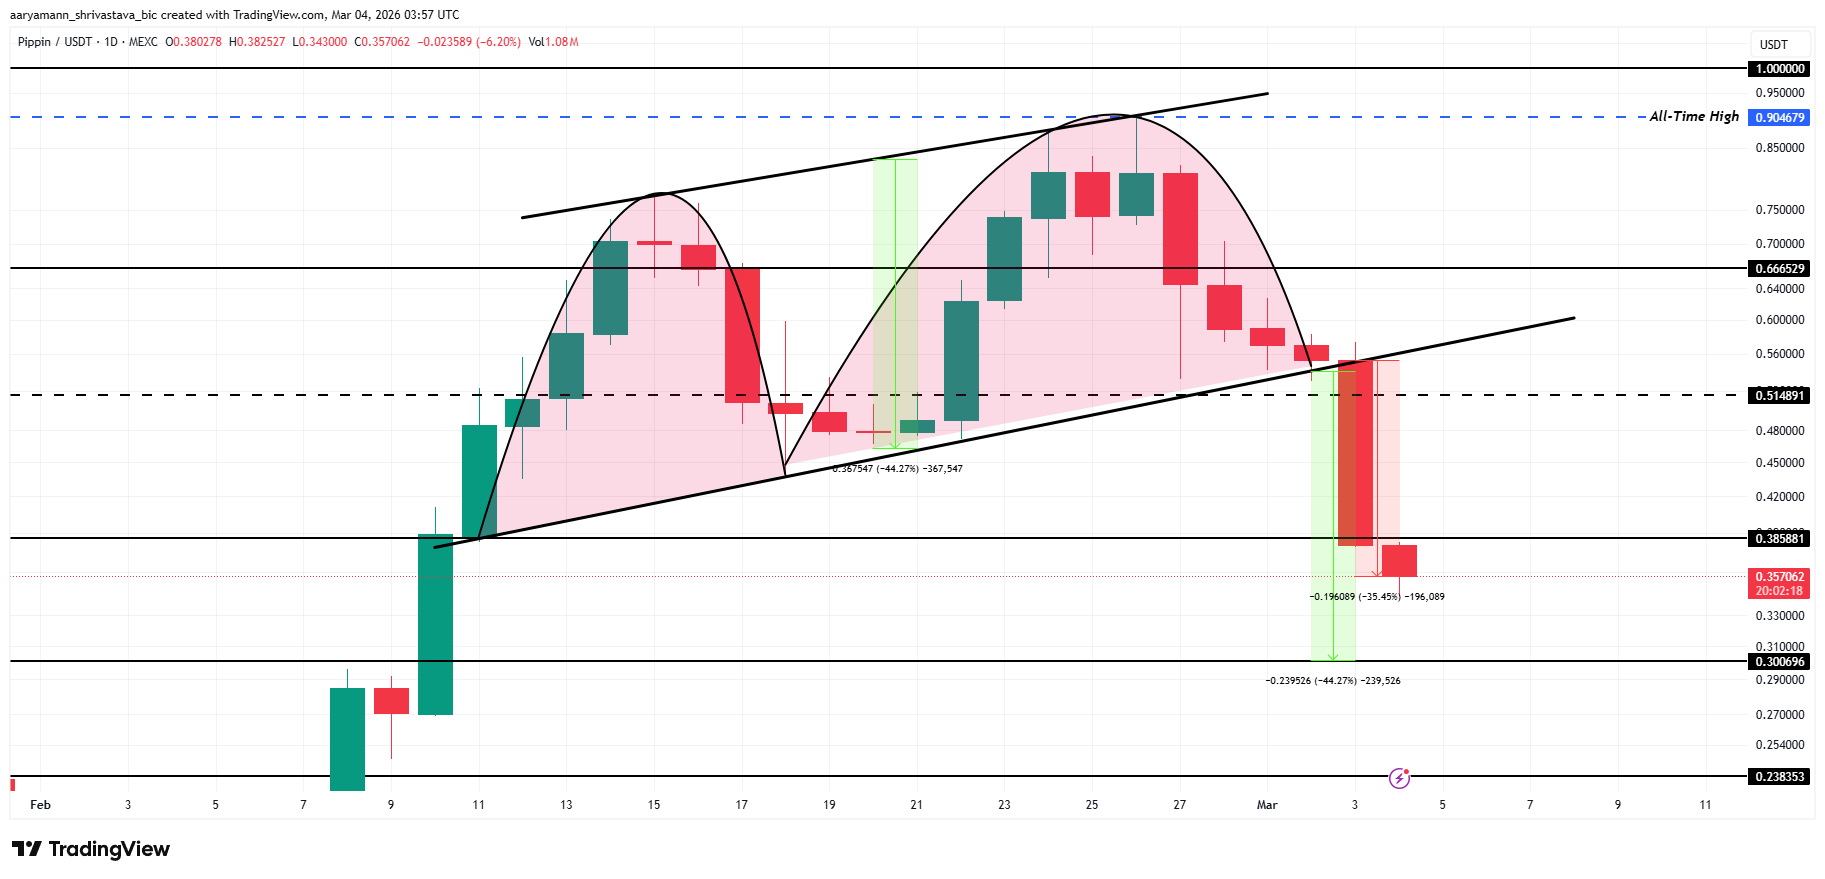 PIPPIN Price Analysis. Source: TradingView
If PIPPIN finds buying support at its current low, it could recover above the $0.38 resistance. Flipping this level into support would open the door for a rise to $0.51, which would invalidate the bearish outlook and suggest a possible recovery in the meme coin’s price.
0
0


 Manage all your crypto, NFT and DeFi from one place
Securely connect the portfolio you’re using to start.


