
Arrow Finance Price Prediction: Is This ARROW Rally Getting Started?

0
0

Everyone in the small cap corner of crypto Twitter is asking the same question this week.
Why Is Everyone Suddenly Talking About This Robinhood Chain Token
Arrow Finance price prediction searches have spiked this week, and there's a reason for that. A new lending protocol just landed on a chain most traders barely knew a month ago.
Some are calling it the next big thing on Robinhood Chain. Others are quietly warning about wallet concentration.
Turns out both camps have a point, right as the broader crypto market rally conversation stays loud. What's actually driving this move?
Arrow Finance Right Now: What The Numbers Actually Show
| Metric | Value |
|---|---|
| Coin Name | Arrow Finance |
| Ticker Symbol | ARROW |
| Blockchain | Robinhood Chain (ERC-20) |
| Today High | $1.778 |
| Today Low | $1.507 |
| RSI Level | 55.92 |
| Token Type | Governance and Utility |
| Token Category | DeFi Lending |
| Market Cap | $15.59M |
| 24H Trading Volume | $2.79M |
| 24H Trading Volume Change | +5.69% |
| Circulating Supply | 9M ARROW |
| 24H Change | +39.12% |
Source: Data by CoinMarketCap
What Exactly Is Arrow Finance And Why It Exists
Arrow Finance is a lending protocol on Robinhood Chain that lets people borrow against tokenized stocks, ETFs, and stablecoins without selling them.
It runs on the ERC-20 standard and uses veARROW for governance, meaning locked tokens get a say in the protocol's direction.
Why This Robinhood Chain Project Is Getting Real Attention
The protocol runs 24 live markets covering WETH, USDG, and two tiers of tokenized equities, including AAPL, TSLA, NVDA, COIN, and Tier 2 names like SPCX, whose own SpaceX price prediction made headlines for very different reasons this month.
Sherlock's Blackthorn researchers have started auditing the Arrow CDP system, and that backing matters for a project this new.
Arrow CDP Mainnet News And What Traders Are Reacting To
Arrow Finance confirmed its CDP Alpha is coming to mainnet soon, built as a proof of technology for borrowing against real-world assets on-chain.
The team says conservative caps apply during Alpha, and losses from any protocol issue get reimbursed.
Bubblemaps flagged something worth knowing: roughly 80% of $ARROW supply sits in wallets funded by the same source, tracing to 200 wallets from one origin.
MEXC opened $ARROW futures on July 10 with up to 20x leverage, and CoinW followed with a spot listing on July 13 alongside a 30,000 USDT bounty, part of a wider wave of new exchange listings chasing Robinhood Chain volume.
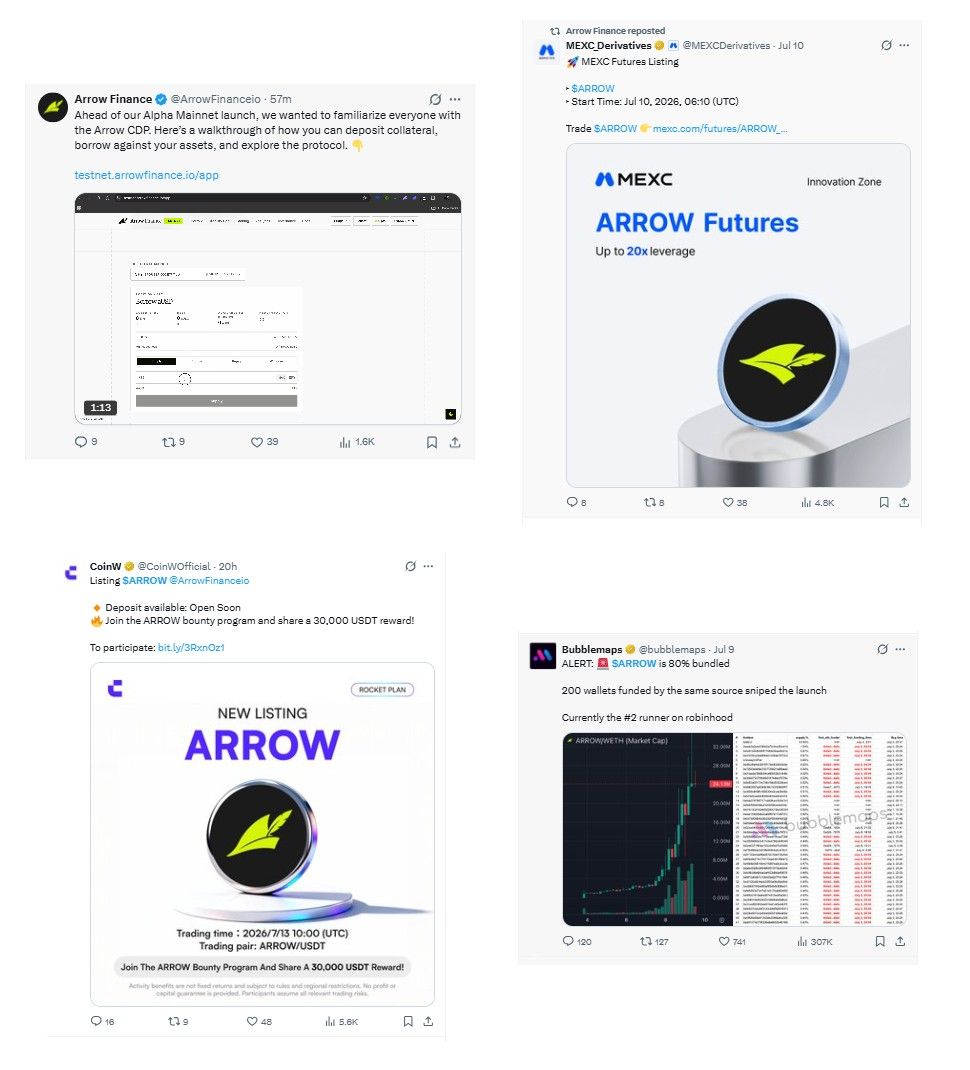
Source: Posted on X by Arrow Finance, Bubblemaps, MEXC Derivatives
ARROW Technical Analysis: What the Chart Is Quietly Telling Traders
Price has been grinding inside a descending channel on the 4-hour timeframe, but it's currently sitting above the channel midline near $1.687.
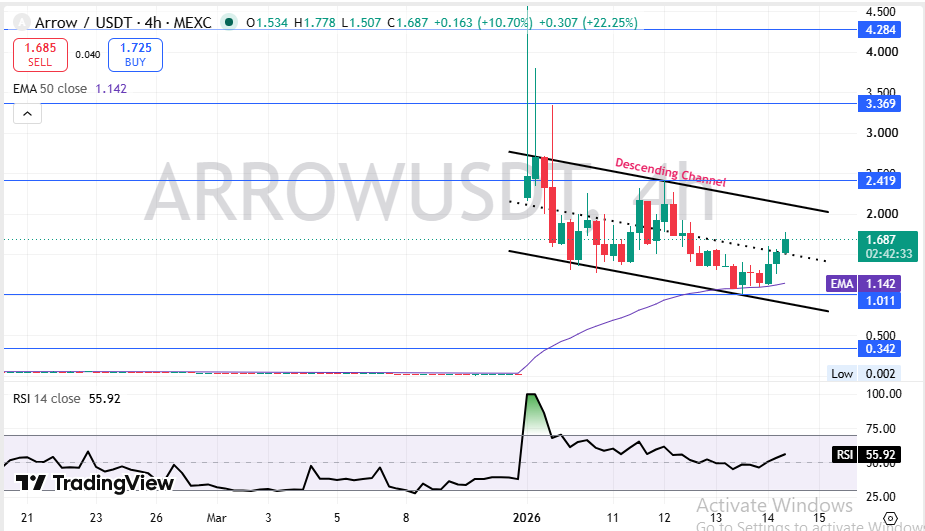
Source: Charting by TradingView
That positioning above the midline, paired with price above the 50 EMA at $1.142, tells us buyers are still in control for now.
RSI at 55.92 sits in neutral to mildly bullish territory. Not overbought, not oversold.
When we pulled up the chart, the first thing that stood out was how tight recent candles have gotten near resistance, a sign of coiling before a bigger move.
Where Could ARROW's Price Go In The Next Few Weeks
In the short term, $ARROW needs to clear the upper channel trendline before this counts as a confirmed breakout.
| Timeframe | Bearish Target | Base Target | Bullish Target | Key Trigger |
|---|---|---|---|---|
| 24 Hours | $1.45 | $1.69 | $1.95 | Reaction at channel resistance |
| 3–7 Days | $1.20 | $1.85 | $2.42 | Weekly close above the channel midline |
| 2–4 Weeks | $1.01 | $2.10 | $3.37 | CDP Alpha launch follow through |
Watch the channel top closely, alongside how the broader Ethereum price outlook shapes risk appetite for smaller Robinhood Chain names.
Is $ARROW Built To Last Beyond This First Pump
Longer term, this depends on whether the CDP product attracts real borrowing volume once live, and confirmed dates on the crypto events calendar could matter more than the chart.
| Timeframe | Bearish Target | Base Target | Bullish Target | Catalyst Needed |
|---|---|---|---|---|
| 3 Months | $0.85 | $2.20 | $3.80 | Successful audited mainnet launch |
| 6 Months | $0.60 | $2.90 | $5.50 | Meaningful TVL growth on RWA markets |
| End of Year | $0.50 | $3.40 | $7.20 | Multiple exchange listings sustained |
| 2027 Outlook | $0.40 | $4.10 | $9.00 | Robinhood Chain adoption expands |
Fair take: the long-term case is speculative right now; this is still an early-stage protocol with unproven revenue.
Three Ways This ARROW Story Could Actually Play Out
Worst Case: coordinated sell-off tied to wallet concentration. Channel breaks lower, support at $1.011 fails.
Base Case: Price consolidates inside the channel while CDP Alpha rolls out slowly. Traders wait for usage data before committing.
Best Case: CDP Alpha launches cleanly, the audit clears, and borrowing volume ramps up. Channel resistance breaks with strong follow-through.
| Scenario | Price Range | What Triggers It |
|---|---|---|
| Worst Case | $0.34 – $1.01 | Whale dump and invalidation of the breakout structure |
| Base Case | $1.50 – $2.40 | Sideways price action with gradual CDP adoption |
| Best Case | $3.00 – $4.28 | Strong CDP demand supported by new exchange listings |
The Exact Price Levels Every ARROW Holder Should Watch
Resistance zone: $2.419 first, then $3.369, marked by prior consolidation.
Support zone: $1.011 acts as the first real floor.
Invalidation zone: a close below $0.342 breaks the bullish structure entirely.
Analyst View And Final Thoughts On The ARROW Setup
The current chart setup favors buyers, but only barely. A price above both the channel midline and the 50 EMA keeps the bias tilted bullish.
RSI at 55.92 gives room to run before anything looks stretched. Decent sign for continuation, not a guarantee.
One thing to track beyond the chart: how the Sherlock audit results land once published, since that could shift sentiment fast either way.
The most important level right now is $1.011. Lose it and the bullish case weakens fast, so watch the crypto fear and greed index alongside RSI too.
The chart says buyers; on-chain data says caution.
Disclaimer: This article is for educational purposes only and does not constitute financial advice. Crypto markets are volatile. Consult your investment advisor before making any investment decision.
0
0
 Manage all your crypto, NFT and DeFi from one place
Securely connect the portfolio you’re using to start.