Has Hyperliquid Price Entered A Downtrend: Technical Analysis Reveals

0
0

Another hard week hit the crypto markets. Hyperliquid price formed a new low, and it begs the question “How much more?”. Are investors scared and confident still? What is liquidity telling us about the current state of the market? Lots and lots of questions to ask. One place to look for answers is the charts.
After all, @HyperliquidX is still firmly holding the crown as the undisputed #1 perpetuals DEX.
As of late November 2025, it's clocking $8 billion in daily perp volume and over $6.5 billion in open interest, outpacing most rivals in raw liquidity and user adoption. pic.twitter.com/kGb4P2blfJ
— Hyperliquid Daily (@HYPERDailyTK) November 25, 2025
As fundamentals remain strong, as well as usage,
Price
/24h
Volume in 24h
Price 7d
 is bringing in lots of daily revenue. With Hyperliquid Strategies behind its back and the aspiration to raise $1B for HYPE token purchases, there seems to be enough bullish data for investors. So why is price dropping?
Hyperliquid Price Rolling Downhill: Trend And Key Levels
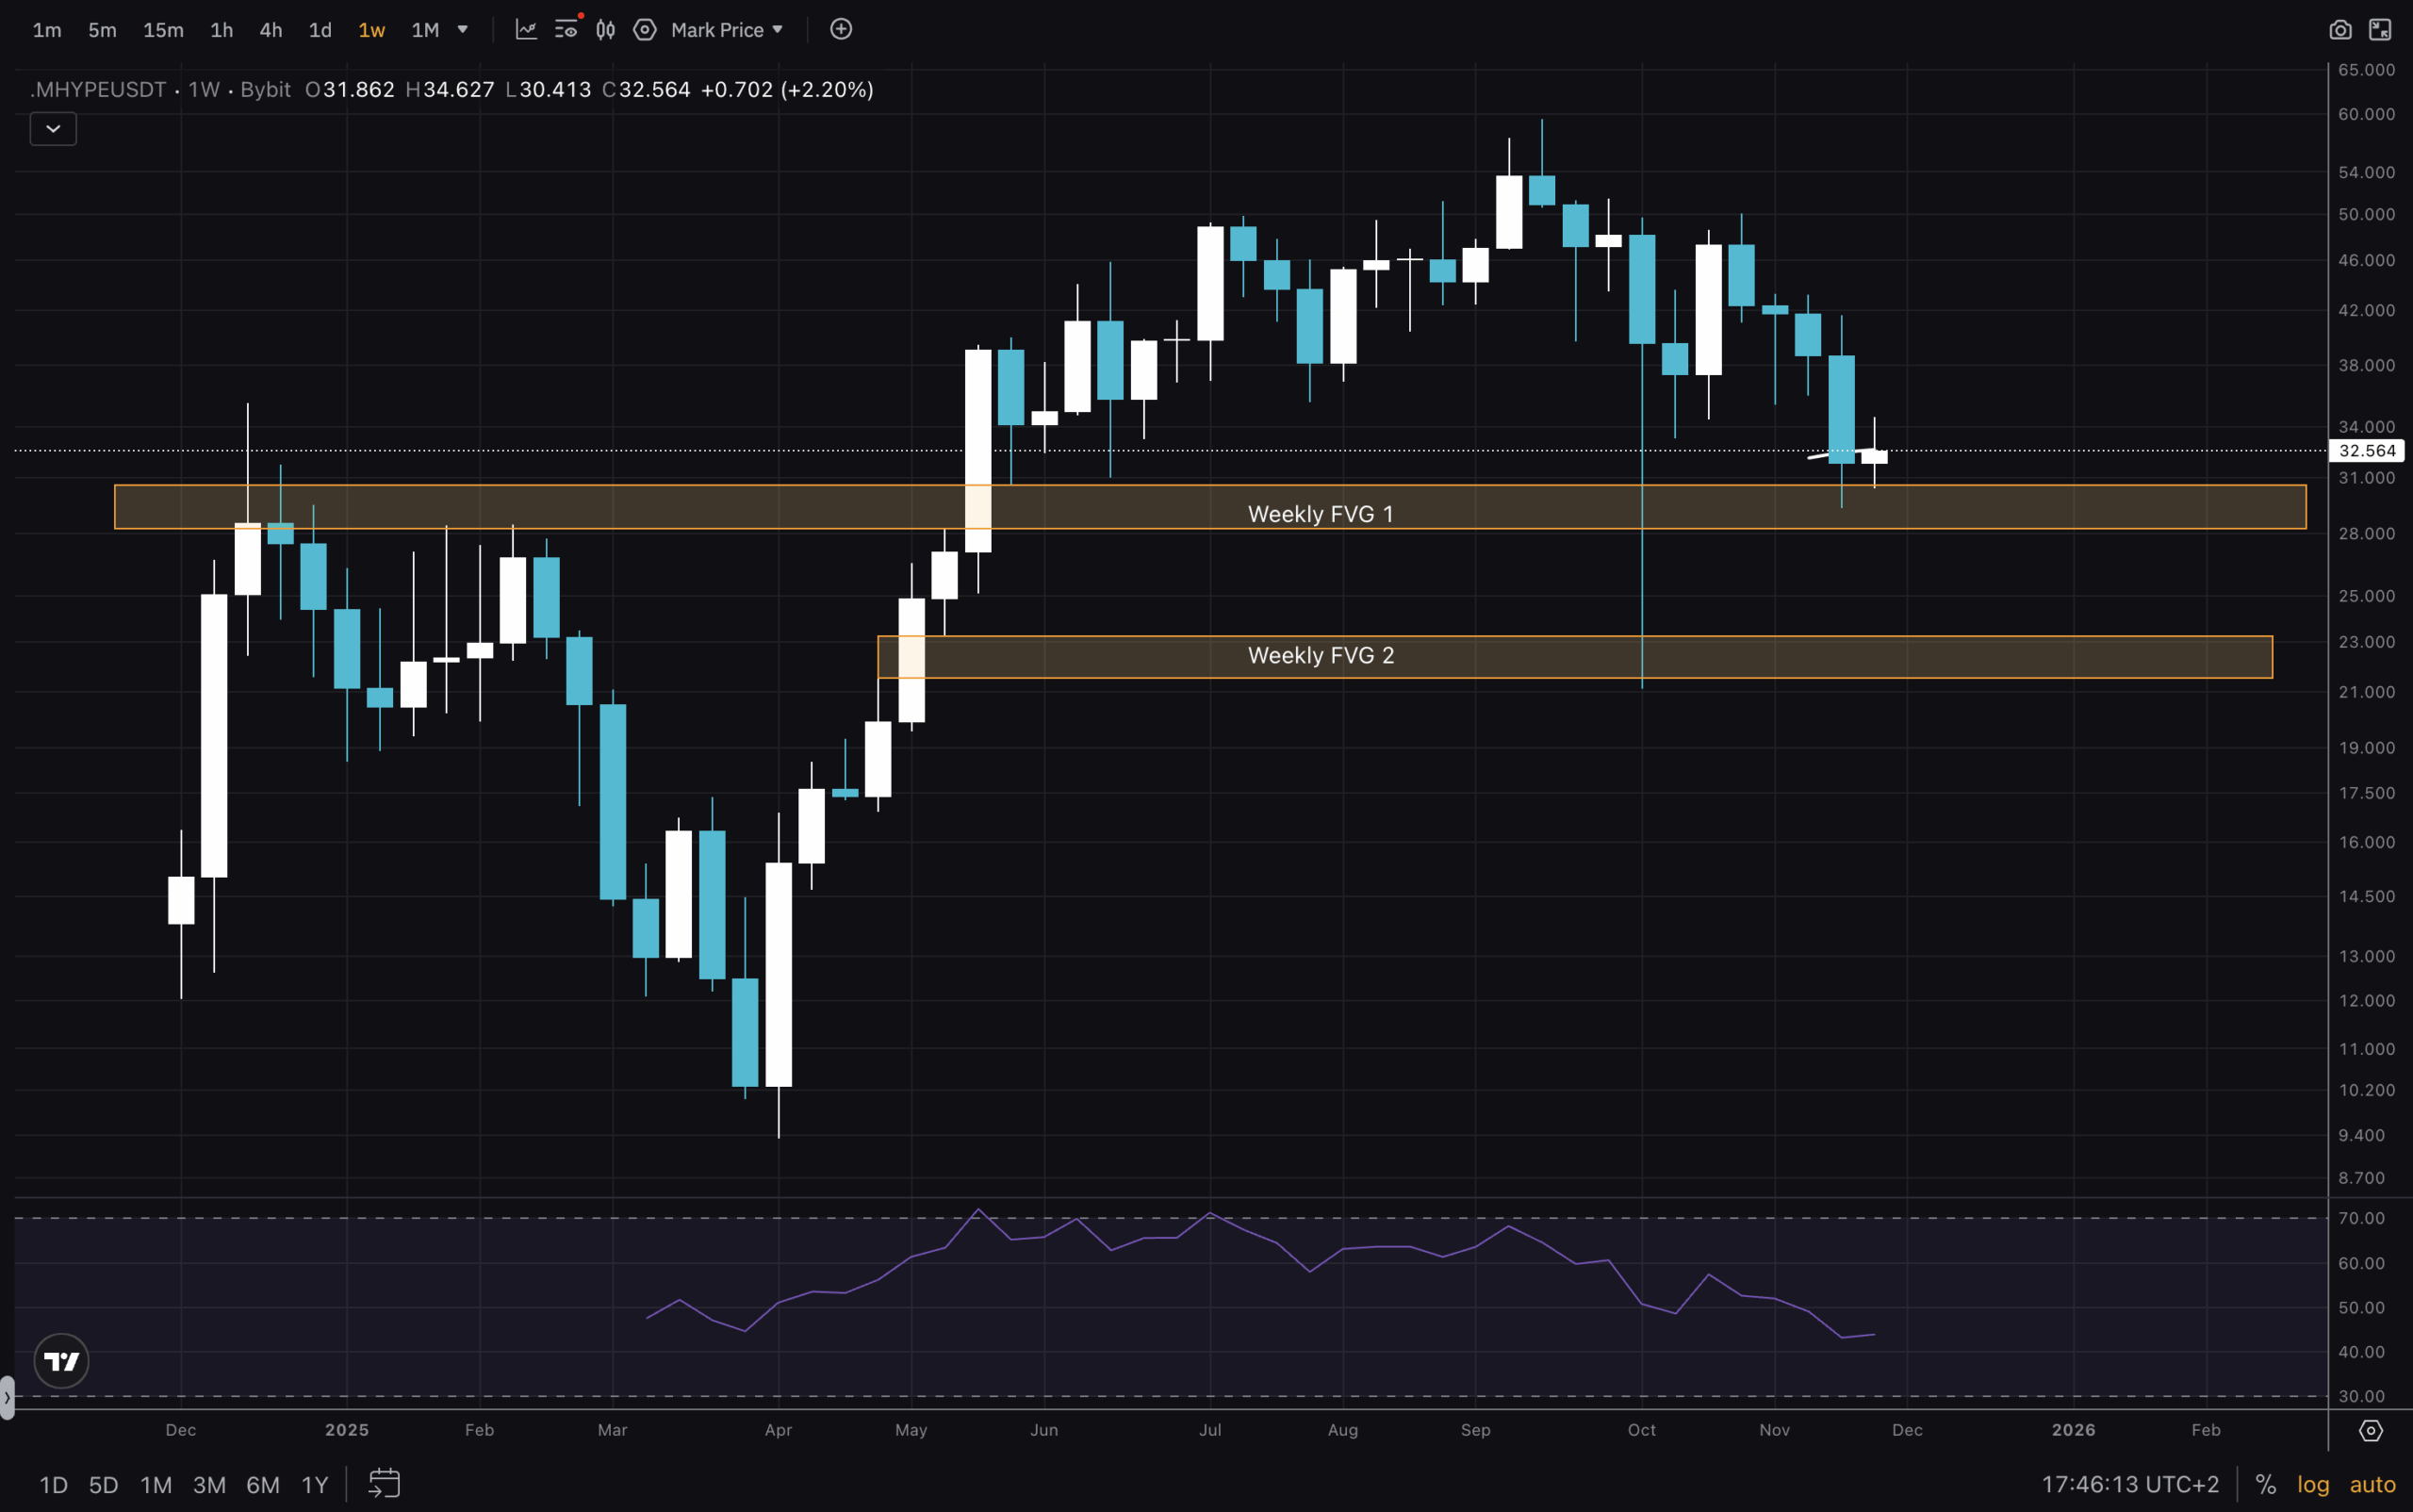
(Source – Tradingview, HYPEUSD)
Starting today’s HYPE USD analysis, we first glance at the 1W chart. It shows us two Weekly FVGs, one of which is being tested and filled now. This is our first support zone – between $28-$30. The bottom FVG is roughly between $21-$23, and it could be an important level for the future. No moving averages here to observe, but RSI has been steadily dropping and is currently around midrange.
DISCOVER: The 12+ Hottest Crypto Presales to Buy Right Now
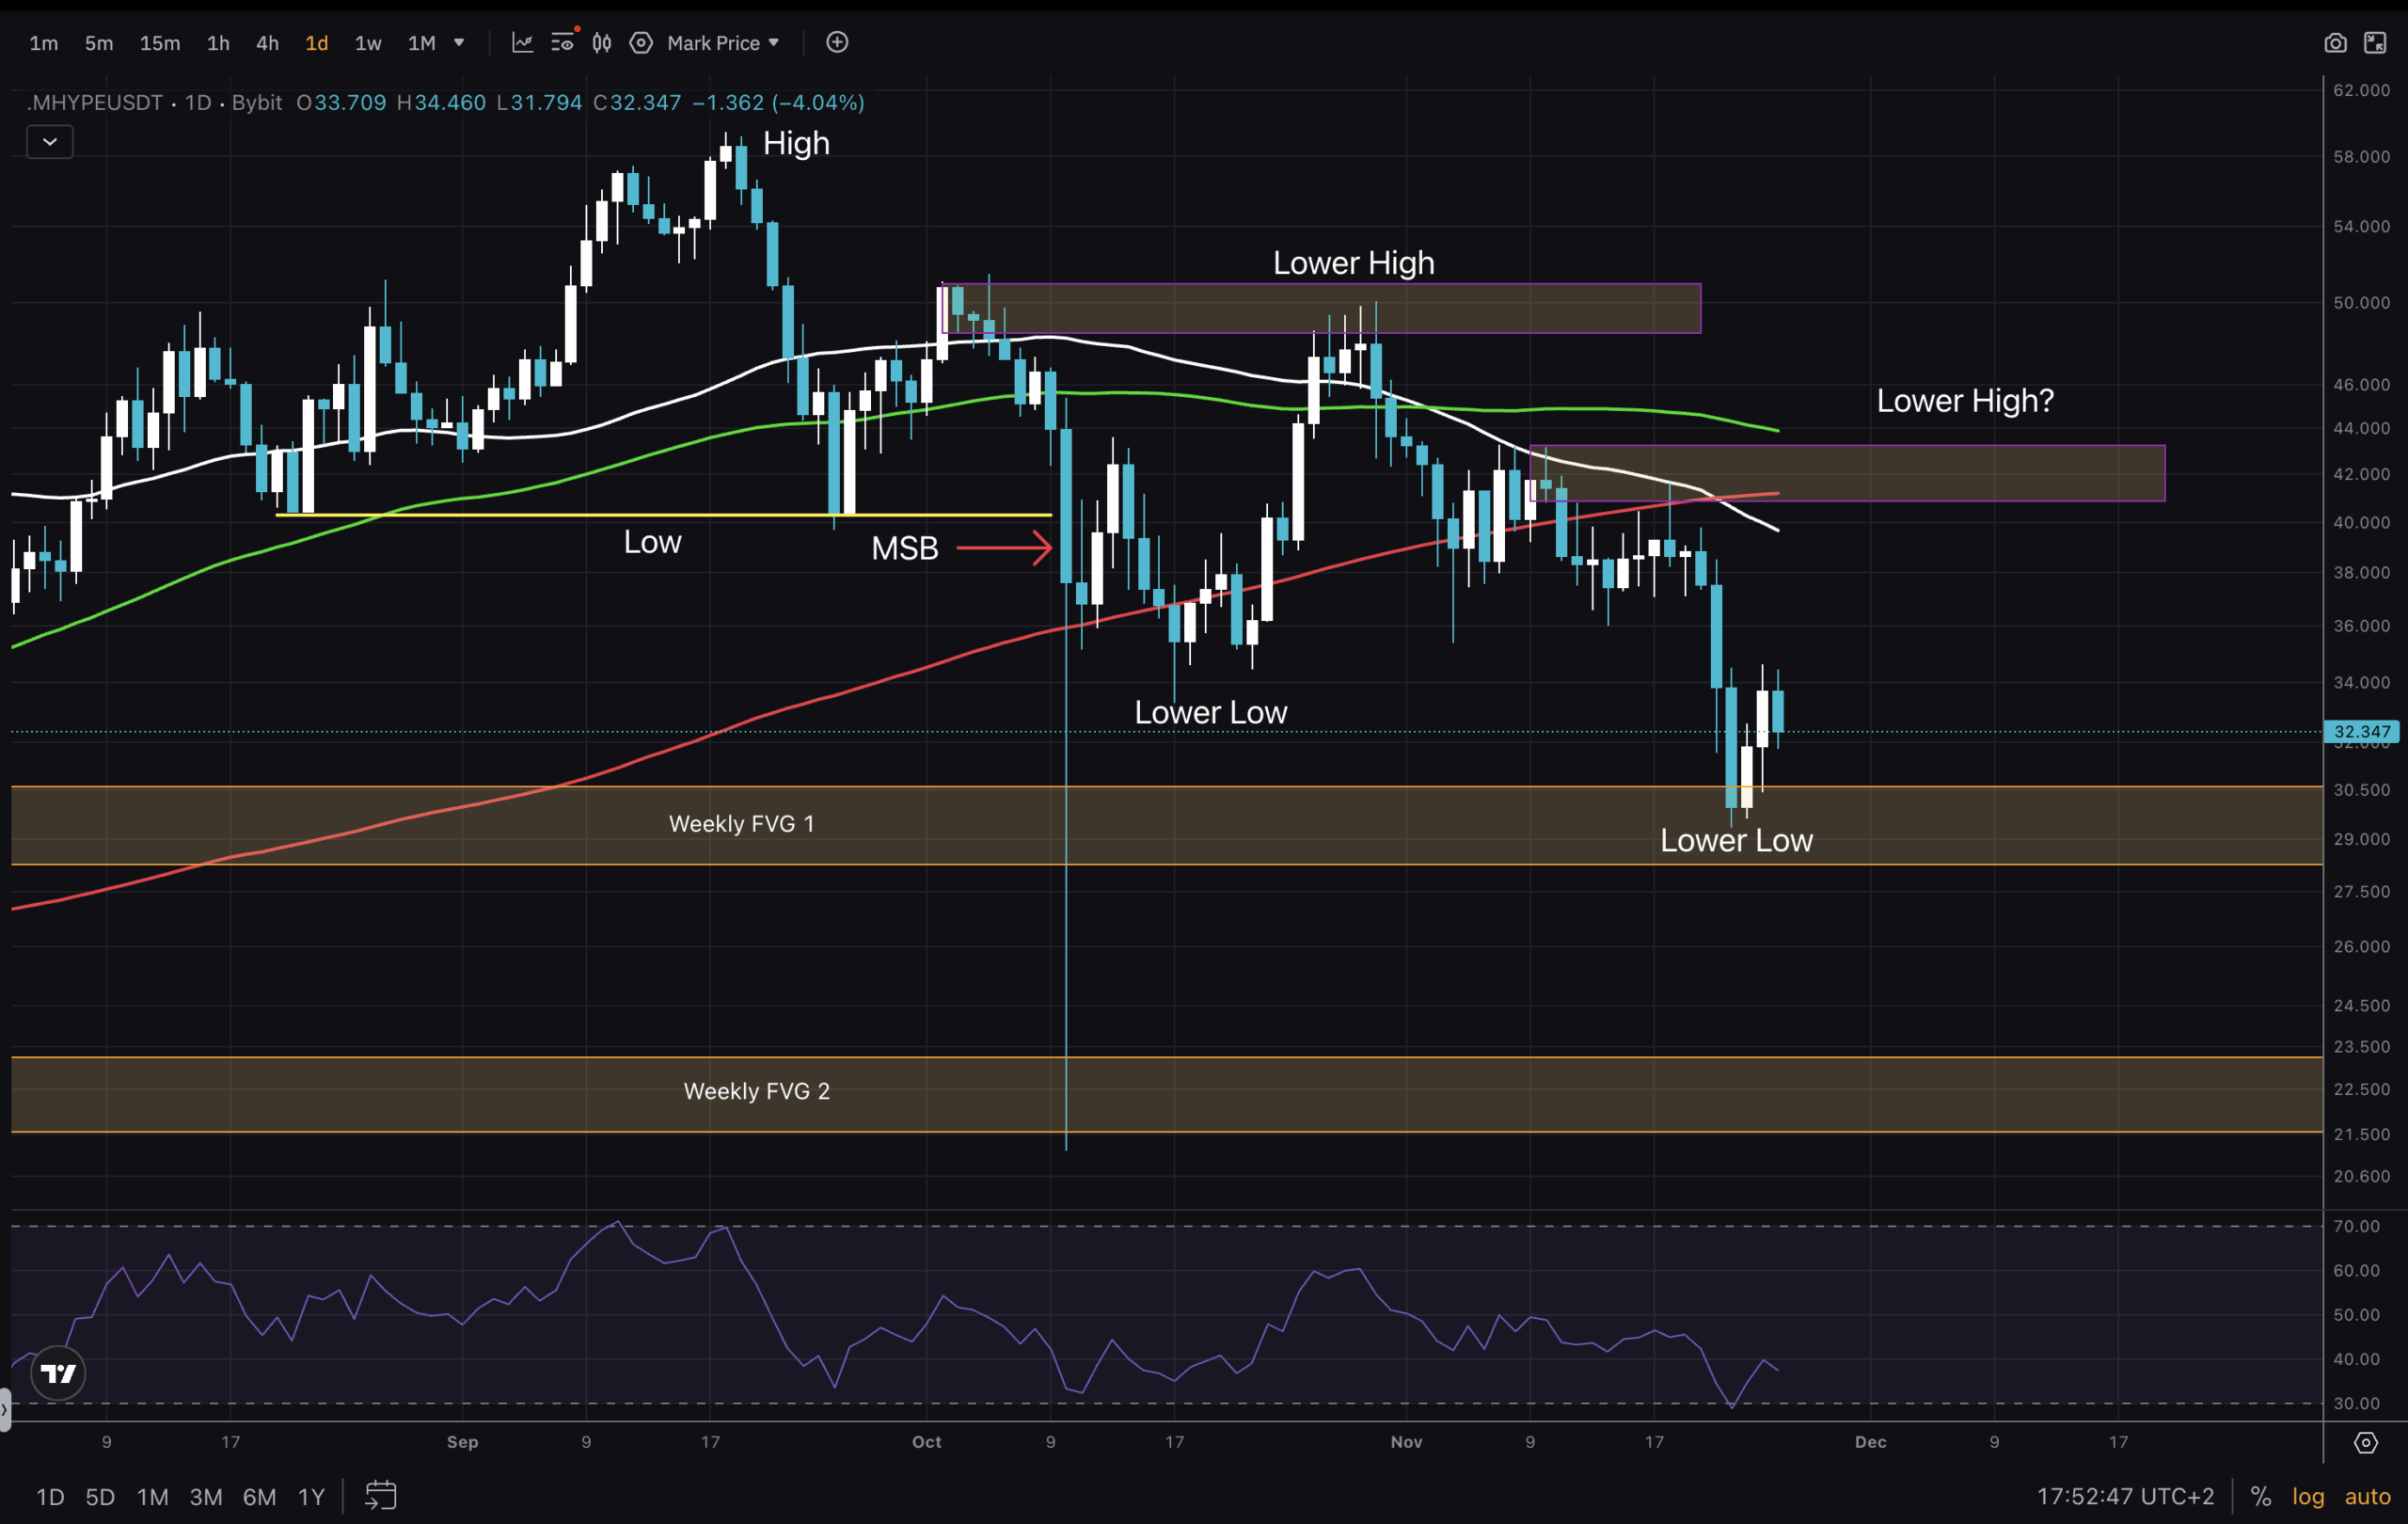
(Source – Tradingview, HYPEUSD)
Next in line is the 1D chart. As we zoom in, we can see when the downtrend started. First price broke beneath the low, causing an MSB. Afterwards, the Lower High was formed as the price got rejected from the bearish orderblock. A further move down sent us below all Moving Averages – yuck! And now the question is, will we see a typical move up to retest the underside of the MAs and the next bearish orderblock to form another Lower High? RSI is at the bottom of its range here.
DISCOVER: Best New Cryptocurrencies to Invest in 2025
HYPE USD Low Timeframe Analysis And Concluding Thoughts
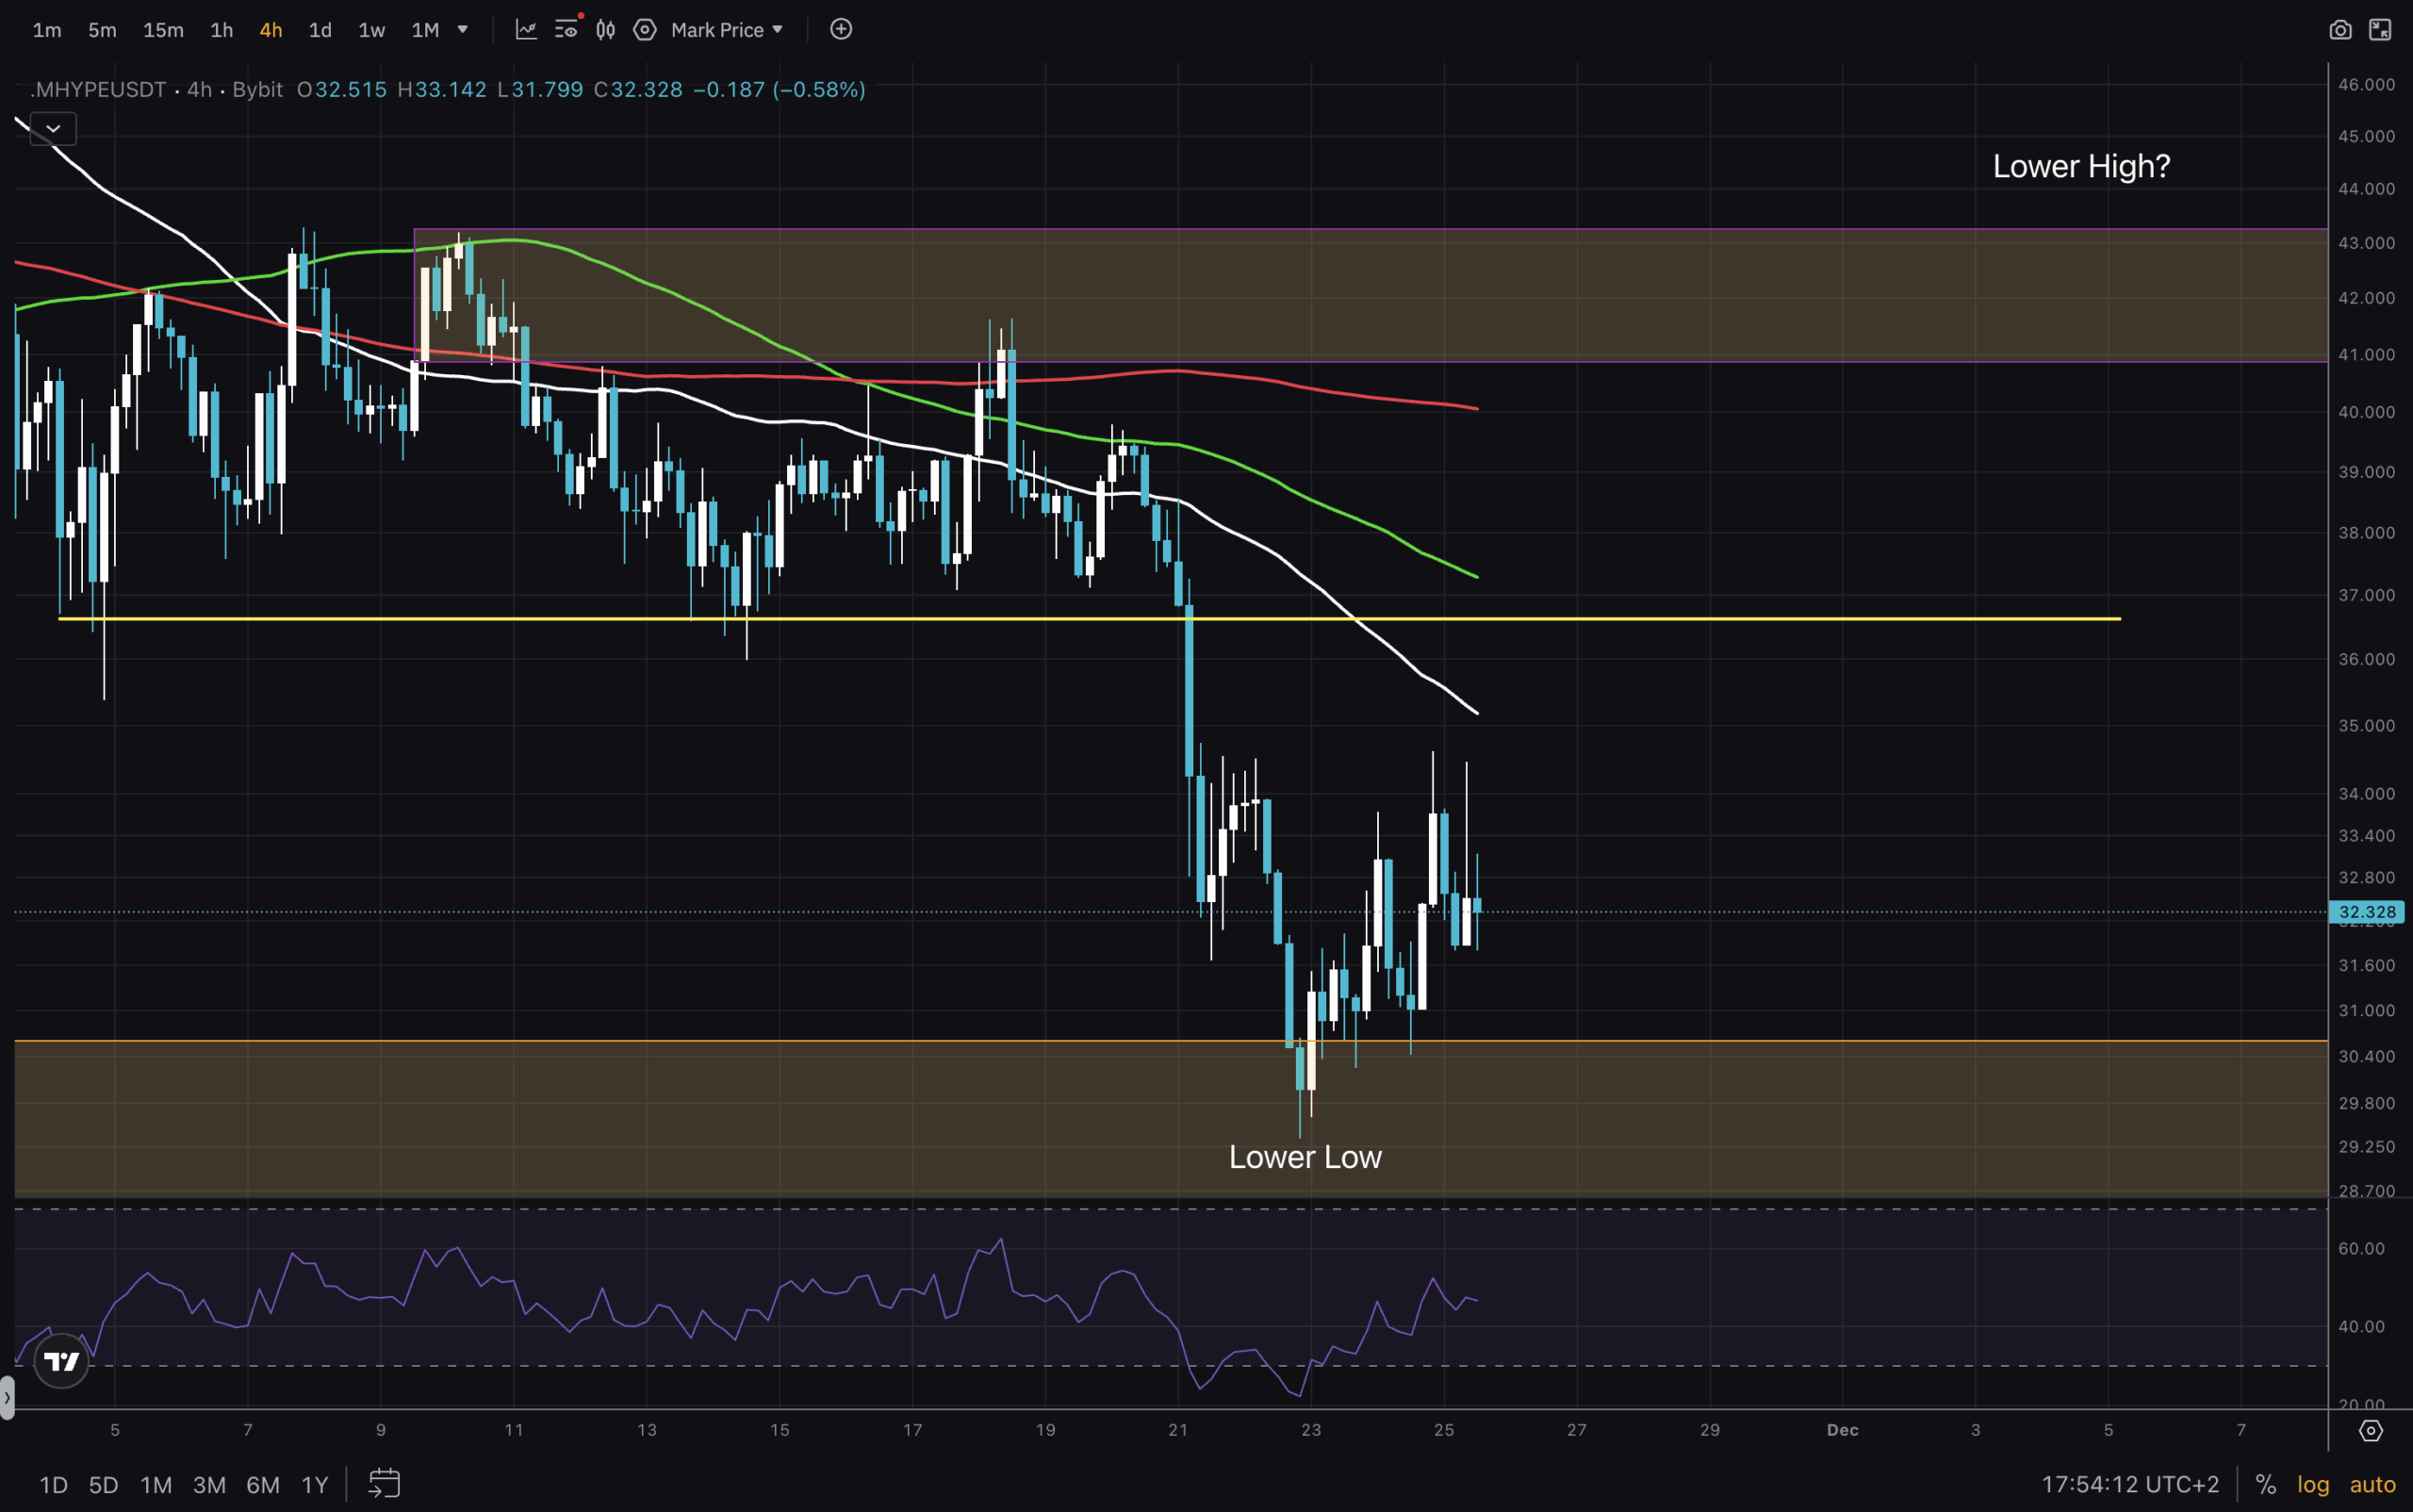
(Source – Tradingview, HYPEUSD)
Finally, we enter the low timeframes, and in our case, we will stare at the 4H chart, hoping to gain some extra insight. Or potential trade ideas. Our key levels here are visible, and they provide us with a possible range. The previous low in yellow is also a potential resistance, but it can be broken for the purpose of testing the bearish orderblock. Nevertheless, a long entry here, with a stop below the Lower Low and Take Profit in the purple zone, is a 1:3 RR trade. RSI is low, allowing a potential push up.
For us to enter into bullish trend again, there is a lot of work for bulls to do. To put it in numbers, we need to break above $45 and reclaim it as support. Until then, we are enjoying the roller coaster downhill. Stay safe out there!
DISCOVER: 20+ Next Crypto to Explode in 2025
Join The 99Bitcoins News Discord Here For The Latest Market Update
Has Hyperliquid Price Entered A Downtrend: Technical Analysis Reveals
- RSI on 1D and 1W are low enough, but signs of new strength are needed.
- HYPE USD needs to reclaim $45 for a new uptrend to begin.
- Low timeframe potentially tradeable range between $30 and $40.
The post Has Hyperliquid Price Entered A Downtrend: Technical Analysis Reveals appeared first on 99Bitcoins.
0
0


 Manage all your crypto, NFT and DeFi from one place
Securely connect the portfolio you’re using to start.


