
Bitcoin ETF Demand Is Back — Now the Market Faces Its Next Test

0
0


Bitcoin ETF demand is back, and the numbers confirm it wasn’t a one-week fluke.
US spot Bitcoin ETFs pulled in $3.8 billion over the past three weeks, their strongest stretch of 2026, according to SoSoValue’s tracking data.
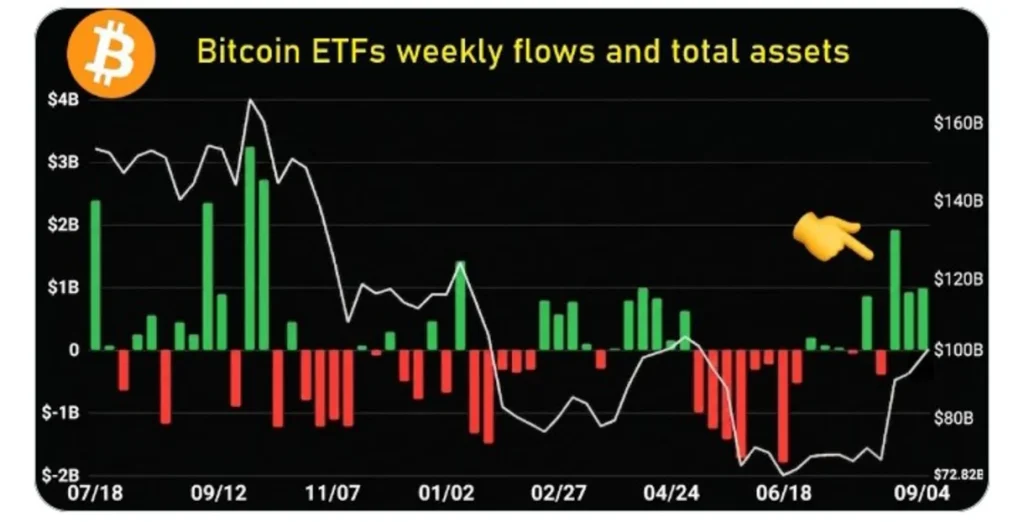
The week ending September 5 alone added $986.9 million, up roughly 7% from the week before.
The Numbers Behind the Rebound
Total net assets across the funds reached $101.3 billion on Friday, after briefly touching $103.3 billion the day before.
Cumulative net inflows since launch now stand at $55.6 billion. Friday itself brought in $174.6 million, a sharp step down from Thursday’s $730.8 million.
BlackRock’s IBIT led that Friday total, pulling in $117.4 million, roughly 67% of the day’s inflows, according to Farside Investors’ daily ETF tracker. Fidelity’s FBTC added another $57.2 million.
Why This Rebound Still Isn’t Complete
Year-to-date flows remain negative by roughly $1 billion, despite this three-week surge.
Techgaged tracked the depth of that earlier damage back in May, when spot Bitcoin ETFs logged their darkest week yet, with $1.72 billion leaving the funds in a single stretch.
This month’s rebound has clawed back real ground, but it hasn’t fully erased that earlier hole.
Other Crypto ETFs Are Cooling Fast
Bitcoin isn’t pulling the whole market with it. Spot Ethereum ETFs saw weekly inflows drop 74% to $218.4 million. XRP ETFs fell even harder, down 83% to just $19 million.
That divergence suggests institutional capital is concentrating specifically in Bitcoin right now rather than rotating broadly across crypto ETF products.
Bitcoin’s Price Outlook
Bitcoin traded at $79,837.00 on September 6, 2026 8:30 (UTC), up 2.2% over seven days.
The chart shows real volatility behind that number. Price chopped between $77,000 and $79,000 through most of the week.
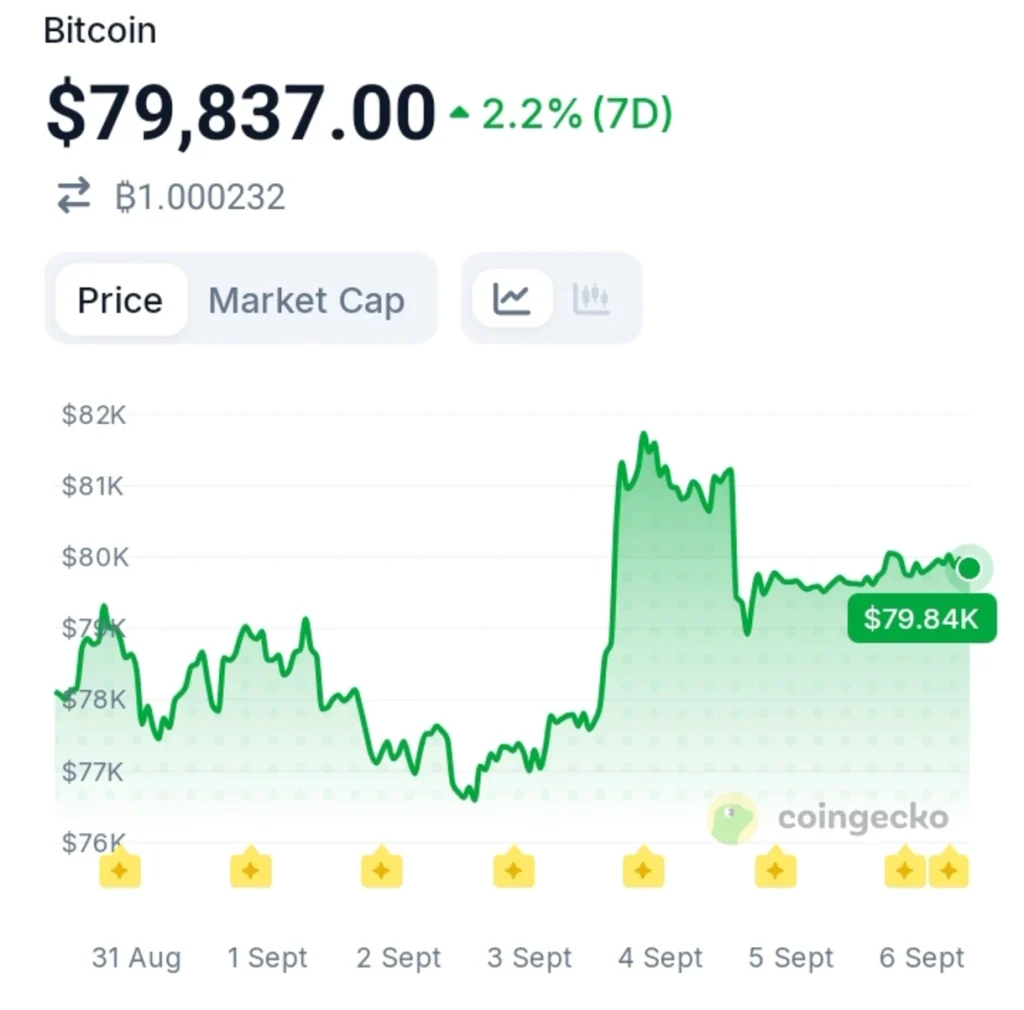
It spiked sharply to $81,500 around September 4, then pulled back to settle near $79.84K.
Techgaged tracked a very different setup for Bitcoin earlier this year, when the token cracked below $70,000 in early June as ETF outflows piled up across the sector.
The Next Test
Three strong weeks don’t erase a full year of net outflows on their own, and that gap is exactly what determines whether this rebound holds.
If IBIT and FBTC keep concentrating the bulk of new demand while Bitcoin holds above $79,000, the year-to-date deficit likely closes within a matter of weeks.
A drop back below that level would probably stall inflows fast, given how closely this month’s buying has tracked Bitcoin’s own price recovery rather than running ahead of it.<
Disclaimer:
This article is for informational purposes only and does not constitute financial, investment, or trading advice. The views expressed are based on publicly available data, market observations, and the author’s interpretation at the time of writing. Cryptocurrency markets are highly volatile and unpredictable, and past performance or current technical setups do not guarantee future results. Readers should conduct their own research and consult with a qualified financial advisor before making any investment decisions. TechGaged does not accept liability for any losses incurred based on the information presented.
The post Bitcoin ETF Demand Is Back — Now the Market Faces Its Next Test appeared first on TechGaged.com.
0
0

 Manage all your crypto, NFT and DeFi from one place
Securely connect the portfolio you’re using to start.


