
SUI Price Prediction: Is $1 SUI Like Buying Bitcoin at $10? Here’s Why

0
0

Sui Network says it just crossed 6 billion total transaction blocks, while one account is calling for $50 by the year-end of 2026.
This SUI Price Prediction checks both claims against the chart, starting with whether $1.0957 holds as support.
SUI News: Sui Network Crosses 6 Billion Transaction Blocks
A social media post said SUI just crossed 6 billion total transaction blocks, calling it another major usage milestone and a strong sign activity keeps scaling on the network.
The post framed this as evidence of real demand behind the ecosystem, separate from price action.
CoinGabbar could not independently verify the exact figure, as no block explorer link was included with the post, though transaction counts of this kind are generally the sort of on-chain metric that can be checked directly on Sui's network explorers.
SUI News Today: A Trader Calls for SUI at $50 by Year-End
A separate post compared buying SUI at $1 to buying Bitcoin at $10 and said the account is sending SUI to $50 before the end of 2026, describing it as "hard-coded."
No data, chart, or reasoning was given for the $50 figure. For context, the highest level actually marked on the chart below is $2.0069, far below $50.
This is a personal opinion, not analysis, and CoinGabbar could not verify any basis for the claim.
SUI Price Today: Technical Analysis
The chart shows a wide rounding bottom stretching from April through September, similar to the pattern seen on this chart before.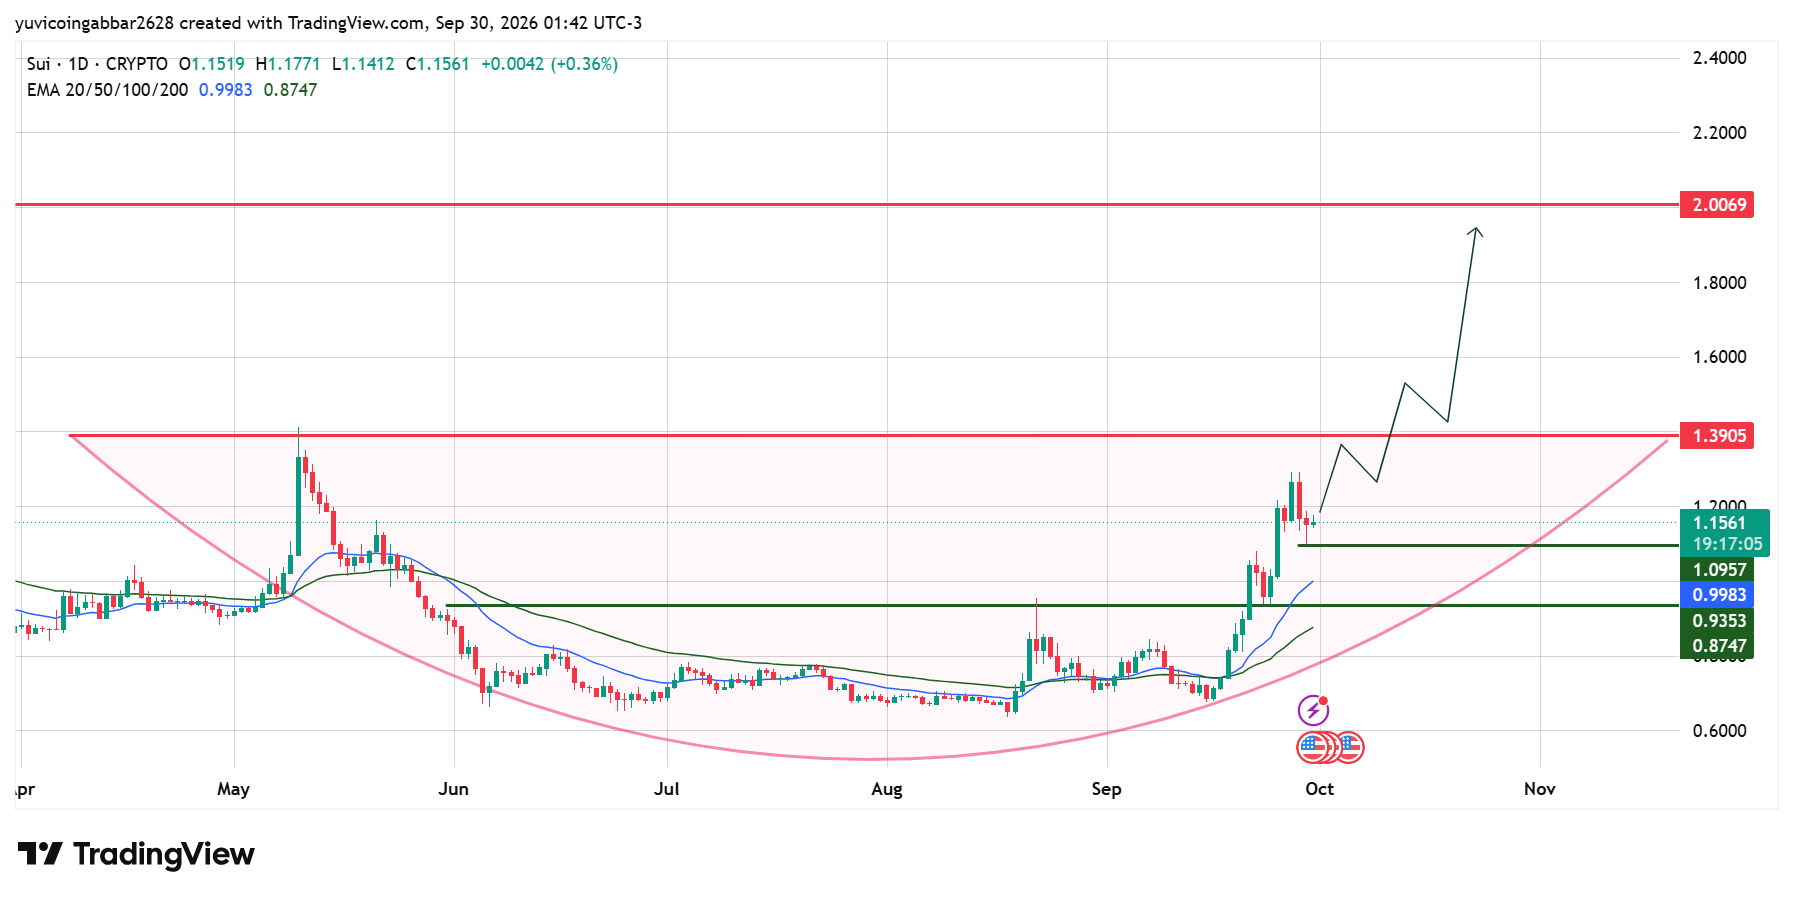
Price fell from around $1.35 in May to a low near $0.60 through July and August, then climbed back through September in a slow curve before accelerating sharply in the last two weeks.
Today's candle is a small gain, the Sui Price today is up 3% to $1.1561, holding just above the $1.0957 level, a recent swing low.
Both EMAs sit well below price, with the 20 EMA at $0.9983 and the 50 EMA at $0.8747, confirming the breakout from the rounding bottom is still intact.
SUI Outlook Levels
Level Type | Price |
Resistance 2 | $2.0069 |
Resistance 1 (rounding bottom rim) | $1.3905 |
Immediate Price Reference | $1.1561 |
First Confirmed Support | $1.0957 |
Deeper Support | $0.9353 |
SUI Price Forecast
Bull case: If the price holds at $1.0957, SUI can make another run at $1.3905, the rim of the rounding bottom pattern. A close above that level would be a genuine breakout signal and open the way toward $2.0069.
Rising network usage, if the transaction figures hold up, adds a fundamental reason to expect continued demand.
Bear case: A close below $1.0957 would risk a slide back toward $0.9353 and the EMA zone. Losing the 20 EMA at $0.9983 would put the recent breakout in real doubt, regardless of usage milestones or price targets circulating online.
SUI Price Prediction: Can SUI Reach $50?
Nothing on this chart supports it. The highest level actually marked is $2.0069, and reaching even that would require SUI to first clear $1.3905, the top of the rounding bottom.
A move to $50 would be more than 40 times the current price, well beyond anything the chart or the 6 billion transaction figure points to on its own.
SUI Price Prediction 2026: Expert View
According to CoinGabbar analysts, rising transaction counts are a real, checkable usage signal, and they line up with a chart that's genuinely breaking out of a multi-month base, which makes this a more credible bullish story than most.
That's separate from claims of $50 targets with no supporting data attached. The level that actually matters here is $1.0957, not the headlines circulating around it.
Disclaimer
This piece is for informational purposes only and isn't financial advice. The levels and scenarios above are based on technical chart analysis and publicly available data at the time of writing. Crypto markets can move sharply within hours, so past patterns don't guarantee future outcomes. Do your own research and consider your risk tolerance before acting on any level discussed here.
0
0


 Manage all your crypto, NFT and DeFi from one place
Securely connect the portfolio you’re using to start.


