XLM Caught in a Downtrend—Here’s What Needs to Break for a Rebound

0
0

Stellar (XLM) price has traded flat over the past 24 hours, showing just a 0.3% move. Over the last 7 days, it slipped about 2.8%, but on a three-month view, it is still up more than 35%.
The longer uptrend leaves some hope, but one fundamental problem has capped momentum: weak DeFi activity.
DeFi Underperformance Limits XLM’s Upside
Data shows that Stellar’s total value locked (TVL) in DeFi has barely moved. On July 31, Stellar’s TVL stood at $143.35 million. By August 27, it had fallen slightly to $142.48 million.
That stagnation stands in sharp contrast with peers like Solana, BSC, and even Bitcoin-linked protocols, which all saw spurts of DeFi growth in the same period.
For token TA and market updates: Want more token insights like this? Sign up for Editor Harsh Notariya’s Daily Crypto Newsletter here.
 Stellar’s DeFi Performance: Defillama
This lack of traction in Stellar’s DeFi layer has likely weighed on price. Even so, buying activity has increased, showing that retail traders are still trying to lean bullish.
Net outflows have now run for five consecutive days, climbing from $3.38 million on August 23 to $9.85 million on August 27 — a near 200% increase.
 XLM Buyers At Work: Coinglass
Despite the DeFi weakness, it is worth noting that Stellar’s Real World Asset (RWA) segment is growing. RWA valuations are up more than 13% this month, at $510.79 million.
If Stellar can capture some of this demand, it could offset the XLM price drag from its sluggish DeFi adoption. More so if the buying activity continues.
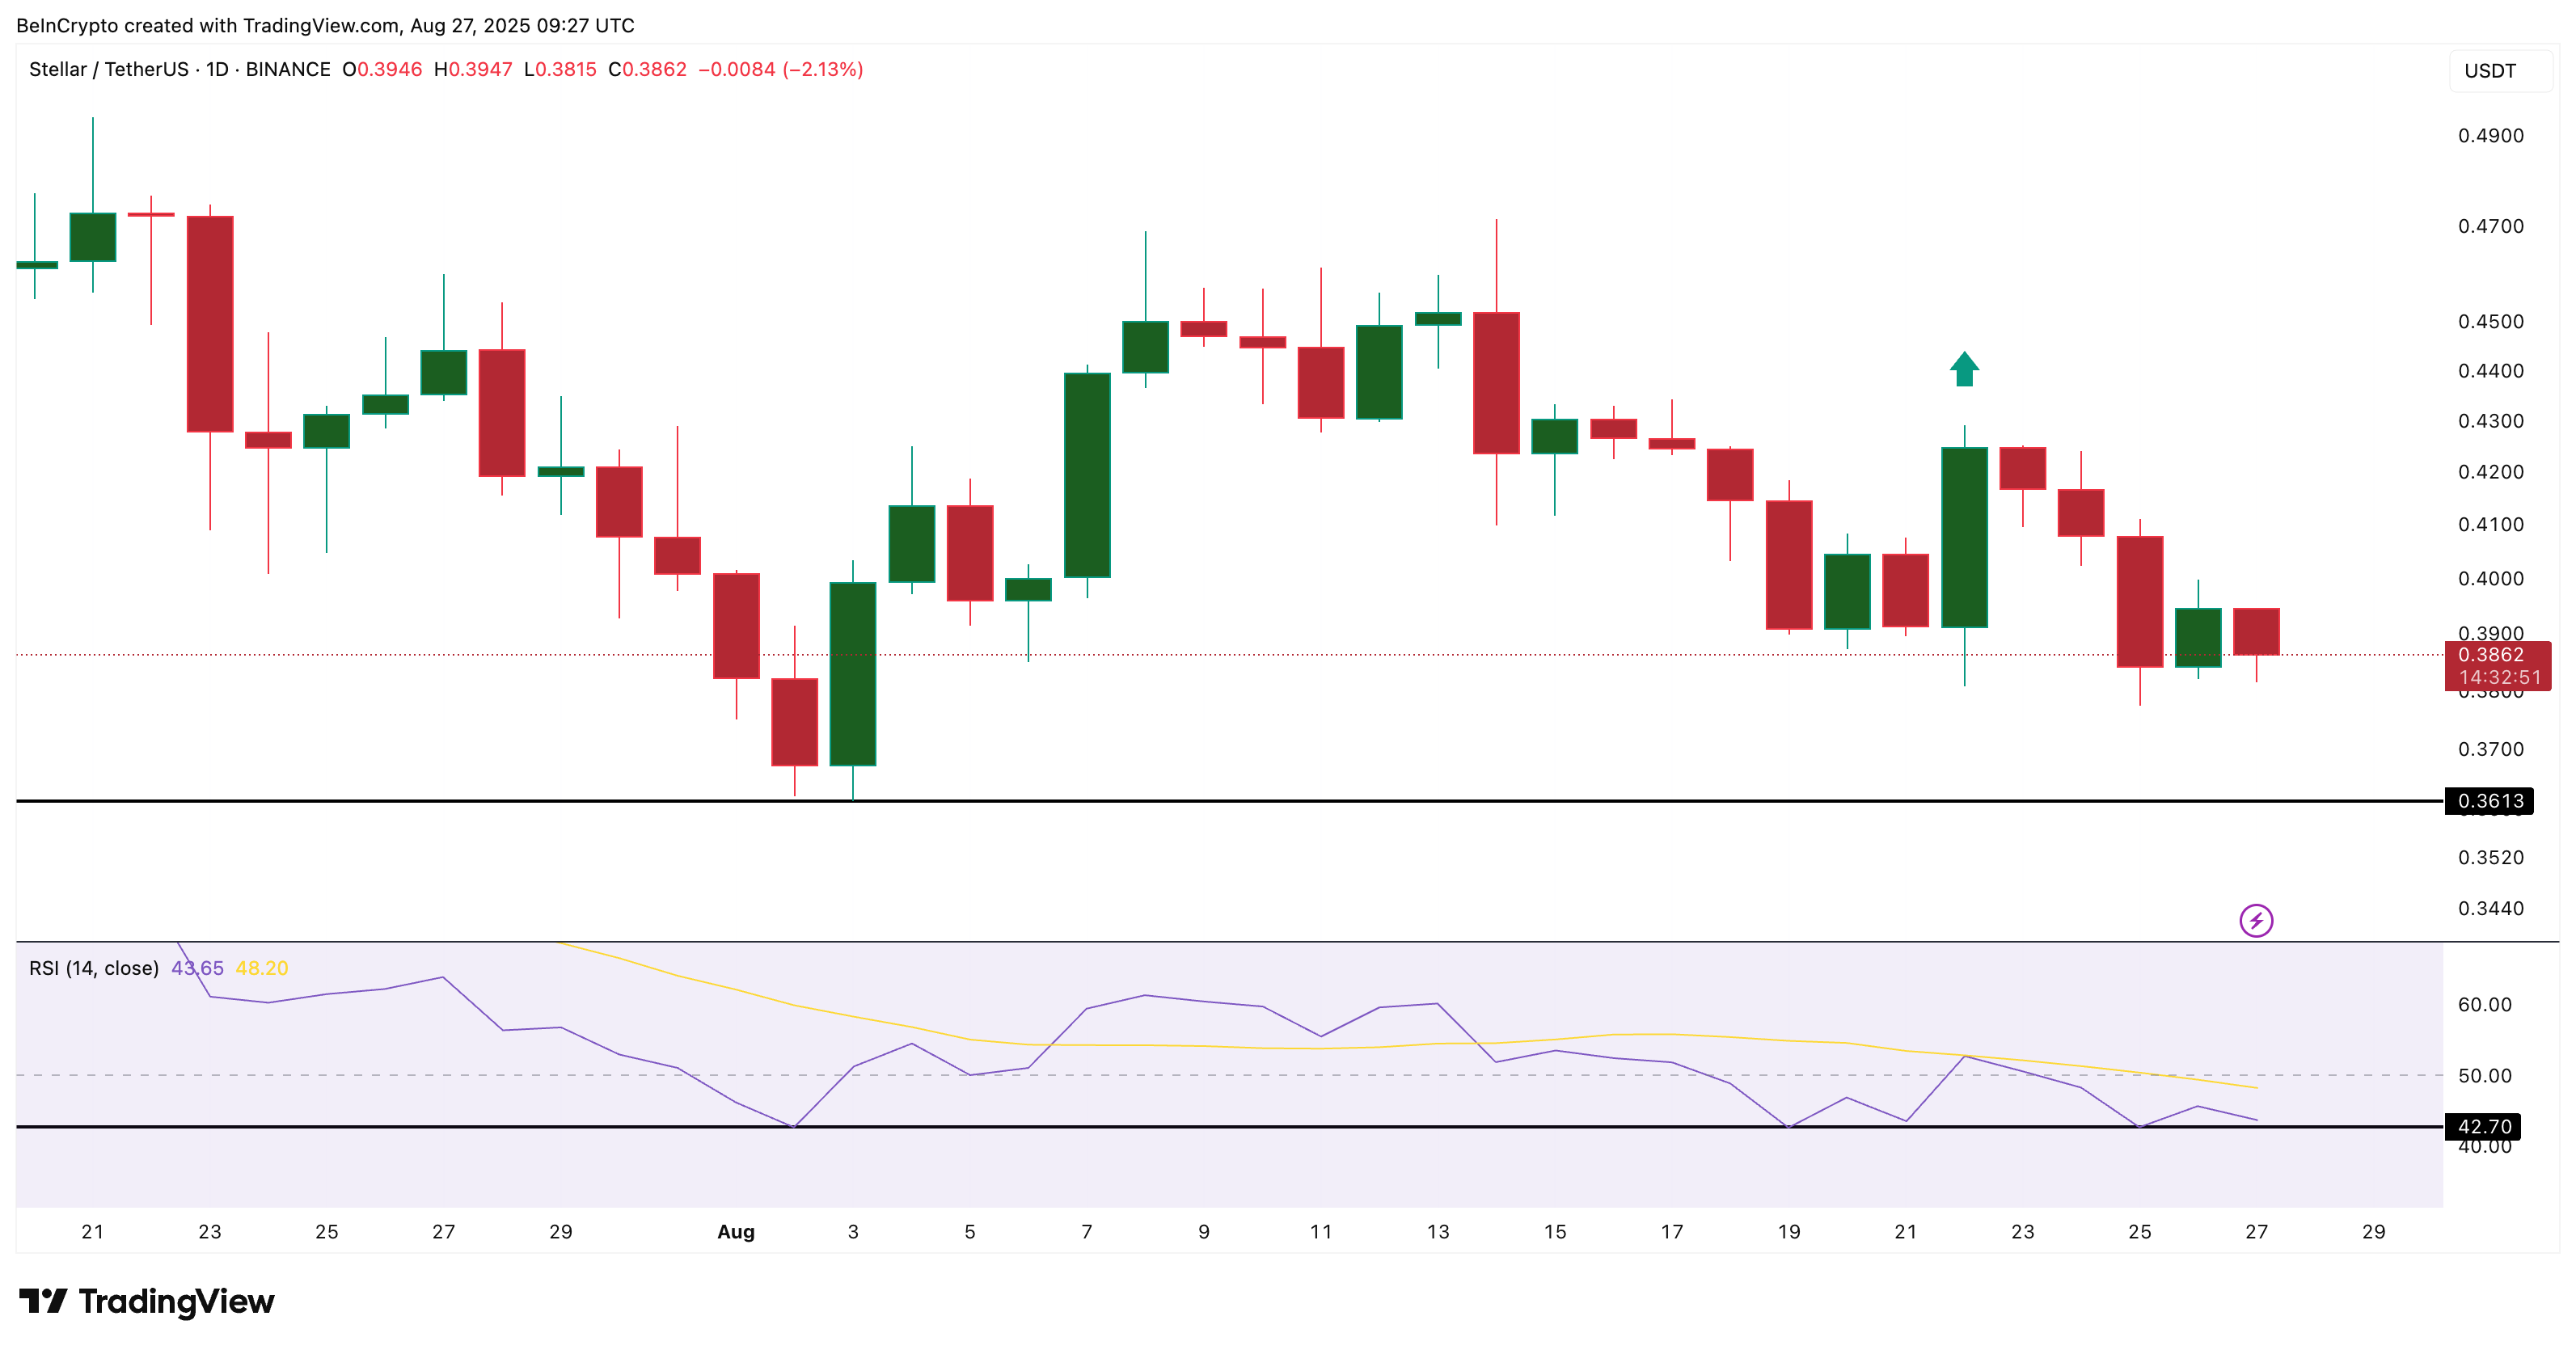
RSI Floor Shows Sellers Struggling
Beyond flows, technical signals add another layer. Stellar’s daily RSI has repeatedly tested the same floor (42.70) without breaking lower. This suggests sellers have failed to take full control.
 XLM Price And Sellers Losing Ground: TradingView
Between August 19 and 21, RSI even formed a small higher low while price printed a lower low. That divergence triggered a sharp green candle on the chart. It showed that even in a downtrend, buyers can step in when momentum shifts.
The Relative Strength Index (RSI) is a momentum indicator that tracks buying and selling strength.
For a clearer bullish reversal, the RSI would need to form another higher low while the price continues to drift. This would confirm that sellers are running out of strength, giving buyers room to lift the XLM price.
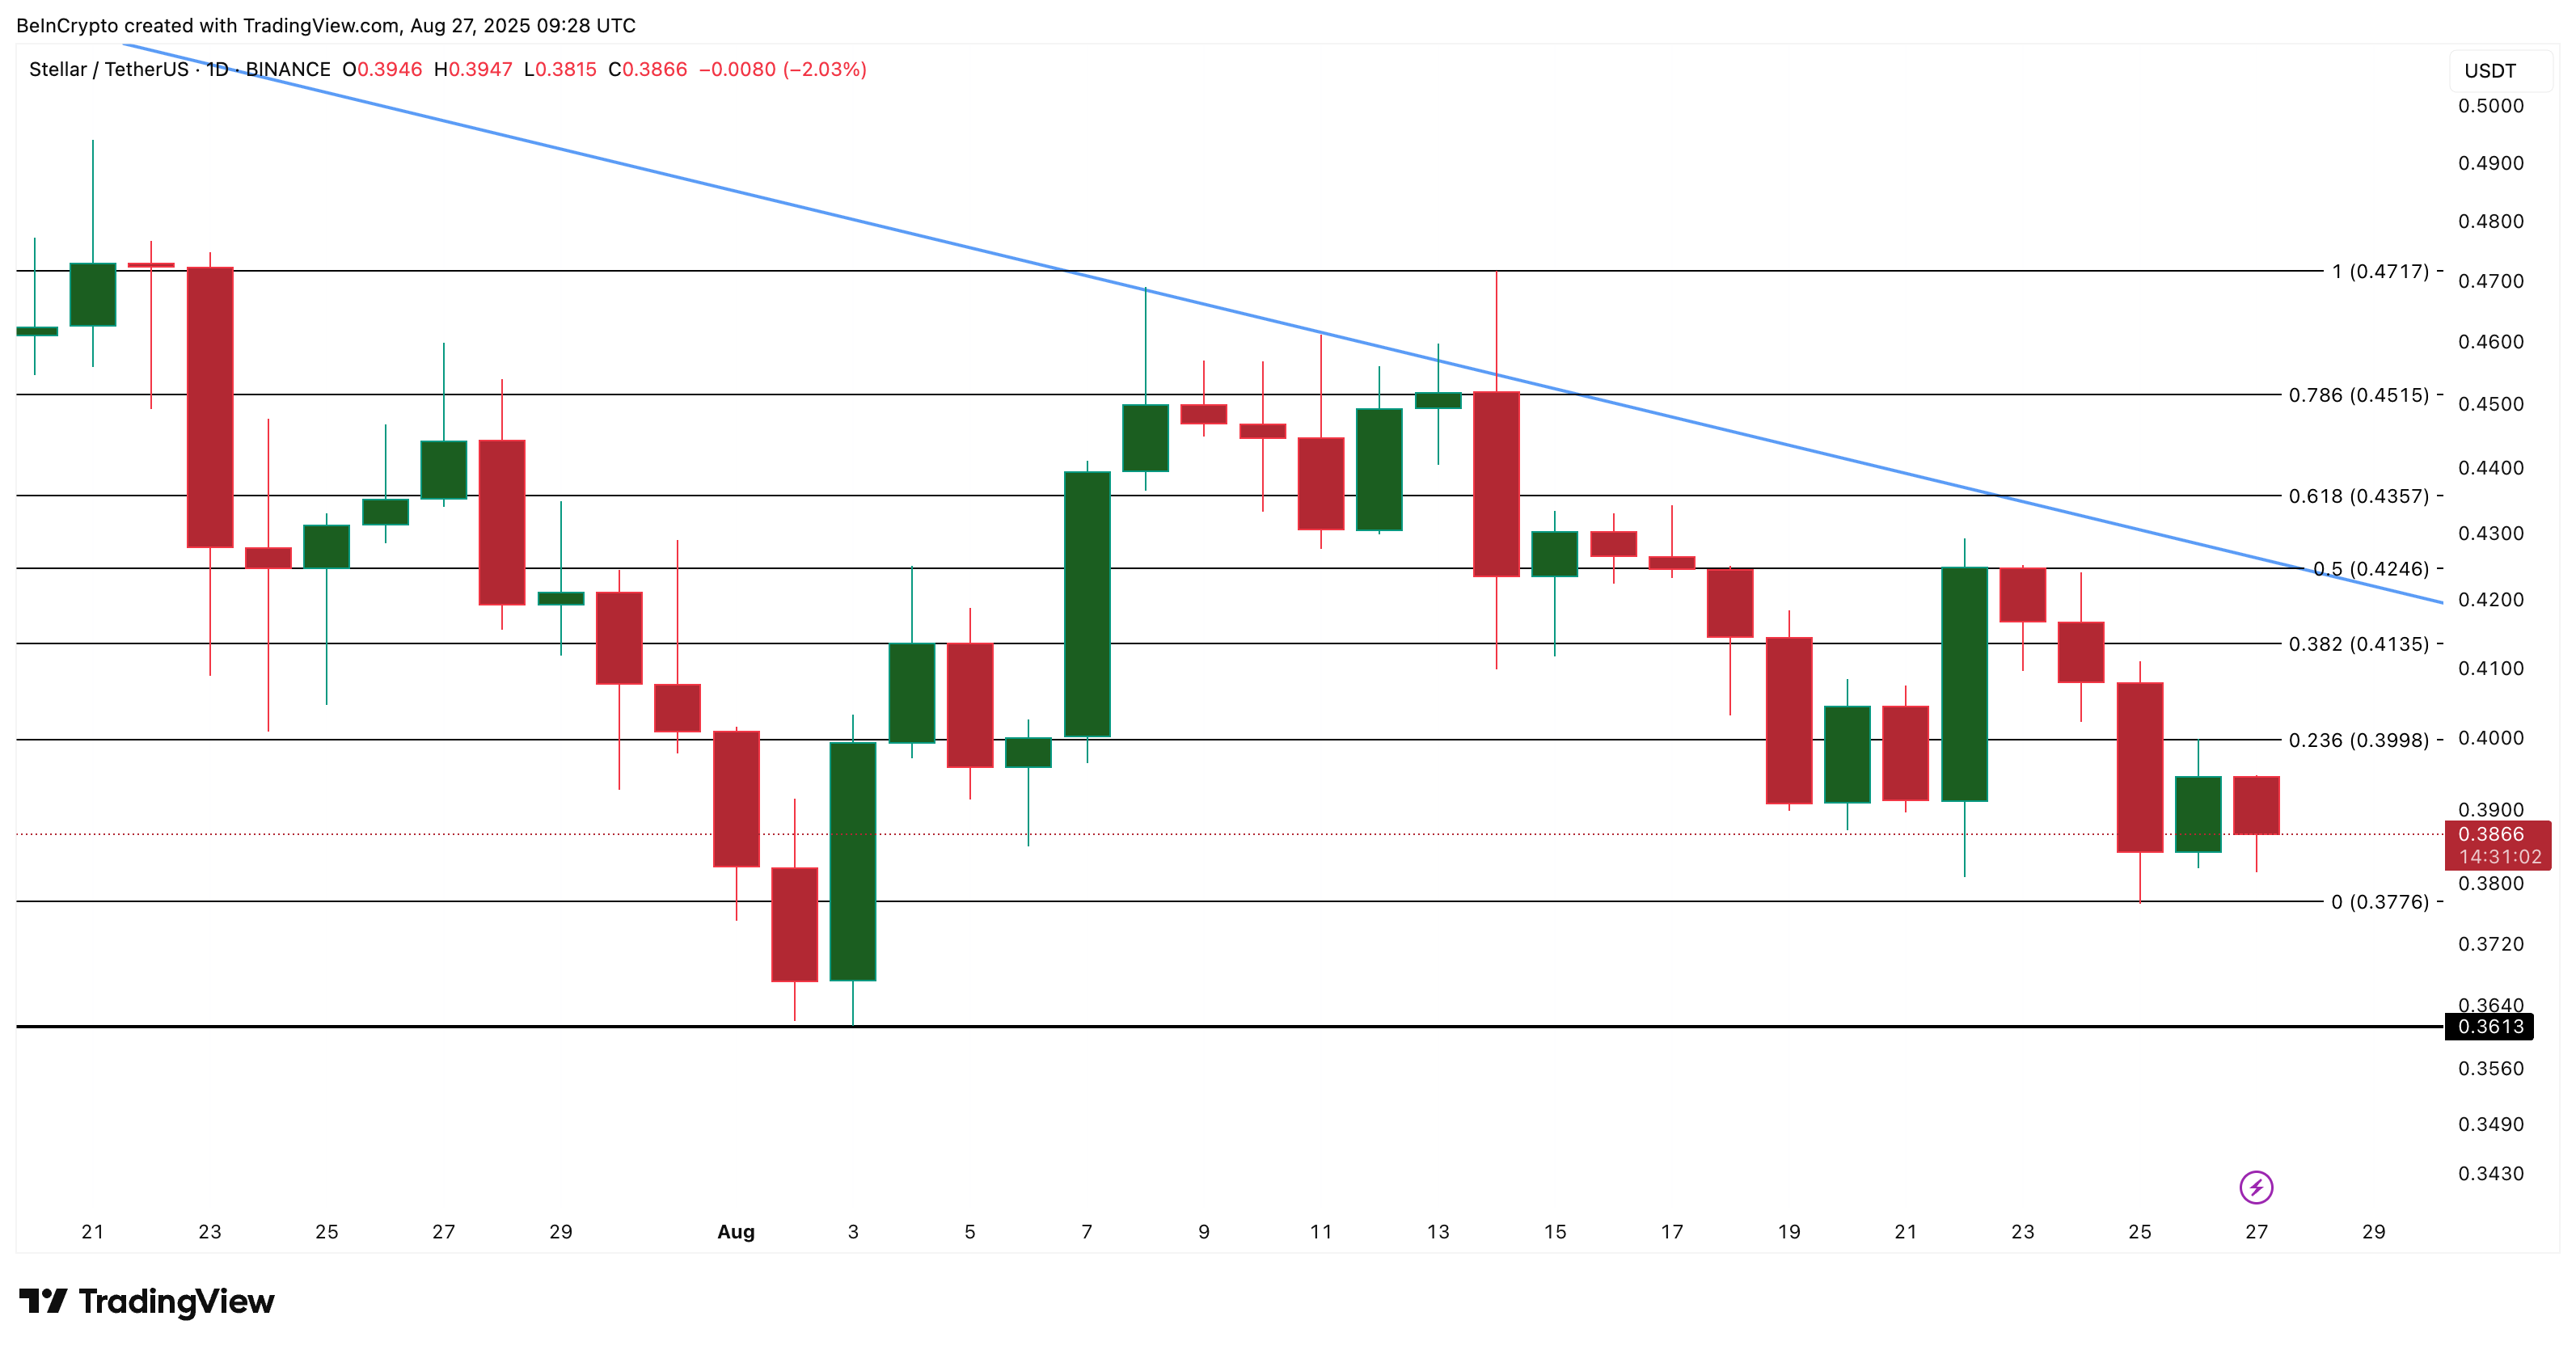
XLM Price Action: Key Levels To Watch
For now, Stellar remains stuck inside a descending triangle pattern — a setup that often signals bearish continuation. This means the bias is still tilted toward further downside unless key levels break.
 XLM Price Analysis: TradingView
On the downside, support at $0.37 is critical. A clean move under this level would confirm a breakdown and could trigger deeper losses.
On the upside, resistance at $0.39 is the first hurdle. A breakout above $0.42–0.43, a zone that has acted as both support and resistance in the past, would open the door for a stronger recovery. This would even invalidate the bearish pattern.
However, for now, the XLM price hangs in balance and trades in a range.
0
0


 Manage all your crypto, NFT and DeFi from one place
Securely connect the portfolio you’re using to start.

0
0


0
0