Why Is The Crypto Market Up Today?

0
0

The crypto market is up today because President Trump announced a five-day pause on planned strikes against Iran’s energy infrastructure on March 23, describing the talks as “very good and productive.” The news triggered an immediate risk-on reaction across financial markets, with Bitcoin jumping from below $68,000 to above $71,000 within hours.
Oil prices collapsed on the announcement — WTI crude fell 11%, and Brent dropped 8% — directly relieving the inflation and supply chain fears that had weighed on crypto for weeks. Over $270 million in Bitcoin short positions were liquidated in the same window, amplifying the upside move.
In the news today:-
- Japan’s Liberal Democratic Party launched a dedicated project team to design a national framework for AI-powered on-chain finance, its most ambitious legislative push yet into tokenized financial infrastructure. The move signals Tokyo now treats blockchain finance as a structural economic priority requiring cross-ministerial coordination rather than a niche regulatory concern.
- Balancer Labs is shutting down operations after co-founder Fernando Martinelli declared the corporate entity a liability following a $128 million exploit in November 2025 that targeted V2 vaults across Sonic, Polygon, and Base networks. The wind-down marks a significant turning point for the Balancer protocol, which must now chart a path forward without its founding corporate backer.
The Crypto Market Recovers Slightly
The total crypto market cap was trading near $2.31 trillion on March 22 — its lowest point since mid-February. The Trump announcement on March 23 sparked a 3.22% recovery, adding approximately $74.45 billion and pushing the total back to $2.39 trillion.
Want more token insights like this? Sign up for Editor Harsh Notariya’s Daily Crypto Newsletter here.
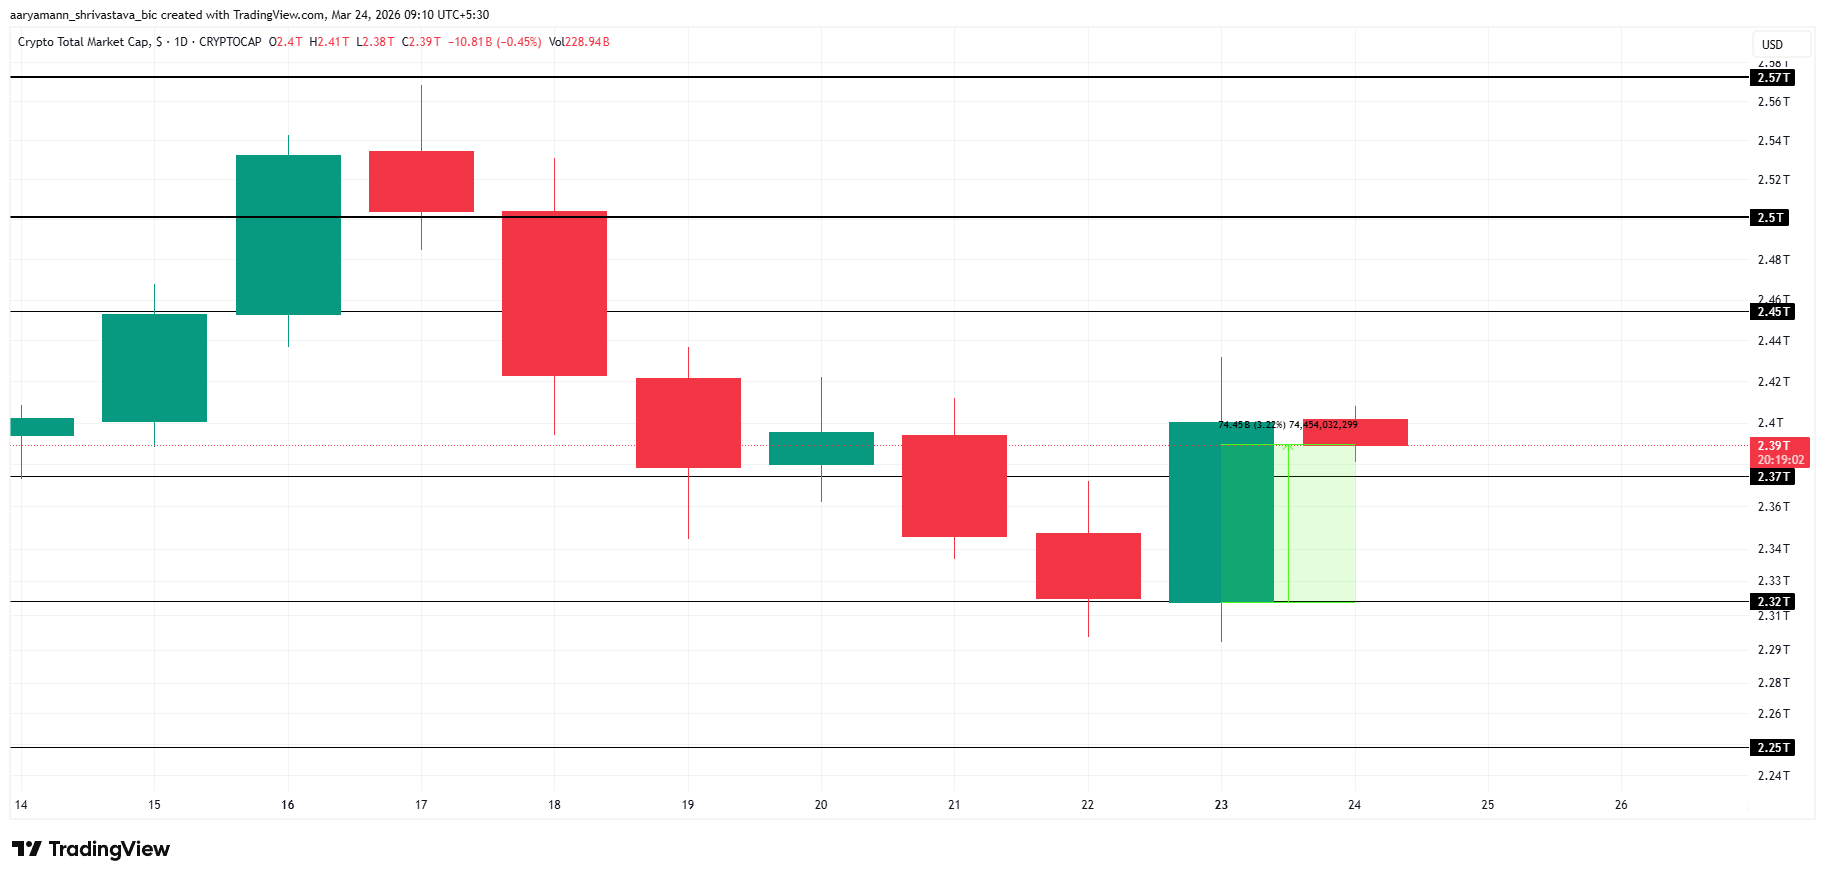 TOTAL Crypto Market Cap Analysis. Source: TradingView
The chart shows a clear structure: a downtrend from $2.55 trillion on March 16 to the $2.31 trillion low, followed by a single-session reversal candle on March 23. The $2.40 trillion level is the immediate resistance. A close above it would confirm the low is in. The $2.50 trillion and $2.57 trillion levels are the broader recovery targets.
On the other hand, TOTAL falling to $2.32 trillion or lower would invalidate the bullish thesis if the market turns negative in the coming days due to unforeseen circumstances.
Bitcoin Finds Support
Bitcoin (BTC) is trading at $70,516, consolidating just below the $70,552 resistance after briefly touching $71,093 on March 23. The $68,865 level below provided the floor that held during March 22’s sell-off and now acts as support on any pullback.
The MFI reads 70.13 and has been rising steadily since late January. It has not yet reached the 80 overbought level, meaning buying pressure is strong but not exhausted. The $270 million in short liquidations from Monday’s session created a secondary boost on top of the geopolitical relief.
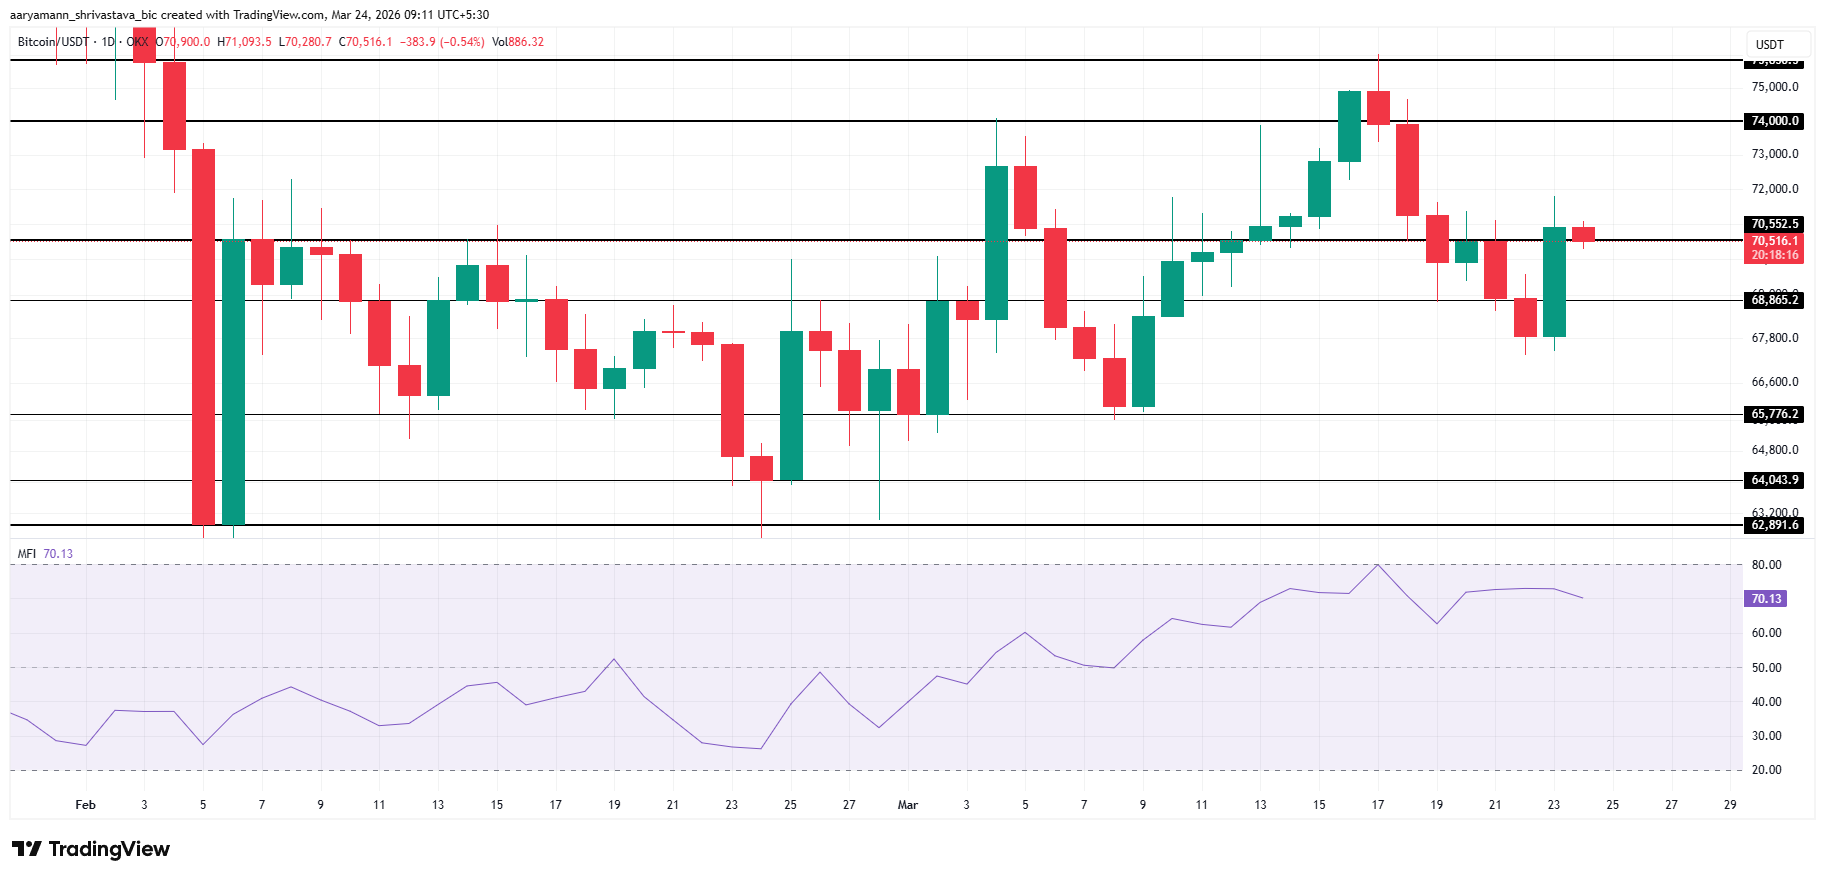 Bitcoin Price Analysis. Source: TradingView
Iran’s Fars news agency subsequently pushed back on Trump’s characterization of the talks, stating no meaningful progress had been made. That caveat pulled Bitcoin back from $71,093 toward $70,500, explaining the slight daily loss despite the net positive session. If the bullish momentum persists, a rise to $74,000 is ahead; otherwise, BTC could fall back down to $65,776.
Artificial Superintelligence Alliance Jumps Slightly
FE trillion price is trading at $0.2324, up 2.47%, sitting just above the Fibonacci 0.786 level at $0.2318 — a technically significant position.
The CMF reads +0.05 — barely positive, but the first positive reading since February. That shift indicates that for the first time in weeks, buyers are closing candles in the upper half of their daily range with volume. The move is fragile but directionally meaningful.
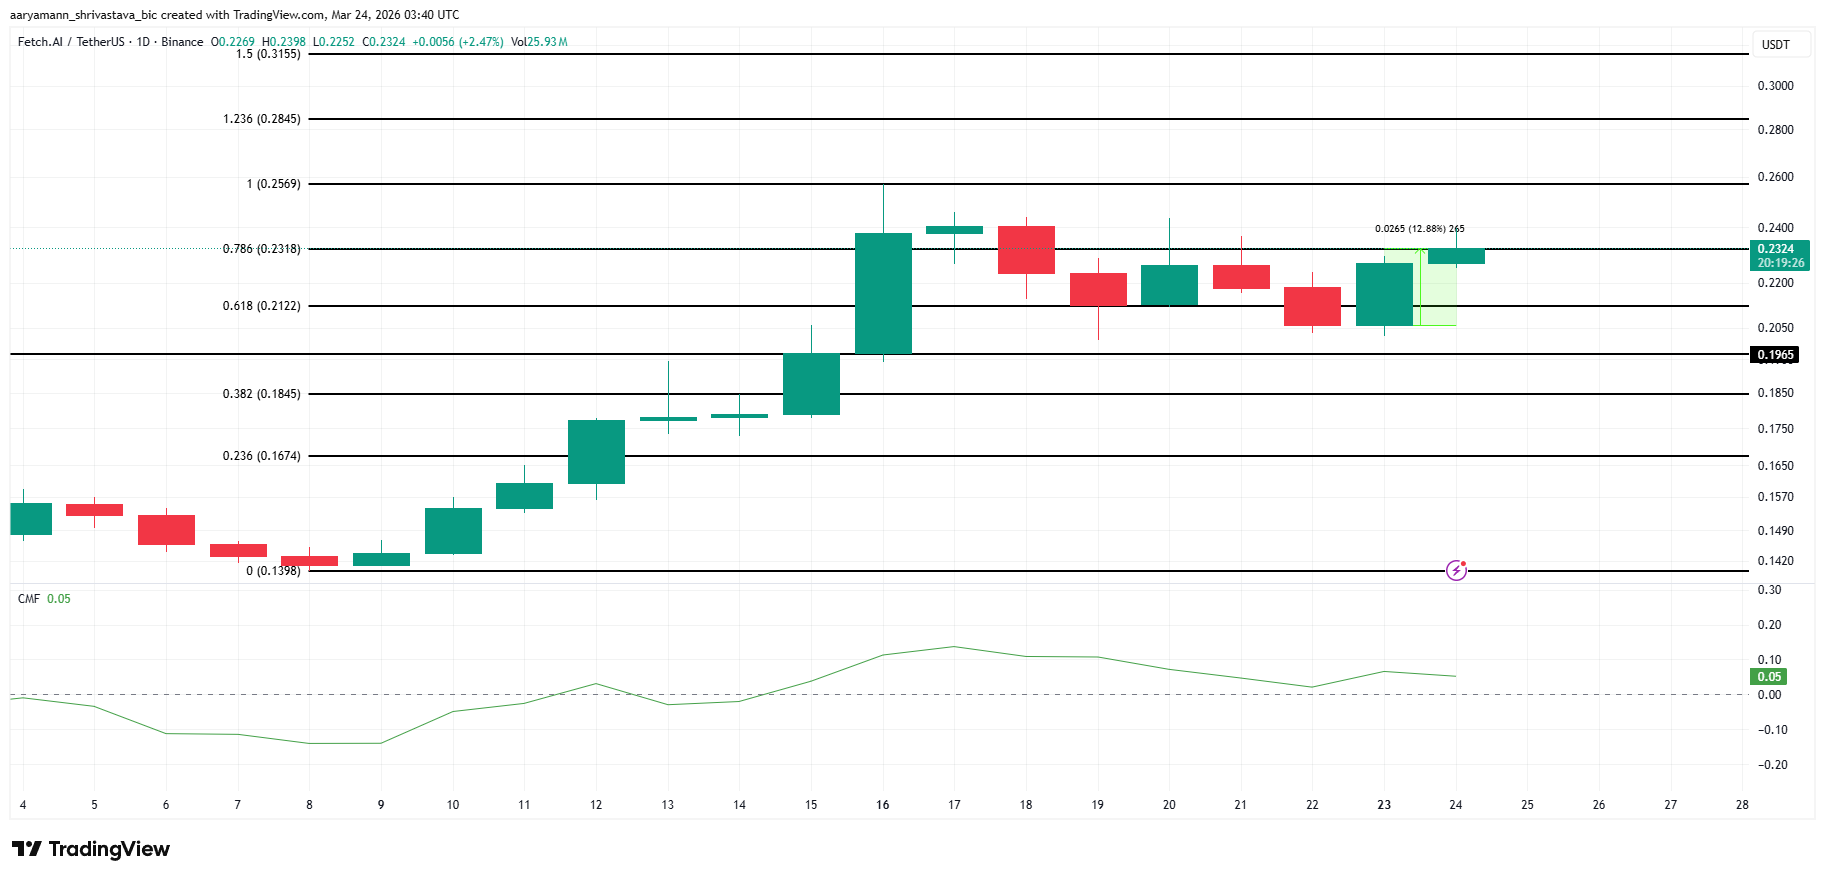 FET Coin Price Analysis. Source: TradingView
If the FET price holds above the 0.786 level at $0.2318, the next Fibonacci target is the 1.0 extension at $0.2569 — roughly 10% above the current price. The $0.1965 horizontal support below is the key floor to hold on to any Iran-related reversal.
0
0


 Manage all your crypto, NFT and DeFi from one place
Securely connect the portfolio you’re using to start.


0
0

0
0