Can Solana Price Break $147 After Bridging Of $450M to Solana?

0
0

Solana (SOL) blockchain led other chains in revenue dominance as it received inflows from bridged assets which could define its monthly trajectory.
Other Chains Bridging to Solana
Ethereum (ETH) contributed more than $300 million of the more than $450 million in bridging assets that April brought to the Solana blockchain.
The extensive cross-chain activities highlighted users were growing more confident about Solana’s ability to handle both large scale operations and maintain cost effectiveness.
A rise in capital flowing toward Solana’s decentralized finance (DeFi) and dApp ecosystem showed that users and developers were paying more attention. This could boost SOL’s liquidity and market utility.
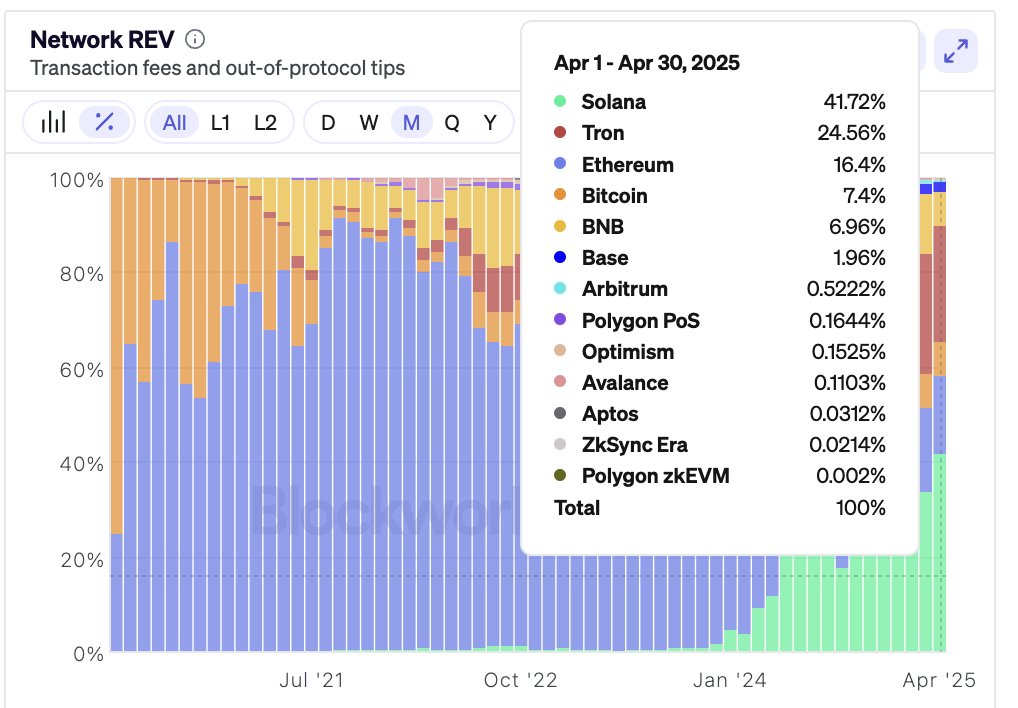
Solana’s revenue exceeded $88 million to establish itself as the dominant platform over all Layer 1 and Layer 2 chains while generating 41% of total revenue.
The crypto market position of SOL could strengthen but ongoing sustainable growth required network reliability and permanent developer retention along with general market stability.
The future growth of the network could be in jeopardy if the rate of decreased activity persists alongside a resurgence of network congestion.
Solana Crypto Liquidation Levels
More information in the SOL liquidation chart indicated a price standing at $143.32 was positioned just above the long liquidations of several at $143.5.
The findings from the analysis brought out possible threats on the downside as market momentum could change through that region and amplify trader liquidations.
The most notable element on the chart was the enormous short liquidation cluster which extended from $145 up past $150.

Aggressive short position from Binance and its competitors Bitget and Bybit showed a “liquidation magnet” effect within the aforementioned price range.
An upward price move above $145 could trigger an active liquidation cascade across short positions. This would potenyially create rapid volatility that could extend to prices above $147.5 and higher.
However, the market would initially correct long positions at any level below $143.5. Market participants should anticipate wild fluctuations could occur within these particular areas.
SOL Price Analysis
Now, the trendline which SOL maintained since 2020 continued to protect an uptrend structure across its monthly time frame perspective.
The trendline and the upper resistance confined price in a presumably ascending triangle pattern which is usually a bullish pattern.
Solana price position of $144.59 held firmly above a critical support range extending from $120 to $150 that historically triggered substantial upward price developments.
SOL price zone enabling trend continuation showed its pattern-forming behavior on multiple upward bounces throughout the past months.
This SOL price action needed to close above $180 to $200 on a monthly period as these resistance levels were previously used to reject price climbs.

The potential breakout of this support area signaled the way toward another run at all-time highs at around the $300 price zone.
A failure to sustain the trend line or a drop below the $120 support level could activate a potential market-wide correction that would target the $85 price point.
The market brightness stayed robust as the ongoing ascending price wave did not break.
Five consecutive points adhering to this trendline starting in 2020 displayed market purchaser strength at each touchpoint.
Market momentum for continued price growth could strengthen if prices broke and stayed above $200 but bulls needed both to establish true upward movement.
Caution about trendline resistance and overall Solana crypto price validation continued to remain essential for the near future.
The post Can Solana Price Break $147 After Bridging Of $450M to Solana? appeared first on The Coin Republic.
0
0


 Manage all your crypto, NFT and DeFi from one place
Securely connect the portfolio you’re using to start.


