
MUBARAK Price Prediction: Why This BNB Meme Coin Is Surging Today?

0
0

A meme coin that most traders had written off just turned every head on crypto Twitter in a single afternoon. Nobody saw the size of this move coming, and that is exactly what makes it worth unpacking. This MUBARAK price prediction breaks down what actually pushed it there, who is holding the bag, and whether the story has legs or just vibes.
What Is Driving Todays Sudden MUBARAK Breakout
Mubarak did not creep higher today; it jumped. And the jump came with a story attached, not just random buying. When we pulled up the trading activity, the first thing that stood out was how fast volume outran the price itself. That is not normal. That is a crowd showing up all at once.
This MUBARAK price prediction starts with a simple question. Is this rally built on something real, or is it another meme pump that fades by the weekend? Turns out, there is a bit of both here, and we will walk through the receipts.
The buzz traces back to a meme coin charity campaign on Four.meme that the project's own team publicly celebrated, and traders on BNB Chain noticed fast.
But hype alone rarely explains a move this sharp. So what does the data actually say?
MUBARAK Price Today: Market Snapshot
Metric | Value |
Price | $0.0278 |
24H Change | +39.52% |
Market Cap | $27.8M |
24H Volume | $37.4M |
Vol/Mkt Cap (24H) | 131.84% |
Liquidity/Mkt Cap | 7.93% |
Total/Max Supply | 1,000,000,000 MUBARAK |
Holders | 30,373 |
All-Time High | $0.2158 (Mar 18, 2025) |
All-Time Low | $0.0002725 (Mar 13, 2025) |
Data pulled from CoinMarketCap, last checked August 22, 2026, 10:00 UTC.
MUBARAK crypto is still trading roughly 87% under its all-time high. And it sits more than 10,000% above its all-time low. Both facts are true at once. That is meme coin math for you.
One number matters more than the rest here. Supply is fully circulating already, at a full 1 billion tokens. No hidden unlock cliff is waiting to dump on holders later, which removes one common bear case other tokens carry.
Why Is MUBARAK Price Up Today
This was not a broad market rally lifting every coin together. Mubarak outpaced the wider market by a wide margin, and the volume behind it, near $37.4M in 24 hours against a $27.8M market cap, tells you retail traders piled in fast, not slow accumulation from a fund.
The spark looks social, not fundamental. The project's own account amplified a Four.meme charity donation push that reportedly generated 100 BNB from on-chain trading activity, and that kind of feel-good, shareable moment tends to travel fast inside meme coin circles.
Add in chatter about inclusion on a broader BNB Chain meme rotation, and you get a classic momentum trade. Influencers post, volume follows, price follows volume.
Noted.
If that social momentum holds and volume stays elevated, a retest of higher resistance is realistic. And if it fades, so does the move, quickly. Timing matters here.
Coins riding this kind of narrative wave often show up on broader crypto news roundups within days, which can extend attention or just as easily end it.
MUBARAK Technical Analysis: Levels That Matter
MUBARAK 4-Hour Chart Analysis
On the 4-hour TradingView chart, MUBARAK carved a rounded bottom before breaking higher, with trading currently sitting above its 20 EMA near $0.0212, a sign buyers control the short-term trend.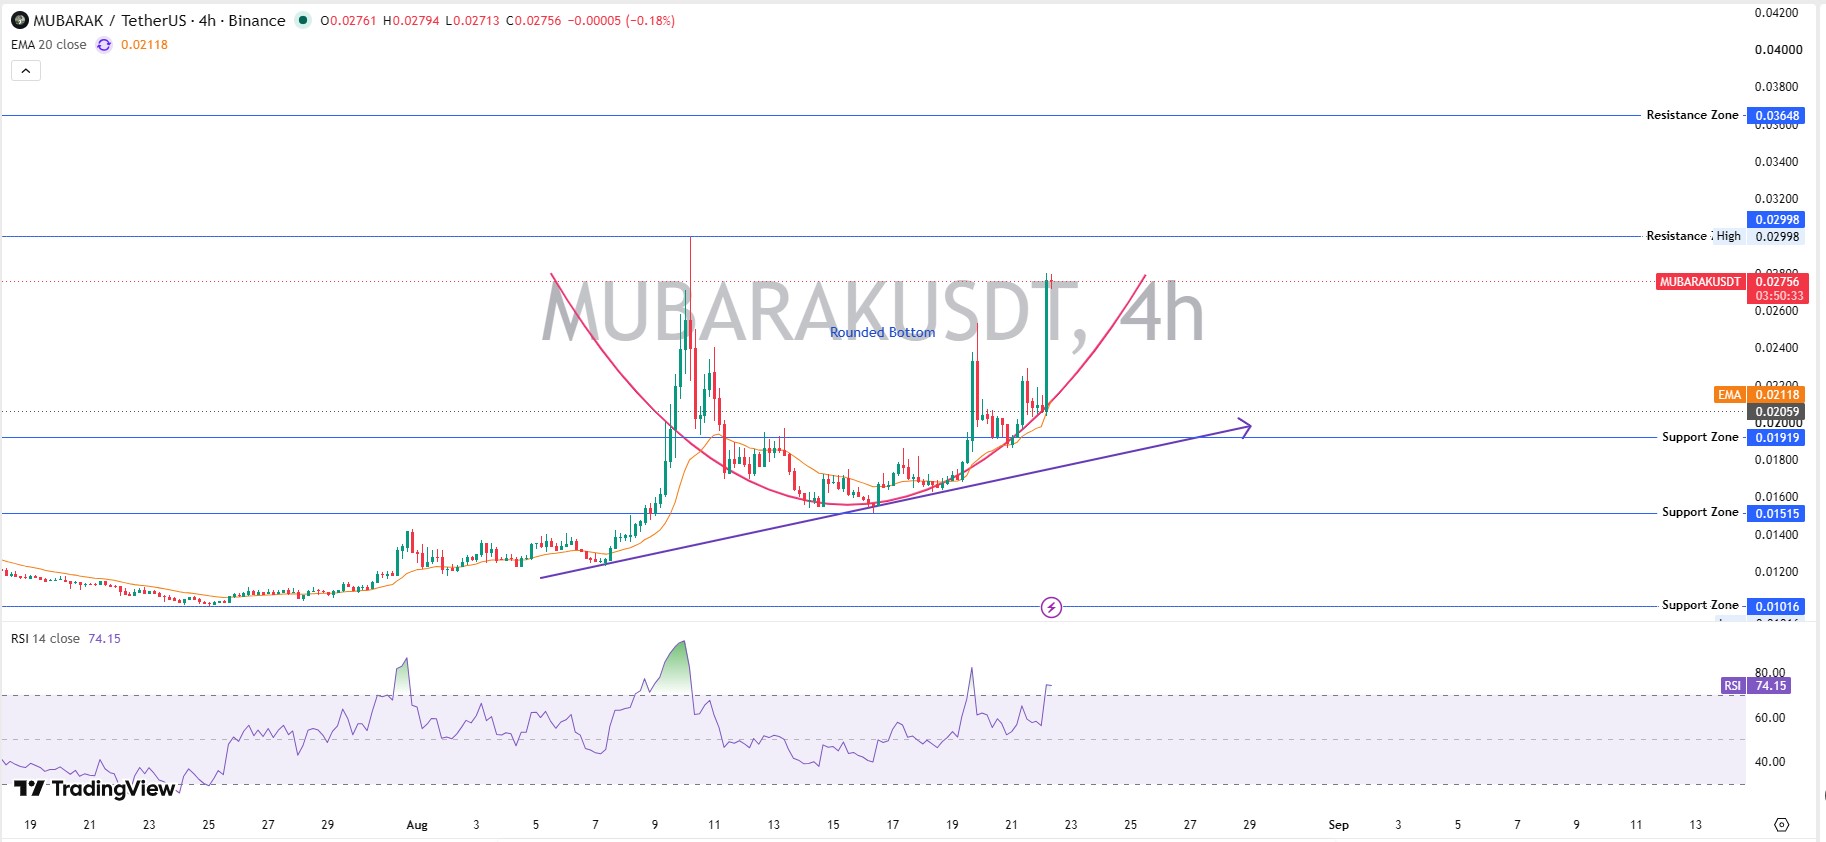
Resistance zones sit at $0.02998 and $0.03648. A push through both would open room toward the weekly resistance band near $0.04499.
Support now builds around $0.01919, then $0.01515, with $0.01016 as a deeper cushion if sentiment turns.
RSI on the 4-hour is printing 74, which is stretched. That usually invites a cooldown before the next leg, not an instant reversal, just a pause.
And pauses after moves this fast tend to shake out weak hands before any real continuation. Traders watching this MUBARAK price prediction closely should treat the short-term chart as momentum confirmation, not a green light to ignore risk.
MUBARAK Weekly Chart Analysis
Zoom out, and the picture changes shape entirely. The weekly chart tells a bigger story than any single afternoon candle can.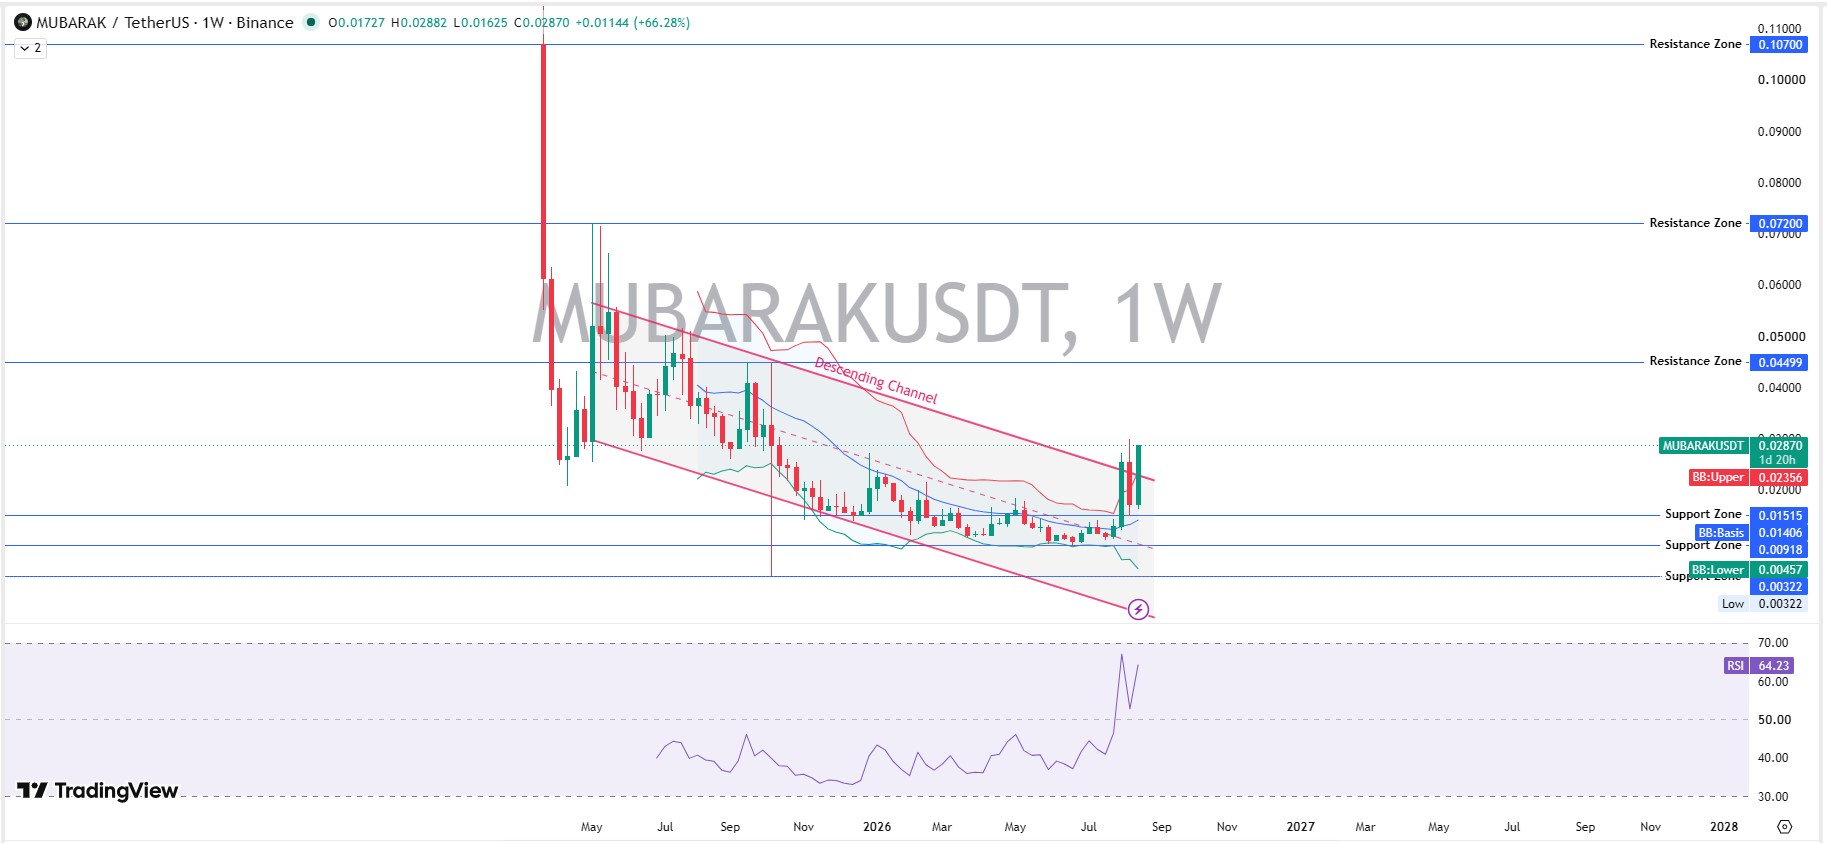
Trading broke out of a long descending channel this week, a structure that had capped price for months. The weekly candle is up over 66%, with trading pushing from the low $0.017s toward the upper $0.028s.
Weekly RSI sits at 64, healthier and less exhausted than the short-term reading. That gap between the two timeframes matters. It suggests the bigger trend has room left, even if the smaller one needs to cool first.
Resistance above sits at $0.04499, then $0.07200, and then $0.10700, each a prior supply zone from earlier in the channel. Support sits near $0.01515, with the Bollinger Band basis around $0.01406 acting as a secondary floor.
MUBARAK Price Prediction: Bear, Base, and Bull Scenarios
Charts and holder data are useful, but readers usually want a straight answer. So here is one, framed as ranges, not a single guess.
Timeframe | Bear Case | Base Case | Bull Case | Probability | Invalidation |
7 Days | 0.0165–0.0190 | 0.0230–0.0300 | 0.0365–0.0450 | Bear 25% / Base 50% / Bull 25% | Daily trading under $0.0192 |
30 Days | 0.0140–0.0175 | 0.0230–0.0365 | 0.0450–0.0650 | Bear 25% / Base 45% / Bull 30% | Weekly trading under $0.0152 |
Early 2027 | 0.0090–0.0120 | 0.0300–0.0600 | 0.0720–0.1070 | Bear 20% / Base 45% / Bull 35% | Loss of higher-low structure since August 2026 |
Bear case: social momentum fades within days, volume drops back under $10M, and trading slips beneath the $0.01919 support shelf. A break under $0.0152 on a weekly basis would open the deeper $0.01016 zone.
Base case: the rally cools but holds recent gains, with MUBARAK crypto consolidating between the two chart timeframes discussed above while the market waits for the next catalyst.
Bull case: volume stays elevated, short sellers keep getting squeezed, and trading clears $0.03648 with enough follow-through to test the weekly resistance band near $0.0720.
Noted. None of this is a promise, just where the structure points if current conditions hold.
Holder Concentration: The Risk Nobody Is Posting About
This is where the story gets less fun. The top 100 wallets hold 97.56% of the supply, per BscScan data. Whale wallets, just 0.03% of all holders, control 85.23% of the tokens.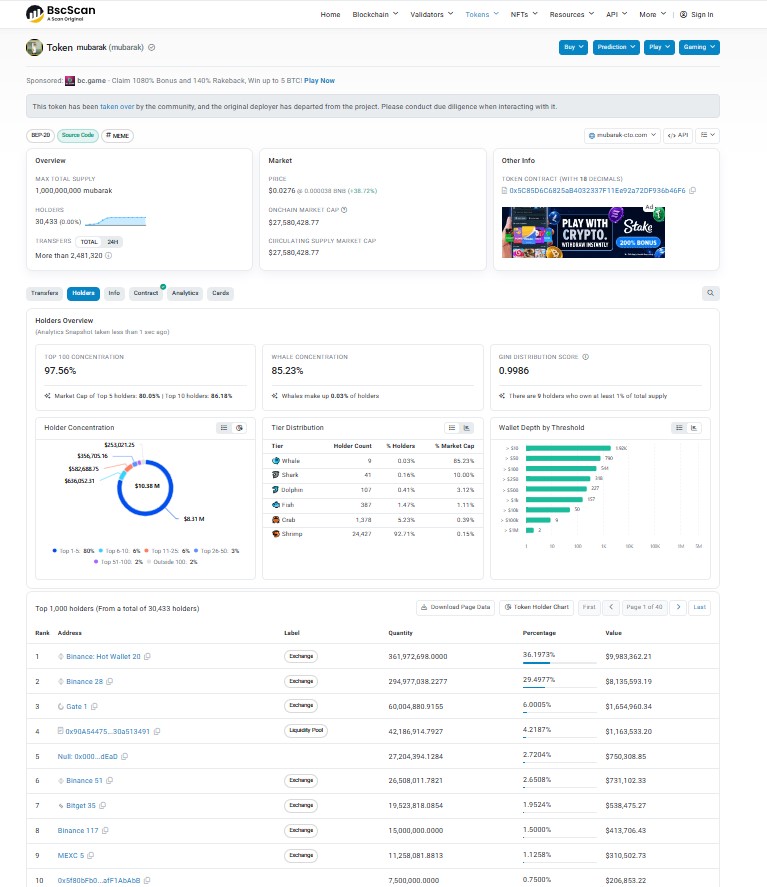
The Gini distribution score sits at 0.9986, close to maximum concentration. But before anyone panics, the largest wallets here are mostly exchange hot wallets and a liquidity pool, not one anonymous whale sitting on the entire supply.
Still, that structure means big exchange-side moves can swing price fast. Thin secondary liquidity plus concentrated balances is a combination worth respecting, not ignoring.
Liquidations and Trading Volume
Short sellers had a rough day. Over the past 24 hours, liquidation data shows $157.60K wiped out, with $131.70K of that coming from short positions against just $25.89K in longs.
That is a short squeeze pattern. Traders betting against the move got forced to buy back in, which likely added fuel to the rally itself.
Binance dominates trading volume at roughly $32.93M, followed by OKX near $15.75M, with Bitget, Bybit, and smaller venues rounding out the rest. Volume this concentrated on one or two exchanges can amplify both rallies and drops.
Risks Behind This MUBARAK Price Prediction
Volatility is the headline risk. A coin that can gain 39% in a day can lose it just as fast once social attention moves elsewhere.
Whale-heavy exchange wallets remain a watch item, even with the nuance above. And meme-driven rallies without a product roadmap behind them tend to mean-revert once volume cools.
Regulatory noise across the wider industry, including ongoing MiCA compliance discussions in Europe, is a background risk for the entire meme coin category, not just this token.
Final Word
Short-term: bullish, momentum-driven, but stretched. Medium-term: it depends entirely on whether this social wave turns into sustained volume or fades by next week. This is not a slow-burn fundamentals story right now; it is an attention story, and attention is fickle.
Disclaimer
This article is for informational purposes only and does not constitute financial, investment, or trading advice. All price levels and scenarios discussed are based on data available at the time of writing and are not guarantees of future performance. Cryptocurrency markets are highly volatile and speculative; conduct independent research before making any investment decision.
0
0

 Manage all your crypto, NFT and DeFi from one place
Securely connect the portfolio you’re using to start.
