Chainlink price prediction 2024-2030: A strong buy sentiment for LINK?

0
0

Key takeaways
- Chainlink price prediction for 2024 could reach a maximum value of $19.29
- By 2027, LIINK could reach a maximum price of $65.89
- In 2030, Chainlink will range between $22.01 to $210.99
Chainlink, one of the leading altcoins in the crypto market, has witnessed a notable resurgence in the wake of a significant drawdown. Currently trading at $13.83, the token has experienced a modest 1.66% price surge over the past 24 hours, signaling a positive shift in momentum.
The price of $LINK has increased by ~15% since this mysterious whale first accumulated $LINK.
And the whale has accumulated 5,587,368 $LINK ($112M) from #Binance via 55 addresses in the past 6 days.https://t.co/ds8Ghx6eyu pic.twitter.com/rqKjfwk95V
— Lookonchain (@lookonchain) February 11, 2024
This enigmatic figure has amassed a staggering 5,587,368 LINK tokens, valued at around $112 million, through 55 different addresses on Binance within just 6 days. Other substantial LINK accumulations have been observed, including one withdrawal of 495,057 LINK worth $7.5 million on multiple occasions at an average price of $15.12.
While these individual accumulations do not wholly represent broader trends within the Chainlink ecosystem, data from IntoTheBlock suggests a total whale accumulation of $176.98 million in the past 24 hours, marking a substantial increase of 13.44%.
Overview
| Cryptocurrency | Chainlink |
| Token | LINK |
| Price | $13.01 |
| Market Cap | $7,911,477,413 |
| Trading Volume | $275,210,920 |
| Circulating Supply | 608,099,970 |
| All-time High | $52.88 May 09, 2021 |
| All-time Low | $0.1263 Sep 23, 2017 |
| 24 High | $13.37 |
| 24 Low | $11.27 |
Chainlink Price Prediction: Technical Analysis
| Price Prediction | $20.05 (53.24%) |
| Volatility | 8.40% |
| 50-Day SMA | $15.77 |
| 14-Day RSI | 40.76 |
| Sentiment | Bearish |
| Fear & Greed Index | 44 (Fear) |
| Green Days | 13/30 (43%) |
| 200-Day SMA | $16.36 |
Today’s Chainlink price is $13.01, with a 24-hour trading volume of $275,210,920. Chainlink is up 4.70% in the last 24 hours. The current CoinMarketCap ranking is 15, with a live market cap of $7,911,477,413. It has a circulating supply of 608,099,970 LINK coins, and the max. Supply is not available.
Chainlink price analysis: Bulls capture LINK market as buying pressure builds up
- Chainlink price analysis shows a bullish market today
- LINK/USD support is seen at the $12.30 level
- LINK/USD resistance is seen at the $13.04 level
Chainlink price analysis on 13th June displays a bullish trend, as the LINK/USD pair has gained over 4.70 percent in the last 24 hours. The upside momentum is propelled by increased buying pressure, which has helped the digital asset rise above the $13.00 level. The bulls have maintained their hold on the LINK market, as there have been no major sell-offs yet.
LINK has found strong support at the $12.30 level and is approaching a key resistance of $13.04, which could propel it further up in the coming days. In addition, the LINK/USD pair has seen a significant surge in the 24-hour trading volume, increasing over 30 percent. This suggests more investors are entering the market and supporting LINK’s price rally.
Chainlink price analysis 1-day chart: Bullish momentum builds as bulls dominate
The daily chart for Chainlink price analysis shows strong bullish momentum as prices steadily climb. The MACD is positive, indicating that bulls are firmly in market control. Further gains could be seen in the upcoming days if the buying pressure remains high.

LINK/USD 1-day price chart Source: TradingView
The RSI has also broken above the 45 level, suggesting that LINK is in a neutral zone and could see a minor correction before the bulls take it higher. Moreover, the Bollinger bands pointing upwards are evidence of increasing volatility and possible further price surges soon if the trend continues.
Chainlink price analysis 4-hour chart: LINK’s uptrend faces resistance at $13.04
The hourly chart for the LINK/USD pair reveals that LINK is currently trading above the $13.00 level but faces strong resistance at the $13.04 level, which could be a significant hurdle for bulls to overcome to take it further.

LINK/USD 4-hour price chart Source: TradingView
The 50-MA has shifted its position from the bearish zone to neutral. It is now inching closer toward the bullish region, indicating a growing bullish sentiment in the market. The MACD shows increasing buying pressure while the RSI is still in the neutral zone, suggesting that LINK needs to increase further to cross the $13.04 resistance level.
Chainlink technical indicators: Levels and action
Daily simple moving average (SMA)
| Period | Value | Action |
| SMA 3 | $14.34 | SELL |
| SMA 5 | $14.05 | SELL |
| SMA 10 | $14.19 | SELL |
| SMA 21 | $14.42 | SELL |
| SMA 50 | $15.77 | SELL |
| SMA 100 | $15.69 | SELL |
| SMA 200 | $16.36 | SELL |
Daily Exponential Moving Average (EMA)
| Period | Value | Action |
| EMA 3 | $14.13 | SELL |
| EMA 5 | $14.07 | SELL |
| EMA 10 | $14.15 | SELL |
| EMA 21 | $14.68 | SELL |
| EMA 50 | $15.34 | SELL |
| EMA 100 | $15.76 | SELL |
| EMA 200 | $15.32 | SELL |
Chainlink price analysis conclusion
Chainlink’s price analysis reveals that a bullish trend is likely to continue in the upcoming days as buying pressure increases and investors remain firmly in control of the LINK market. Bulls are focused on taking LINK above the $13.01 level before breaking through the $13.04 resistance mark. If this happens, LINK could soon be on its way to testing new highs.
Is Chainlink a good investment?
Chainlink represents a robust investment opportunity due to its pivotal role in linking external data to blockchains through its decentralized oracle network, which is crucial for the functionality of smart contracts, especially in DeFi. Its strategic collaborations with major blockchain platforms and traditional finance entities, such as Coinbase Cloud, enhance its reliability and expand its use cases across various industries. This interoperability and the essential nature of its services position Chainlink as a key player in the blockchain ecosystem, making it an attractive option for investors looking for growth potential in the cryptocurrency market.
Will Chainlink recover?
Chainlink’s price has declined recently, with minor short-term recoveries; however, the move is gradual. The general trend remains bearish as it seeks support.
Will Chainlink reach $15
Chainlink price shows a recent decline with some stabilization, predicting whether Chainlink will reach $15 is uncertain.
Will Chainlink reach $100?
It is highly speculative to predict if Chainlink will reach $100.
Does Chainlink have a good long-term future?
Chainlink shows some stabilization and potential for recovery, indicating the token may have a promising long-term future.
Recent news/opinion on Chainlink
Chainlink has partnered with Rapid Addition to launch a FIX-native adapter, boosting efficiency in institutional digital asset transactions. This new adapter, supported by Chainlink’s Cross-Chain Interoperability Protocol (CCIP), allows banks and other financial entities to streamline their dealings with tokenized assets.
The initiative targets sectors such as renewable energy, carbon credits, and real-world assets to reduce technical challenges and improve compatibility across systems. By lowering entry barriers and fostering greater integration, this strategic collaboration is set to accelerate the institutional embrace of blockchain technology and cryptocurrencies.
Chainlink price prediction July 2024
In July 2024, the price of Chainlink is estimated to be trading between $12.30 and $13.04 in 2024, and its average cost is expected to be around $13.01 during the year.
| Chainlink Price Prediction | Potential Low ($) | Average Price ($) | Potential High ($) |
| Chainlink Price Prediction July 2024 | $12.30 | $13.01 | $13.04 |
Chainlink Price Prediction 2024
After analyzing the prices of Chainlink in previous years, it is assumed that in 2024, the minimum price of LINK will be around $12.30. The maximum expected LINK price may be around $13.04. On average, the trading price might be $13.01 in 2024.
| Chainlink Price Prediction | Potential Low ($) | Average Price ($) | Potential High ($) |
| Chainlink Price Prediction 2024 | $12.30 | $13.01 | $13.04 |
Chainlink price prediction 2025-2030
| Year | Minimum | Average | Maximum |
| 2025 | $26.15 | $27.05 | $30.05 |
| 2026 | $38.22 | $39.30 | $46.48 |
| 2027 | $56.82 | $58.78 | $65.89 |
| 2028 | $80.82 | $83.76 | $99.62 |
| 2029 | $118.71 | $122.90 | $142.51 |
| 2030 | $172.44 | $178.58 | $210.99 |
Chainlink Price Prediction 2025
In 2025 the price of Chainlink is expected to reach at a minimum price value of $26.15. The LINK price can reach a maximum price value of $30.05 with the average value of $27.05.
Chainlink Price Prediction 2026
The price of Chainlink is expected to reach at a minimum level of $38.22 in 2026. The LINK price can reach a maximum level of $46.48 with the average price of $39.30 throughout 2026.
Chainlink Price Prediction 2027
The price of Chainlink is predicted to reach at a minimum level of $56.82 in 2027. The Chainlink price can reach a maximum level of $65.89 with the average price of $58.78 throughout 2027.
Chainlink Price Prediction 2028
Chainlink price is forecast to reach a lowest possible level of $80.82 in 2028. As per our findings, the LINK price could reach a maximum possible level of $99.62 with the average forecast price of $83.76.
Chainlink Price Prediction 2029
Chainlink price is forecast to reach a lowest possible level of $118.71 in 2029. As per our findings, the LINK price could reach a maximum possible level of $142.51 with the average forecast price of $122.90.
Chainlink Price Prediction 2030
The price of Chainlink is predicted to reach at a minimum value of $172.44 in 2030. The Chainlink price could reach a maximum value of $210.99 with the average trading price of $178.58 throughout 2030.

Chainlink market price prediction: Analysts’ OP price forecast
| Firm | 2024 | 2025 |
| Gov.Capital | $27.41 | $53.94 |
| DigitalCoinPrice | $38.64 | $45.46 |
| Coindex | $23.00 | $ 75.86 |
Cryptopolitan’s Chainlink price prediction
According to our Chainlink price forecast, the coin’s market price might reach a maximum value of $26.06 by the end of 2024. In 2026, the value of LINK could surge to $55.40.
Chainlink’s historic price sentiment
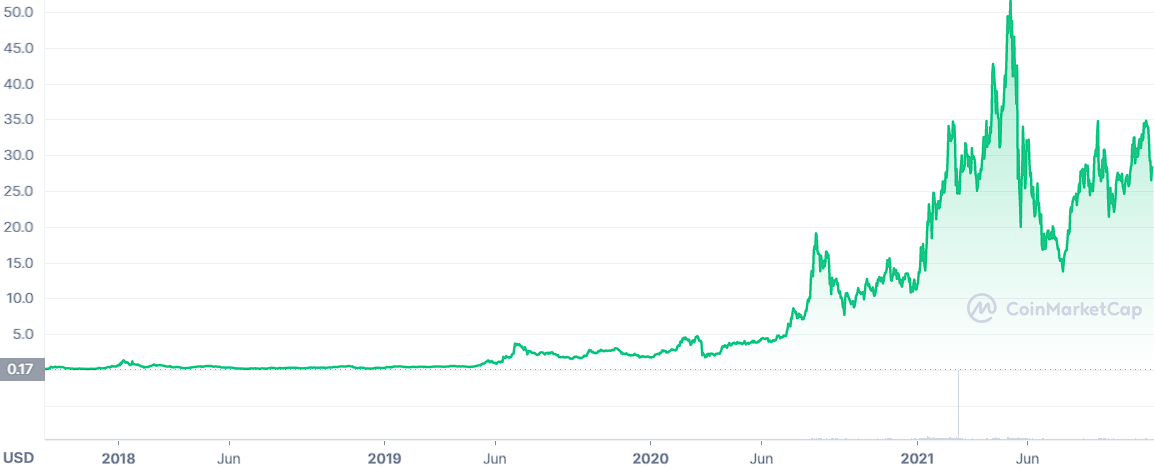
- 2018 began with a strong bullish rally, and most digital assets were at their summit. Chainlink token was not an exception. However, after that, a sharp freefall in the altcoins market resulted in billions of dollars being wiped out.
- 2019 was a very significant year for Chainlink. Its token LINK was performing very impressively in the market. The performance is heavily associated with the pioneering DApps on the Chainlink network and listing by a few crypto exchanges, such as Bitbox, the previous year.
- This drove the LINK price from $0.3 at the beginning of the year to a record $1.13 by May 2019. The oracle coin broke its ATH twice that year, and on June 24, 2019, LINK’s price reached a record $4.540. The release of the Chainlink network on the Ethereum main network heavily drove the bullish rally.
- In 2020, the Chainlink project emerged as the top performer of all cryptocurrencies, beating significant cryptocurrencies like Bitcoin and Ethereum for the second year. Bitcoin price The massive rally was heavily connected to the 2020 DeFi craze.
- LINK began trading at around $1.70 and hiked toward $4.570 in February. It remained quiet until mid-July when the price rallied toward a new ATH at $8.40. The rally continued, and Chainlink’s digital asset price almost hit $20 but faced rejection and pulled back to under $12.
- In 2021, Chainlink’s price enjoyed a strong bull run, as wavelike bullish activity caused the price to rise from $12.00 to recent highs of $36.00.
- Chainlink’s price faced strong resistance at the $36 mark, which it could not break through and was rejected. The rejection caused the price to fall to $23.50 before it bounced back to the $30 support level.
- Afterward, the coin reached its all-time high of $52.88 in May and started falling. The fall in the price of Bitcoin affected Chainlink until it was $30.
- Chainlink’s price trend was upward between May and June. For the year, it registered its highest price at $18.44.
0
0

 Manage all your crypto, NFT and DeFi from one place
Securely connect the portfolio you’re using to start.


