
Venice Token Price Prediction: Can VVV Keep Its 100% Monthly Run?

0
0
VVV keeps climbing in big steps rather than small ones, and every new high raises the same question about how long buyers can stay in control.
This Venice Token price prediction weighs whether the run has more room or the market is due to breathe.
What Is the VVV Price Today After a 20% Jump?
According to Coinglass, Venice Token trades near $32.56, up over 20% in 24 hours.
The VVV market cap stands at $1.56 billion, with a VVV circulating supply of 48.39 million against a total supply of 81.01 million.
VVV trading volume is derivatives-led, as $279.71 million in futures dwarfs $76.46 million in spot over the same 24 hours.
Are Short Liquidations Fueling the VVV Rally?
Coinglass shows 51.72% over seven days, 103.62% over 30 days, and 417.20% over 180 days, so this is a trend and not a single spike.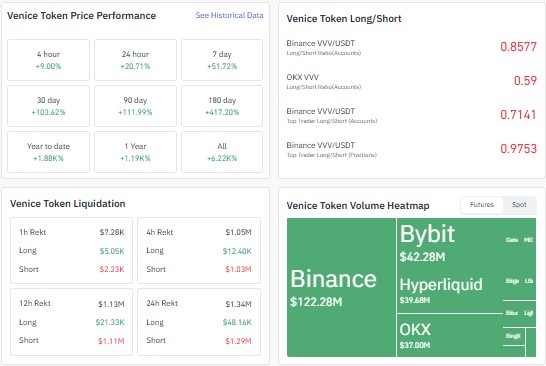
The Binance account long-short ratio reads 0.8577, OKX sits at 0.59, and Binance top traders show 0.7141 by accounts, all below one, though top trader positions are near balance at 0.9753.
Of $1.34 million in 24-hour liquidations, $1.29 million hit shorts, which fits a short squeeze.
As those bets close, the squeeze fuel thins.
Is VVV Open Interest Warning of a Leverage-Driven Run?
$VVV open interest has climbed to $198.29 million per Coinglass, roughly four times the $45 million area of mid-August, mostly added around the September 9 surge.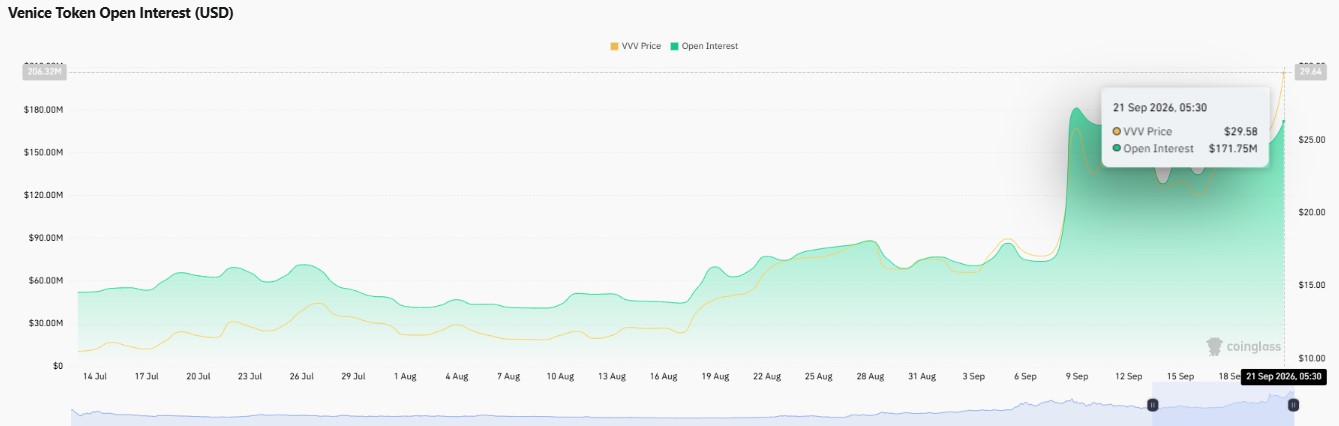
Rising open interest beside rising price usually means fresh positions are entering, not old ones closing.
With futures volume running about 3.7 times spot, leverage looks like the main engine, and that cuts both ways if momentum stalls.
How Risky Is Whale Concentration in Venice Token?
Holder distribution data looks top-heavy. The top 100 concentration reads 97.96%, the top five wallets hold 87.09% of market cap, and eight holders own at least 1% of supply each.
The 66 whales make up just 0.04% of holders yet control 97.28% of market cap, with a Gini score of 0.9997.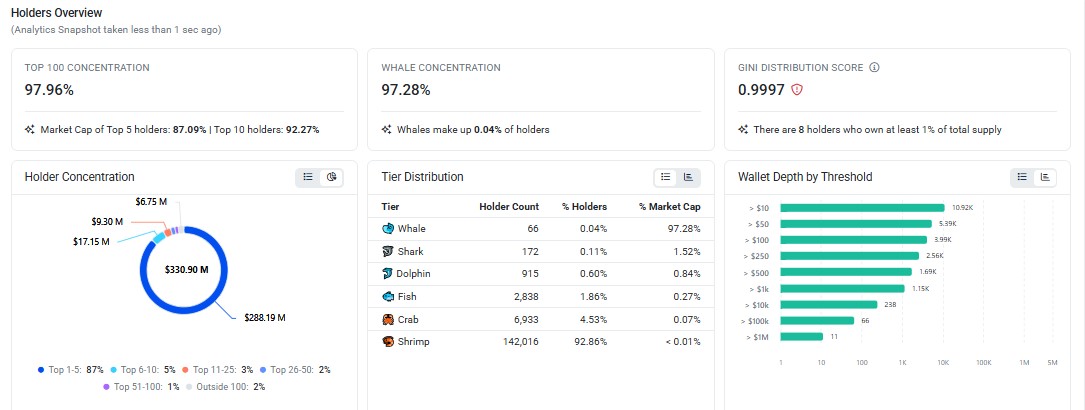
That level of whale concentration makes the Venice Token tokenomics profile fragile, since a few wallets can move the market quickly. Balances can be checked on Basescan.
Is the Venice Token Breakout Stretched Above the Upper Bollinger Band?
Per TradingView chart data for Venice Token against USD on Coinbase, the 4H chart began its run with a vertical jump on September 9, from the high teens to near 29.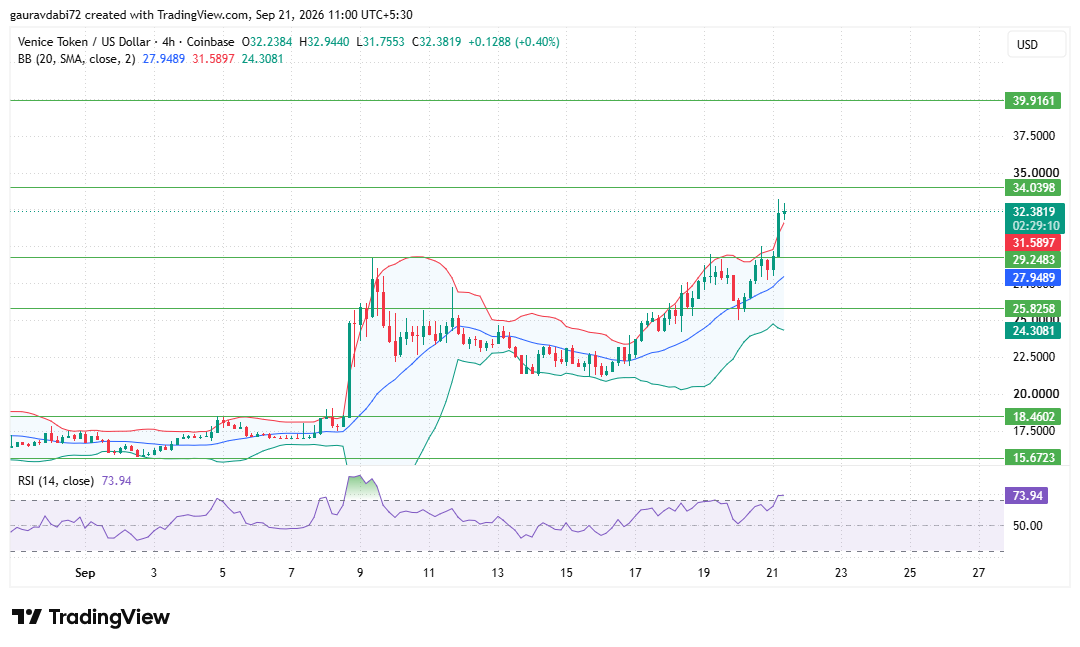
Price then churned between roughly 21 and 27 for about a week before buyers took charge again, pulled back around September 20, and printed a fresh higher high.
The current candle sits above the upper Bollinger Bands line at 31.59, with the middle band at 27.95 and the lower band at 24.31.
Riding above the upper band signals strong momentum, but it also stretches price away from its average, and RSI at 73.94 adds a mild overbought flag.
What Are the Next $VVV Support and Resistance Levels?
The VVV support and resistance levels are stacked clearly. Resistance starts at 34.0398, with 39.9161 above it if buyers keep pressing.
Support begins at 29.2483; the September 9 spike high that price has now reclaimed, then 25.8258 near the top of the mid-September range.
Deeper floors sit at 18.4602, the pre-jump base, and 15.6723.
Can VVV Hold Its Breakout or Is a Pullback Coming?
The Venice Token price prediction depends on whether 29.2483 keeps holding as support.
Above it, buyers keep the structure intact. Below it, the rally needs a deeper reset.
Scenario | Trigger | Key Levels |
Bullish | Price holds above 29.2483 and keeps closing above the upper Bollinger Band. | 34.0398, then 39.9161 |
Neutral | Price cools sideways while RSI resets. | Range between 29.2483 and 34.0398 |
Bearish | Squeeze fades, and price closes below 29.2483. | 25.8258, then 18.4602 and 15.6723 |
What Could Derail the Venice Token Rally?
Concentration is the biggest structural worry, since one large holder decision could outweigh weeks of retail buying.
A candle above the upper band can snap back toward the average, and leverage is doing much of the lifting.
Only 48.39 million of the 81.01 million total supply circulates, so future supply is another variable.
How Does the Analyst Desk Read the VVV Setup?
As per the CoinGabbar analyst desk, $VVV is trading on strength, though not on comfort.
A higher high, rising open interest, and squeezed shorts give the move real structure, yet ownership is so concentrated that every sharp candle deserves caution.
A hold above 29.2483 would keep buyers in charge, while a close beneath it would suggest the middle band region and possibly 25.8258 come into play.
Final Outlook: How Far Can VVV Run From Here?
The Venice Token price prediction stays bullish-leaning while the price holds above 29.2483, with 34.0398 and 39.9161 as the next resistance zones.
Overbought signals, thinning short fuel, and heavy concentration make volatility likely.
Disclaimer: This article is for informational purposes only and is not financial, investment, or trading advice. Crypto prices are highly volatile, so readers should assess their own risk before making any decision.
0
0

 从同一位置管理所有加密资产、NFT 和 DeFi 资产
安全地关联您正在使用的投资组合,以开始交易。