Is Bitcoin Forming a Base Below $60,000? Key Signals to Watch

0
0

Bitcoin price has been whipsawing between roughly $70,000 and $60,000 in recent weeks, leaving traders uncertain about where the next major move will emerge.
Insights from BeInCrypto’s Expert Council, which includes names connected to Standard Chartered and Kraken, suggest the market may be entering a stabilization phase rather than another collapse. While the recent cycle low sits near $60,000, on-chain data and market structure indicate the potential base could form around this region, though deeper downside remains possible if several key signals fail to improve.
Falling Volatility and Deleveraging Suggest Market Stress Is Cooling
One of the first clues analysts look for when a market begins stabilizing is declining volatility. When volatility begins to fall, it often signals that selling pressure is slowing and the market may start forming a base.
Bitcoin’s annualized realized volatility surged to roughly 93.2% in June 2022, during the height of one of the previous bear markets.
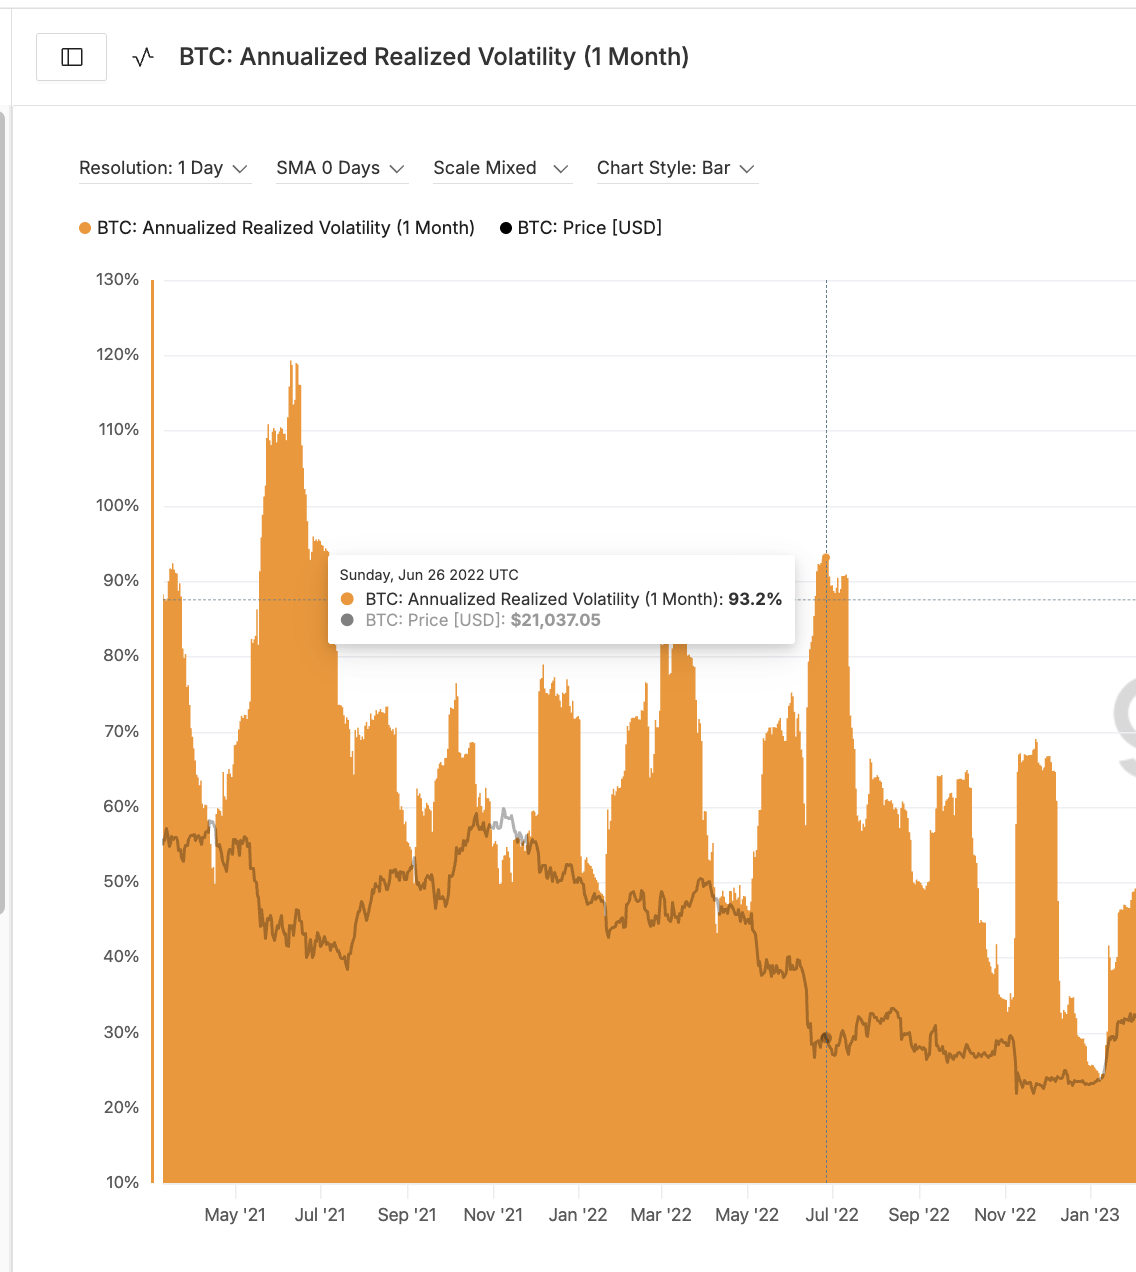 BTC Volatility 2022: Glassnode
By contrast, volatility dropped as low as 25.8% in mid-January 2026. Even though volatility has since climbed back toward the 60% range, the earlier compression indicates that extreme panic conditions have largely faded, if we compare it with the more aggressive bear market scenarios.
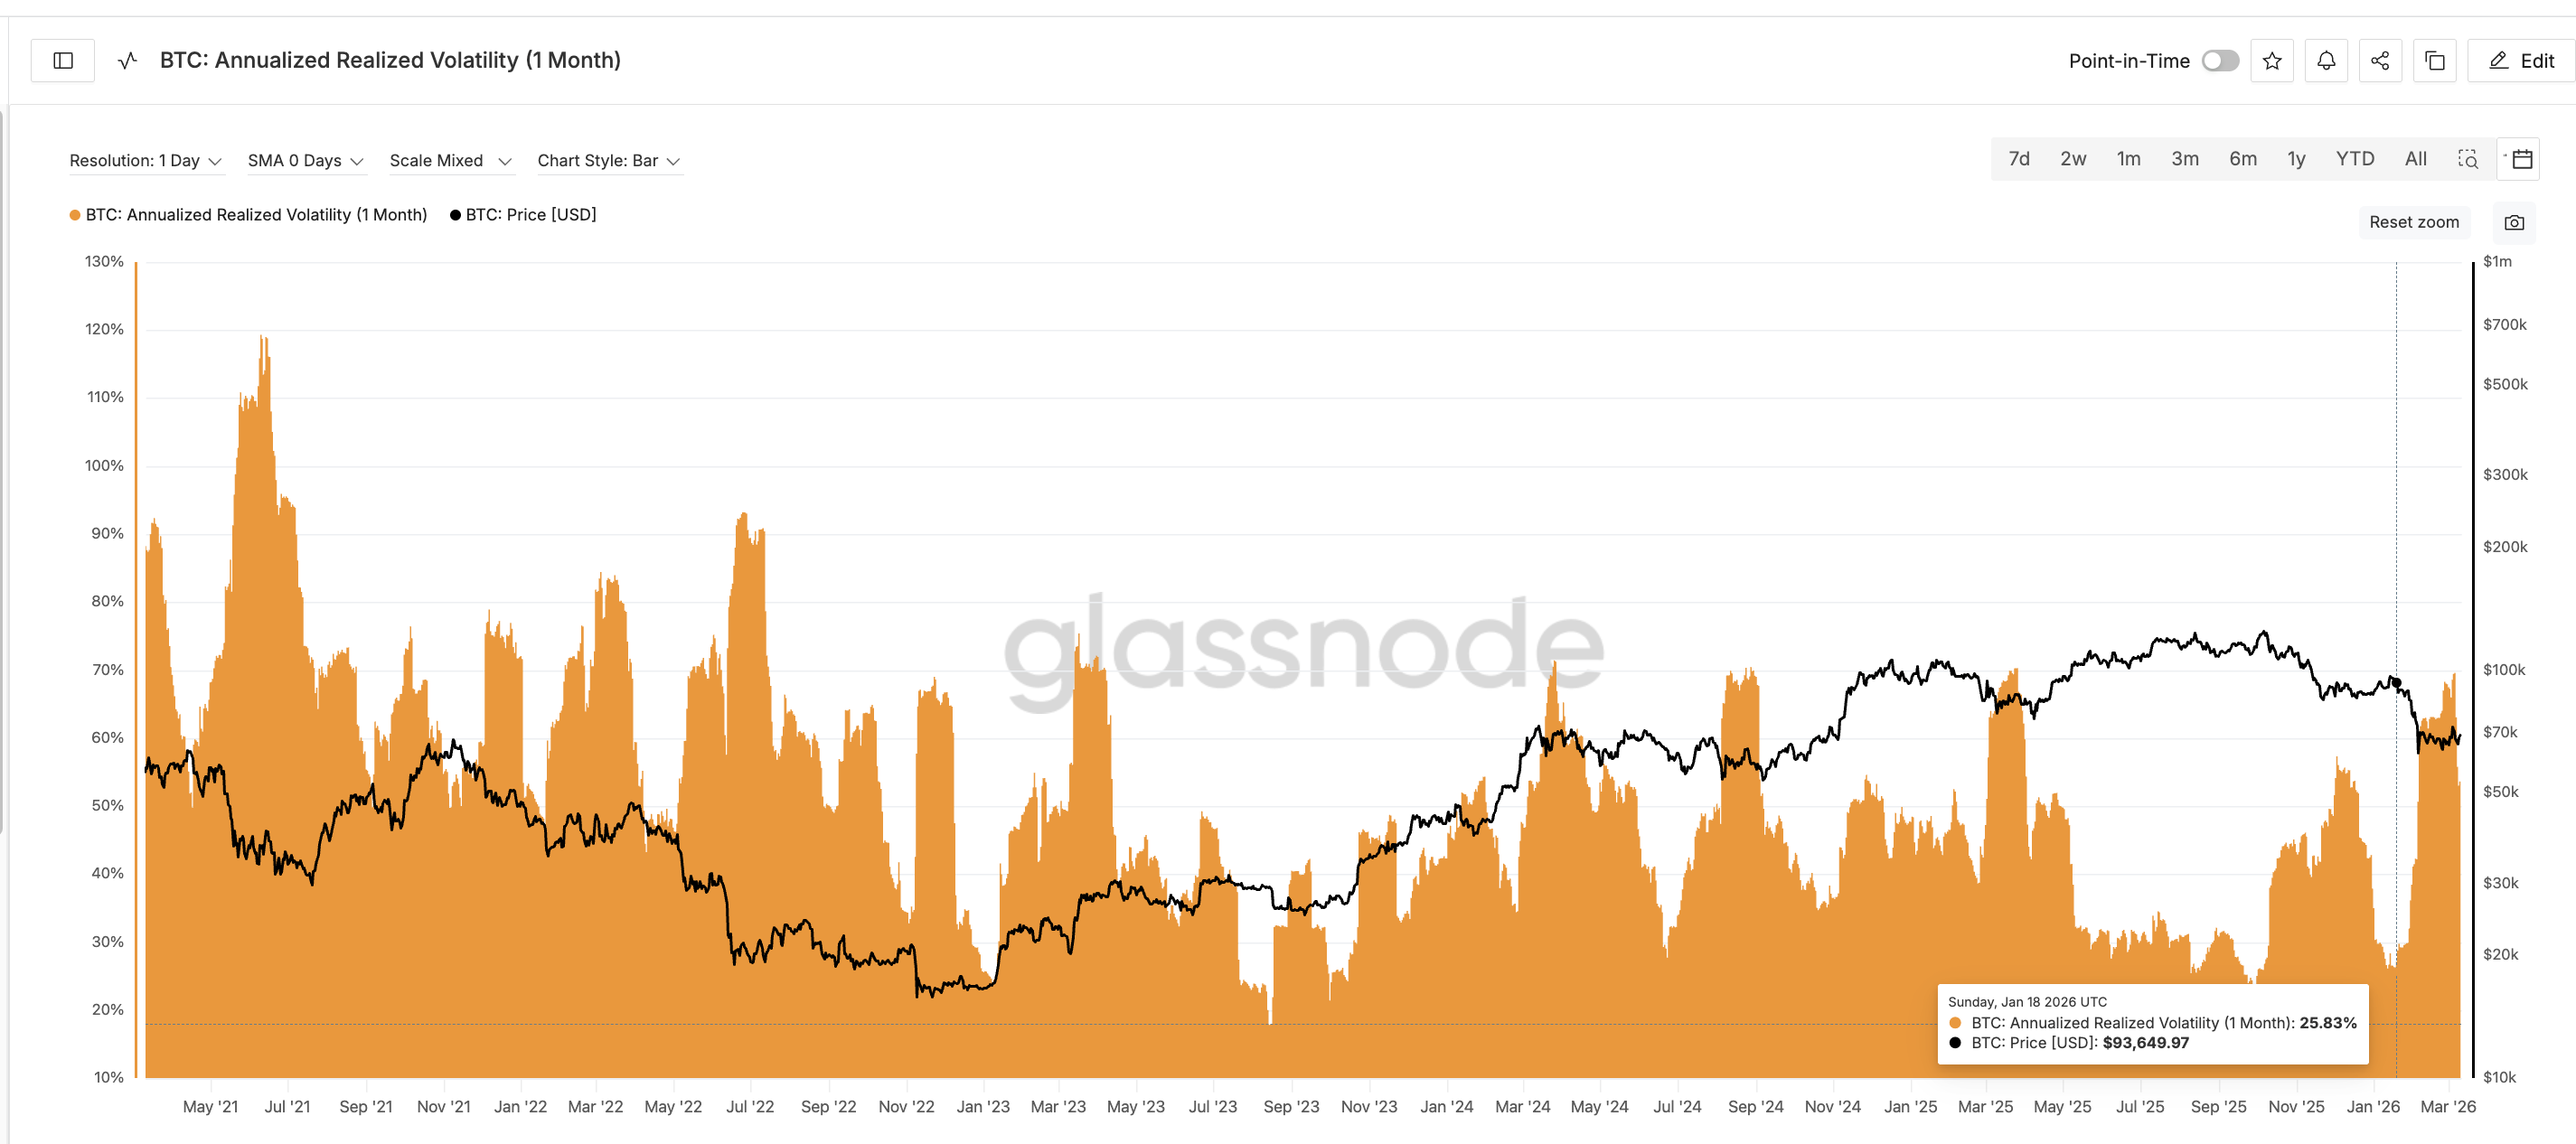 BTC Volatility 2026: Glassnode
Michael Walsh, chair of a Standard Chartered subsidiary and a Kraken entity, recently highlighted this dynamic.
“Realized volatility is kind of bumping along the bottom really compared to where it has been over the last four years.”
Also, even if we track the historical ‘Realized Volatility’ data (first image), we see that the metric dropped as the bear market base strengthened. The same can be said for now.
Another signal pointing to improving market conditions is the decline in derivatives leverage.
During the 2022 market bottom formation phase, Bitcoin derivatives open interest reached roughly $33 billion. Today, it sits closer to $22.6 billion.
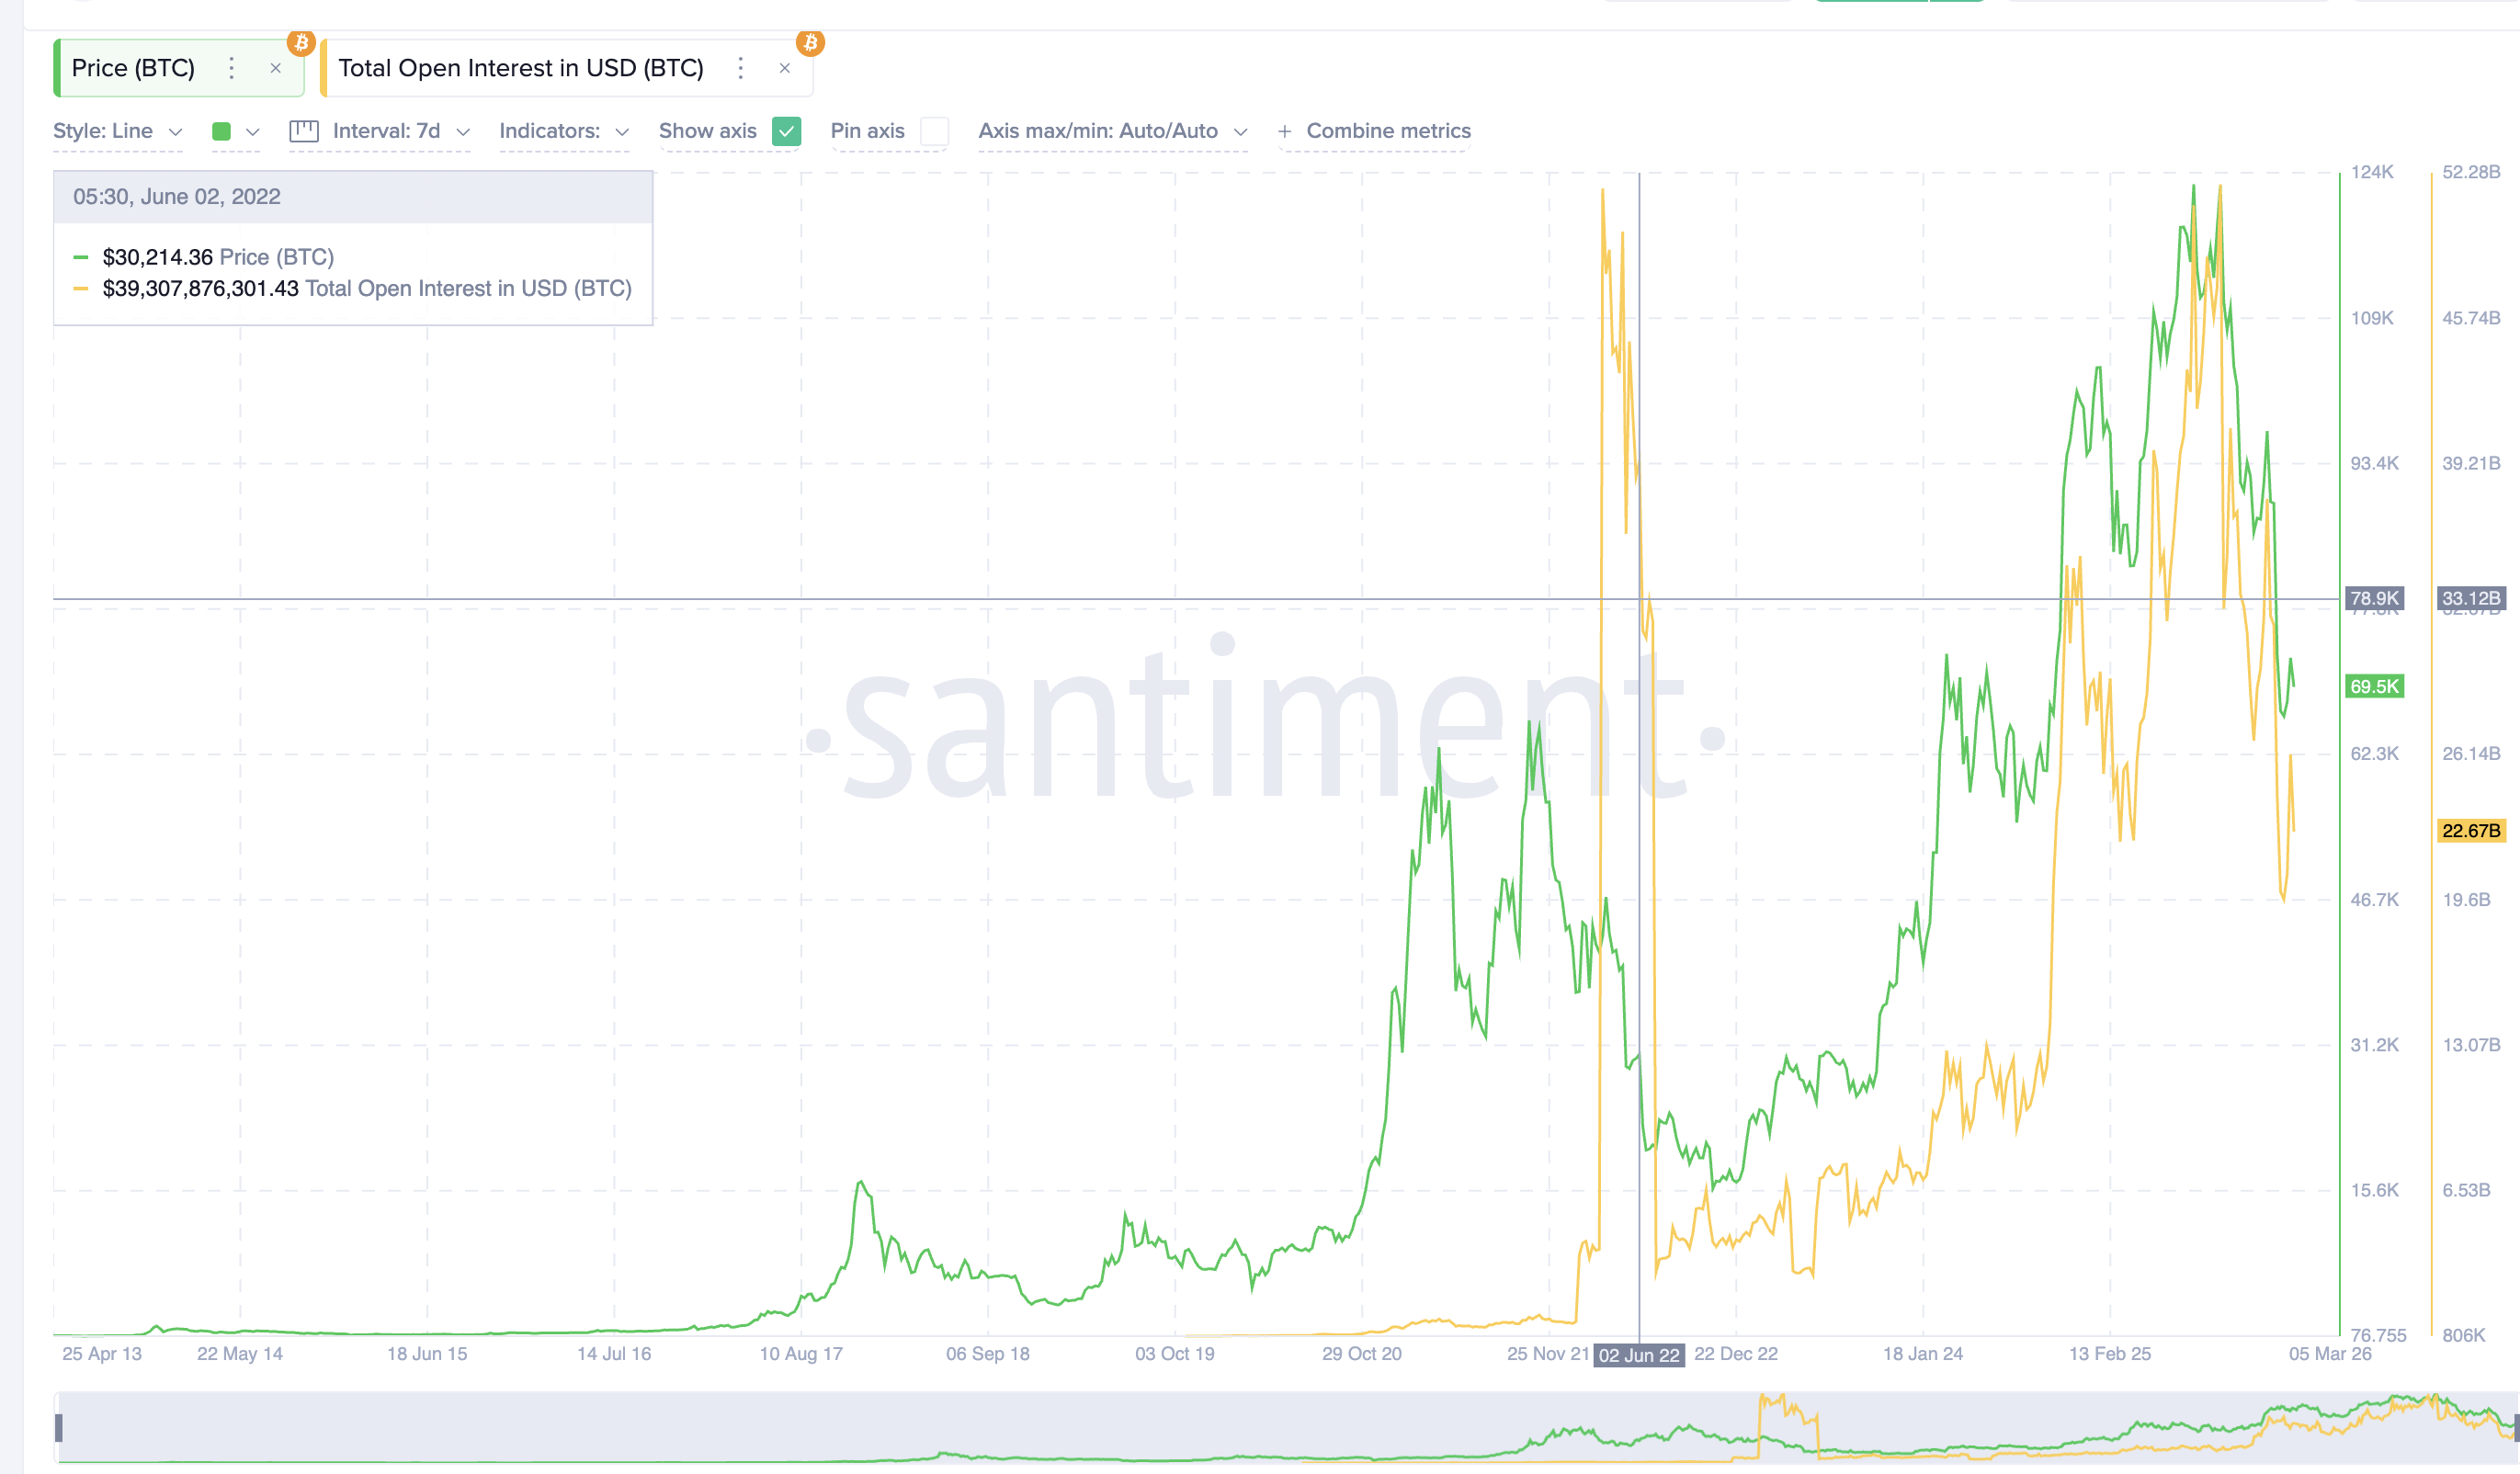 BTC OI: Santiment
The leverage reset, not just relative to the recent levels, becomes even clearer when examining exchange leverage ratios.
According to CryptoQuant, Bitcoin’s estimated leverage ratio on Binance has dropped from 0.198 to 0.152 since February, representing a sharp decline in speculative positioning.
These types of leverage resets usually occur when liquidations force leveraged traders out of the market. While this process can be painful in the short term, it often stabilizes prices by removing excessive speculation.
Taken together, declining volatility and falling leverage suggest that the market may be transitioning away from panic conditions and toward a stabilization or a ‘base forming’ phase.
Realized Price Reveals Where Structural Support Could Appear
Another critical metric analysts watch when searching for market bottoms is Bitcoin’s realized price. Realized price represents the average price at which all Bitcoin in circulation last moved on-chain. In simple terms, it estimates the average cost basis of the entire network.
Bitcoin’s realized price currently sits near $55,000 ($54,465 to be exact).
Historically, when Bitcoin declines toward this level, the market often begins attracting buyers because many investors are approaching their average entry price. As a result, the realized price frequently acts as a long-term equilibrium level where demand begins returning.
Want more token insights like this? Sign up for Editor Harsh Notariya’s Daily Crypto Newsletter here.
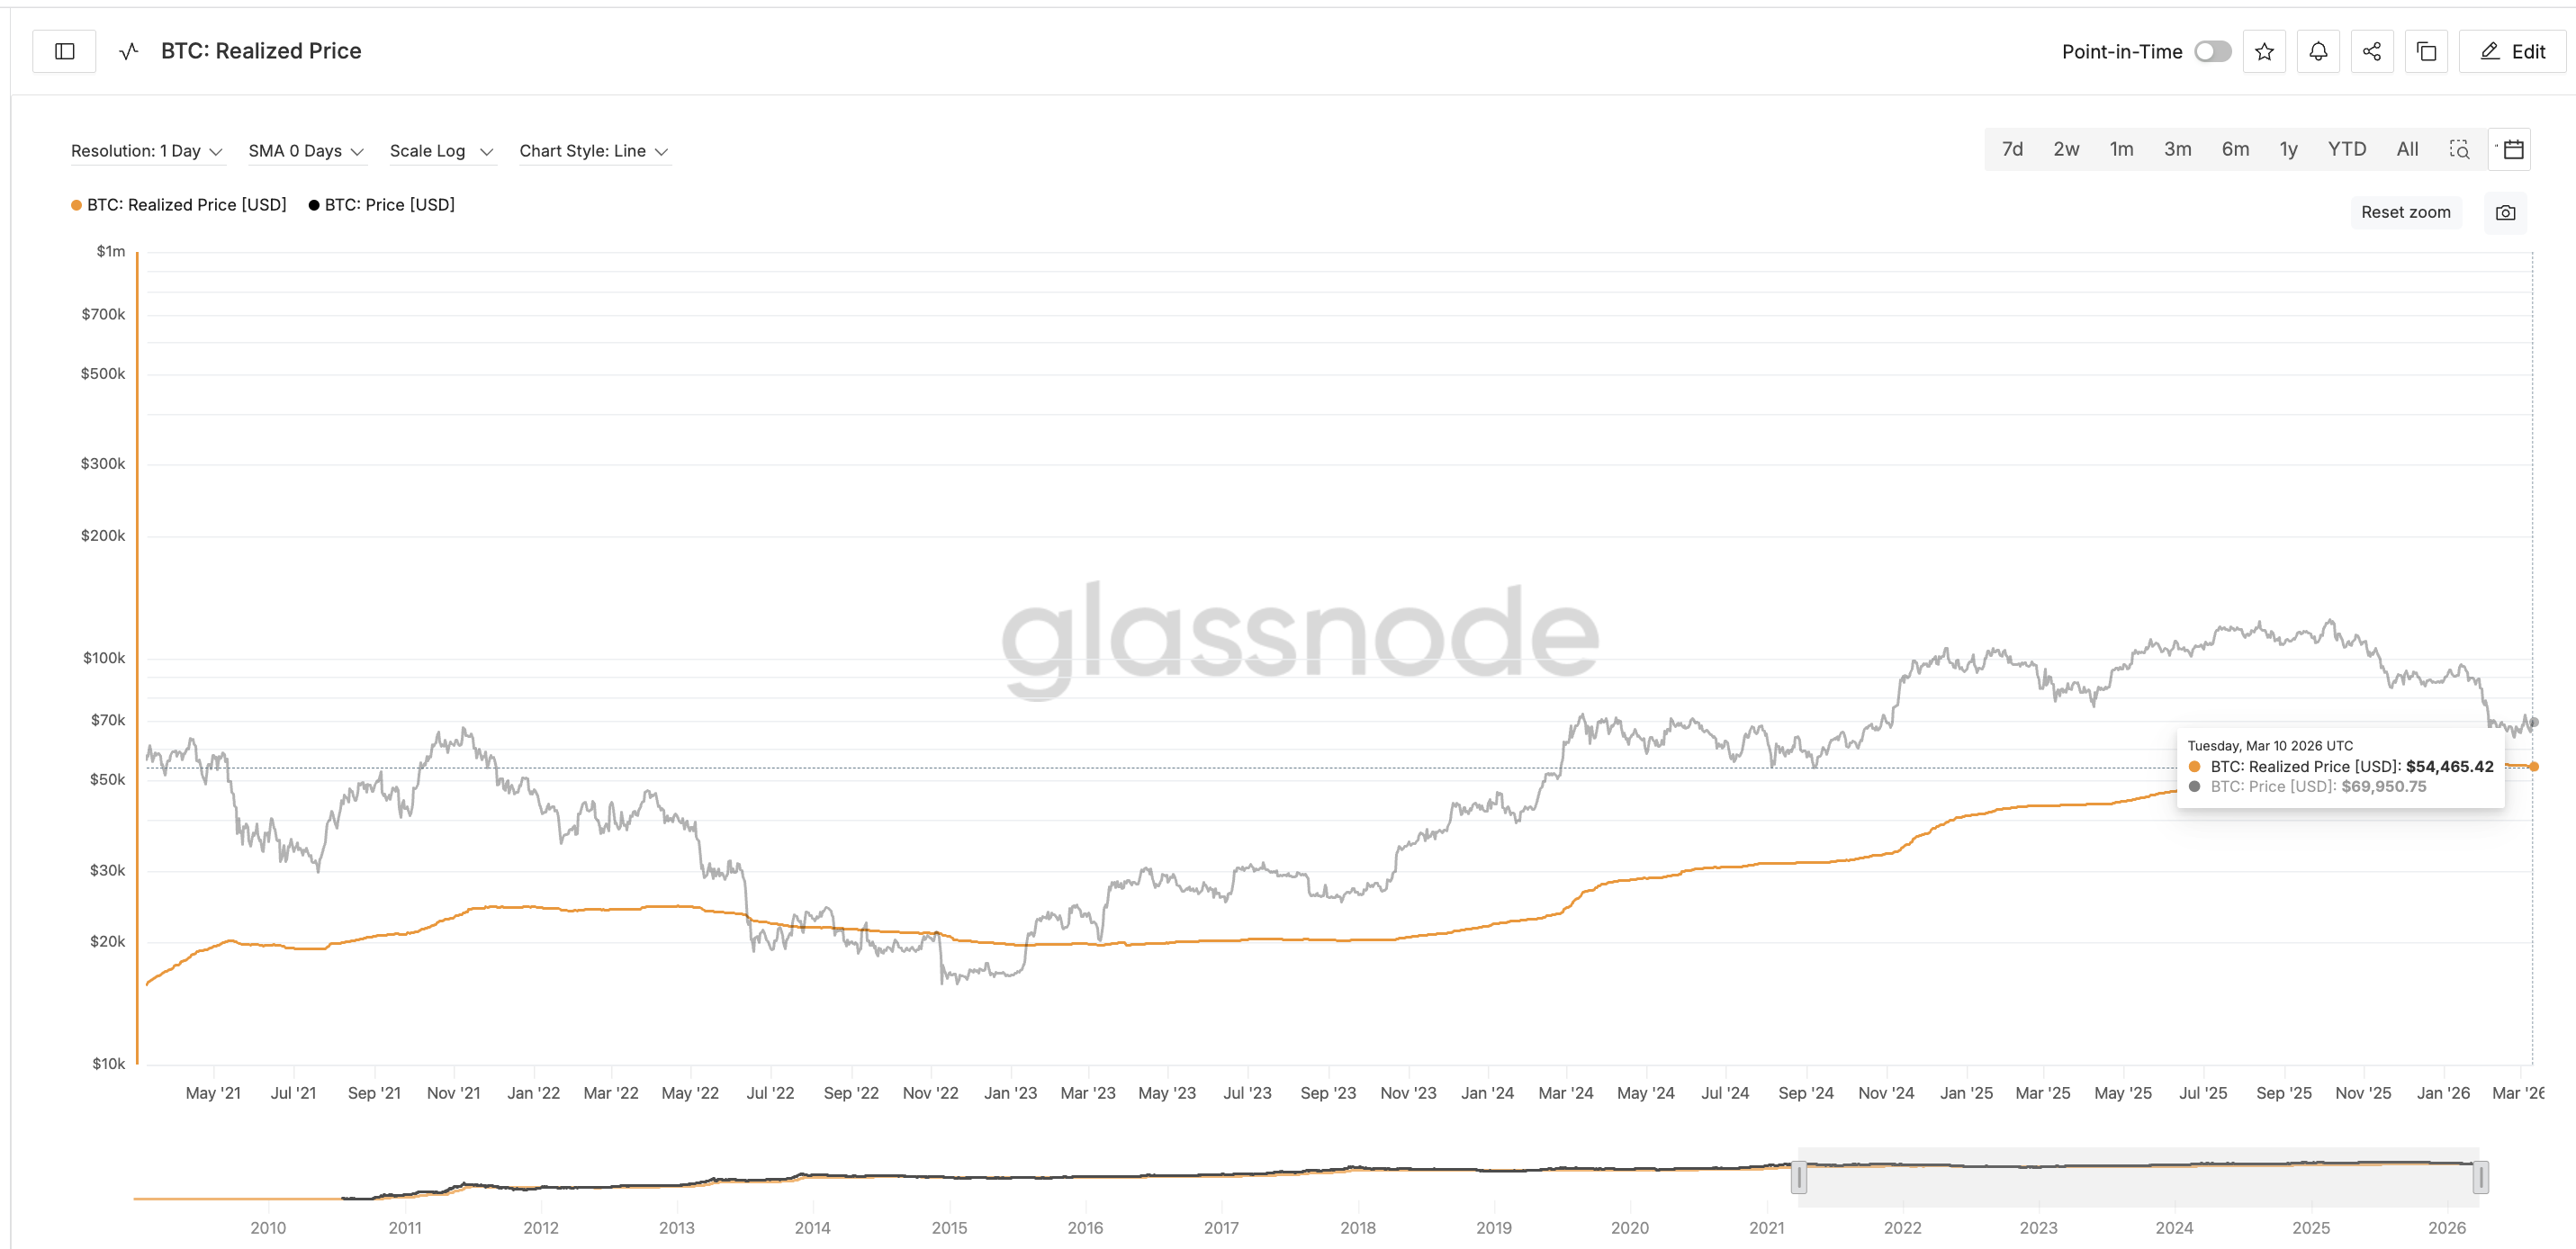 Realized Price: Glassnode
If the current psychological $60,000 support zone breaks, the region between $55,000 and $50,000 could become the next area where structural demand appears.
However, realized price alone does not determine bottoms. Investor behavior, particularly among long-term holders, provides another important signal.
Long-Term Holder Behavior Shows Accumulation Has Only Just Begun
Long-term holders are conviction-led investors who typically keep their Bitcoin for more than 365 days (not just 155 days like standard hodlers).
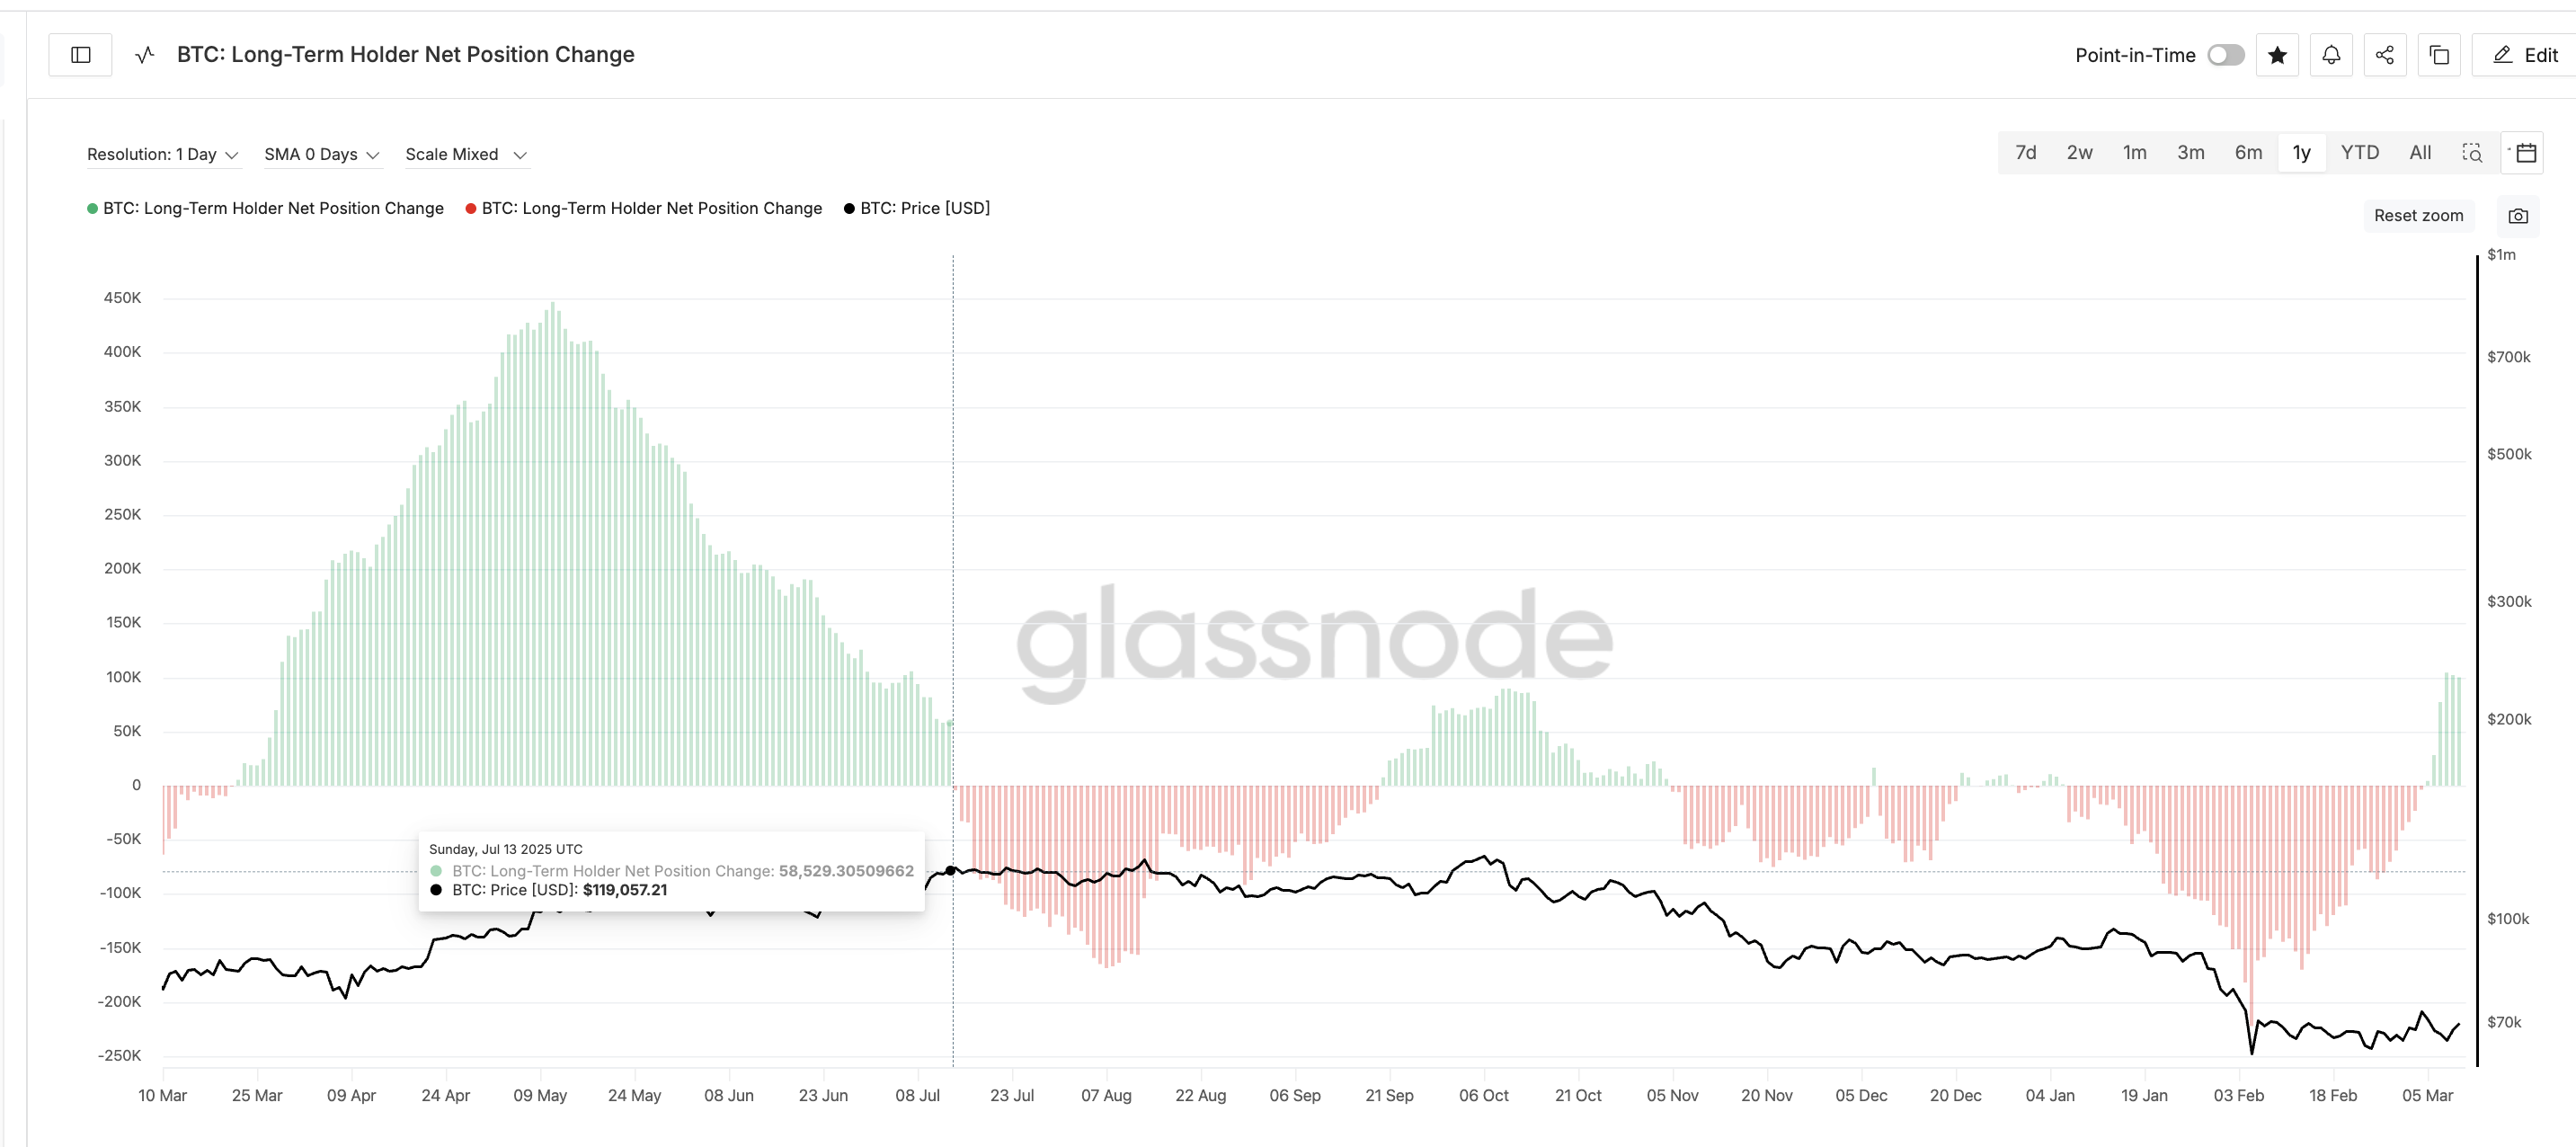
One key metric used to track this activity is the long-term holder net position change indicator. This measure shows whether long-term investors are increasing their Bitcoin holdings or reducing them. Over the past three months, the indicator has remained mostly negative, meaning long-term holders were still distributing coins during the correction.
Recently, however, small green spikes have begun appearing. These indicate that long-term holders have started slowly accumulating again. While this is an encouraging signal, the scale of accumulation remains relatively small compared with previous cycles.
 LTH Pattern: Glassnode
Historically, powerful rallies tend to begin only after sustained accumulation phases from long-term holders. One example occurred between May and July 2025, when strong accumulation preceded Bitcoin’s explosive rally later that year.
This aligns with the bigger takeaway highlighted at BeInCrypto’s Expert Council discussion, where Geoff Kendrick, Global Head of Digital Asset Research, Standard Chartered, and Michael Walsh mentioned the gradual return of investor confidence as one base case for BTC’s ‘base formation’.
Another metric helps identify the price level where long-term investors typically begin defending the market.
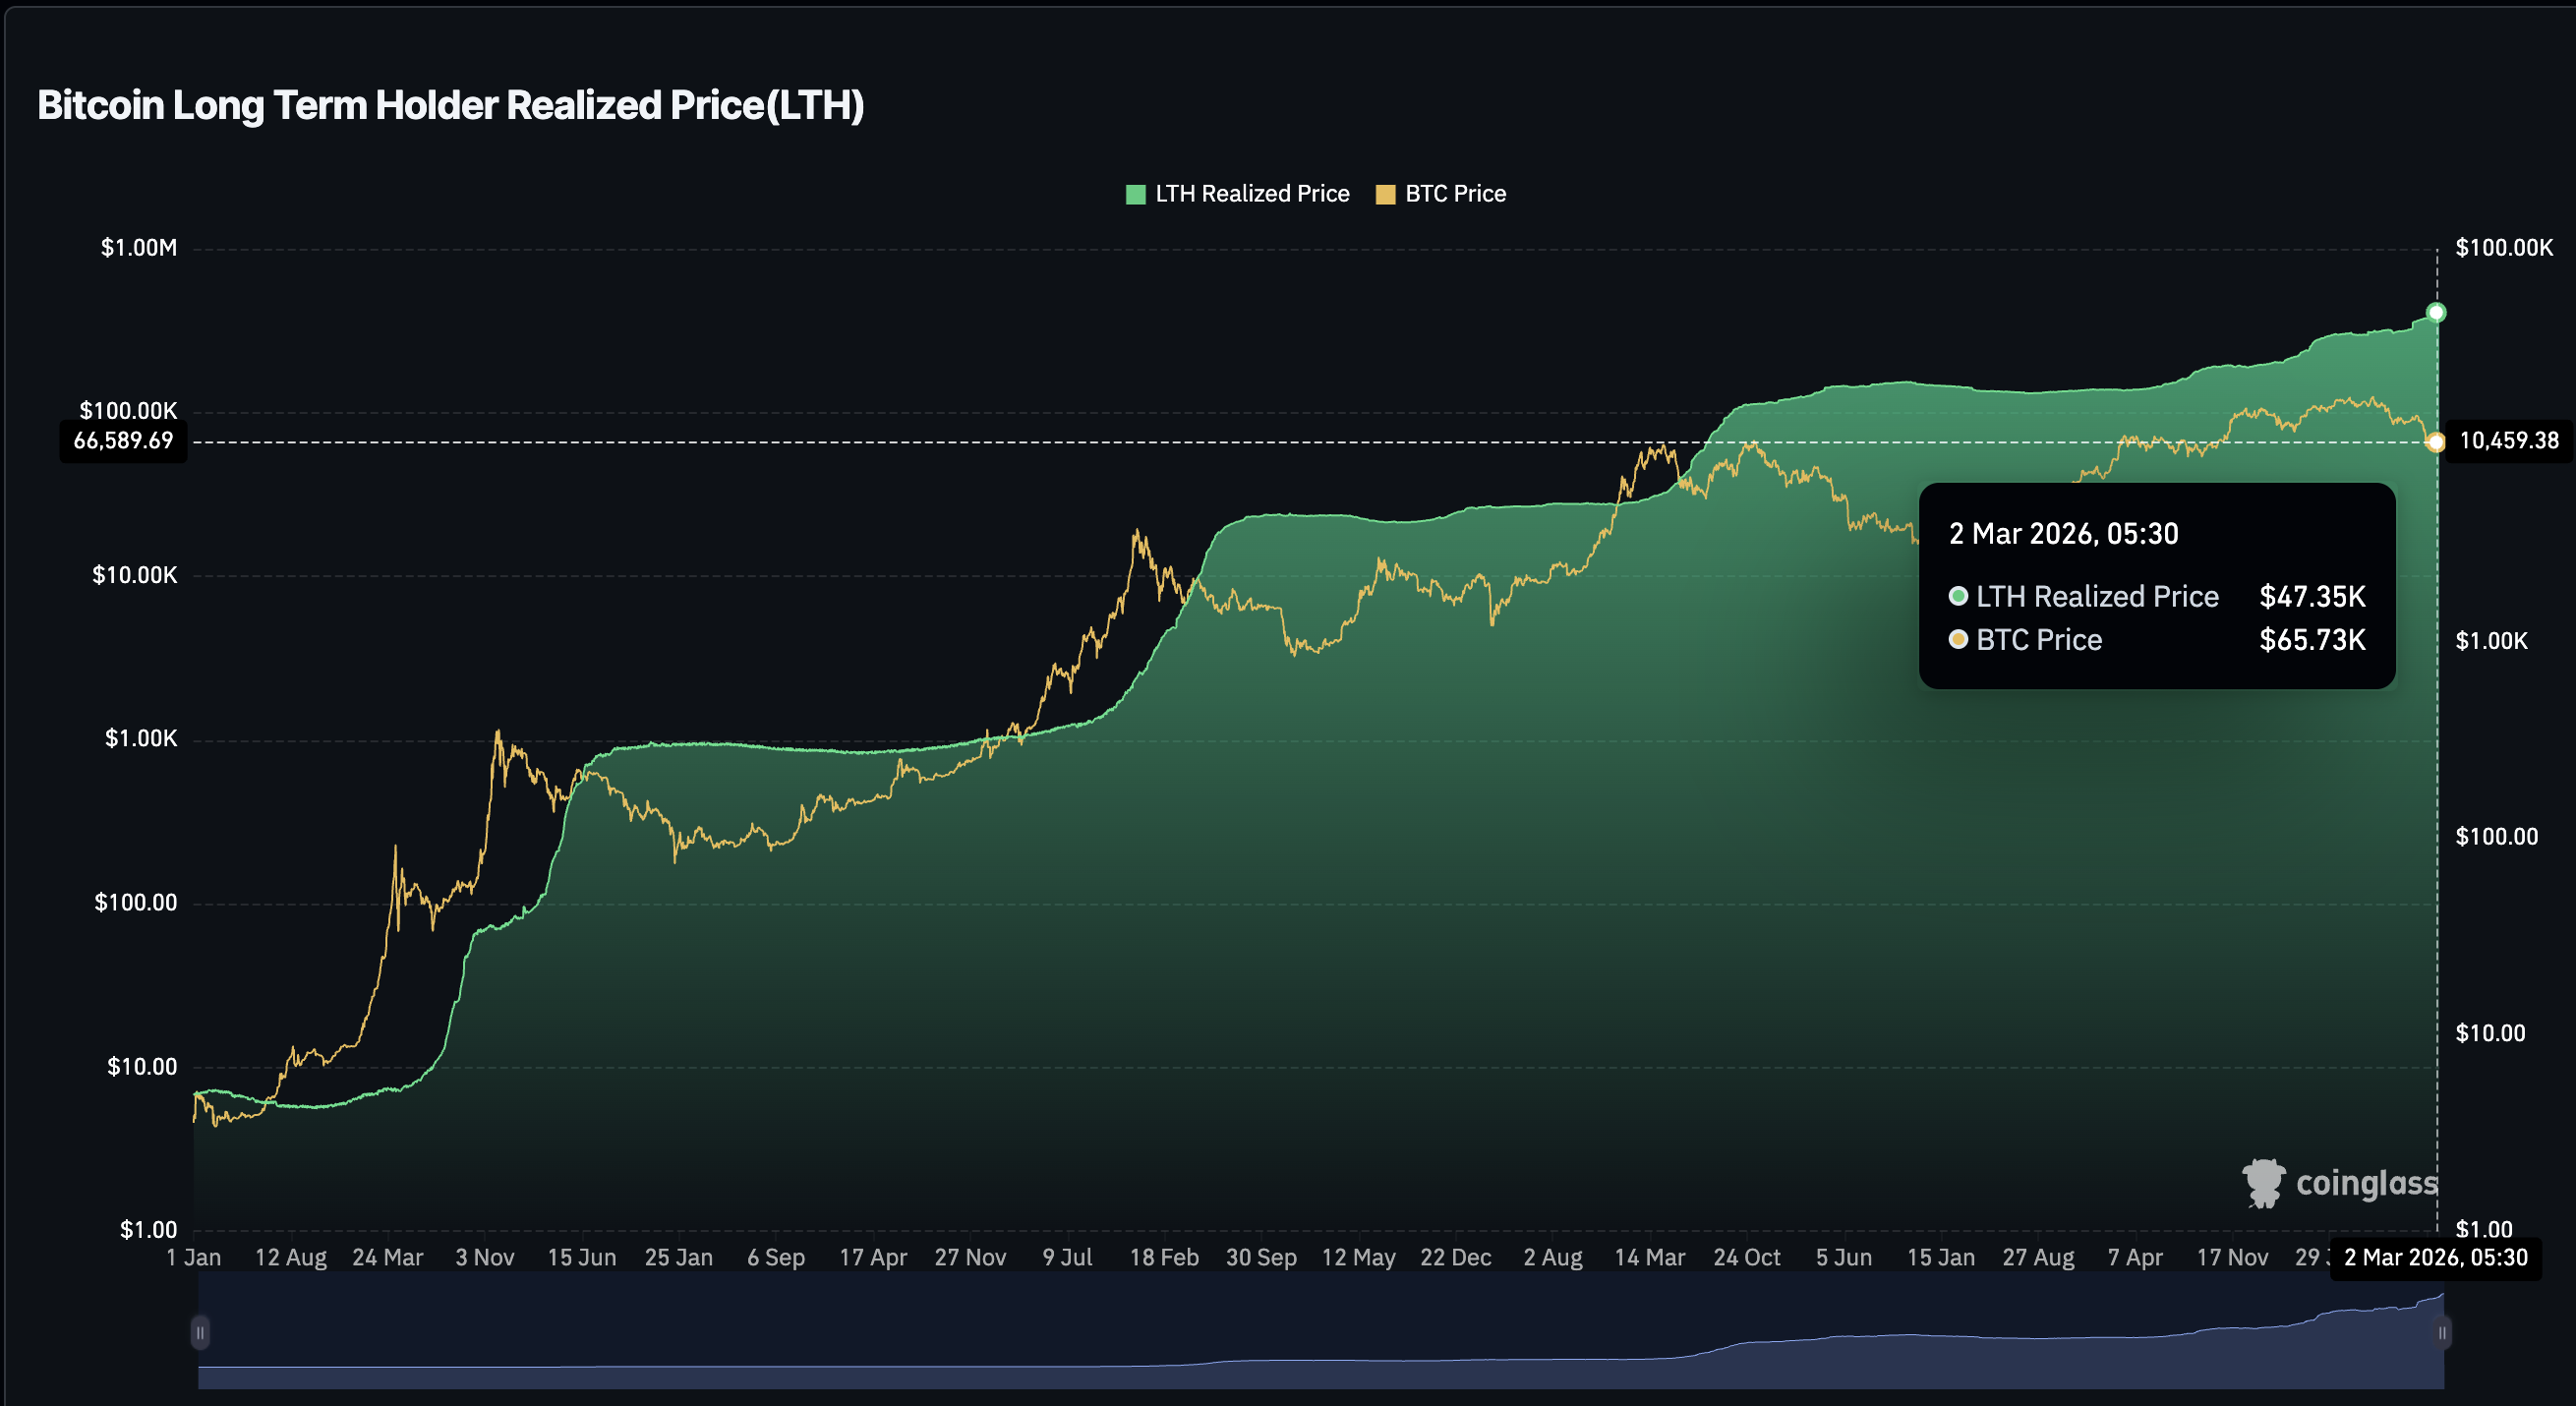
This indicator is known as the long-term holder realized price, which estimates the average cost basis specifically for coins held by long-term investors. Currently, this level sits near $47,000.
When Bitcoin approaches this region, long-term holders historically begin accumulating aggressively, as prices approach their average purchase levels.
 LTH Realized Price: Coinglass
Interestingly, the earlier leverage reset may also help explain why accumulation is slowly returning. As derivatives leverage declines and volatility compresses, the market becomes less dominated by speculative traders and more attractive for long-term investors looking to rebuild positions.
ETF Flows and Sentiment Will Decide Whether a True Base Forms
Institutional demand could ultimately determine whether Bitcoin forms a base or continues declining, as highlighted in the Expert Council discussion. One of the clearest ways to track institutional activity is through spot Bitcoin ETF flows.
ETF flows show a clear pattern around previous turning points.
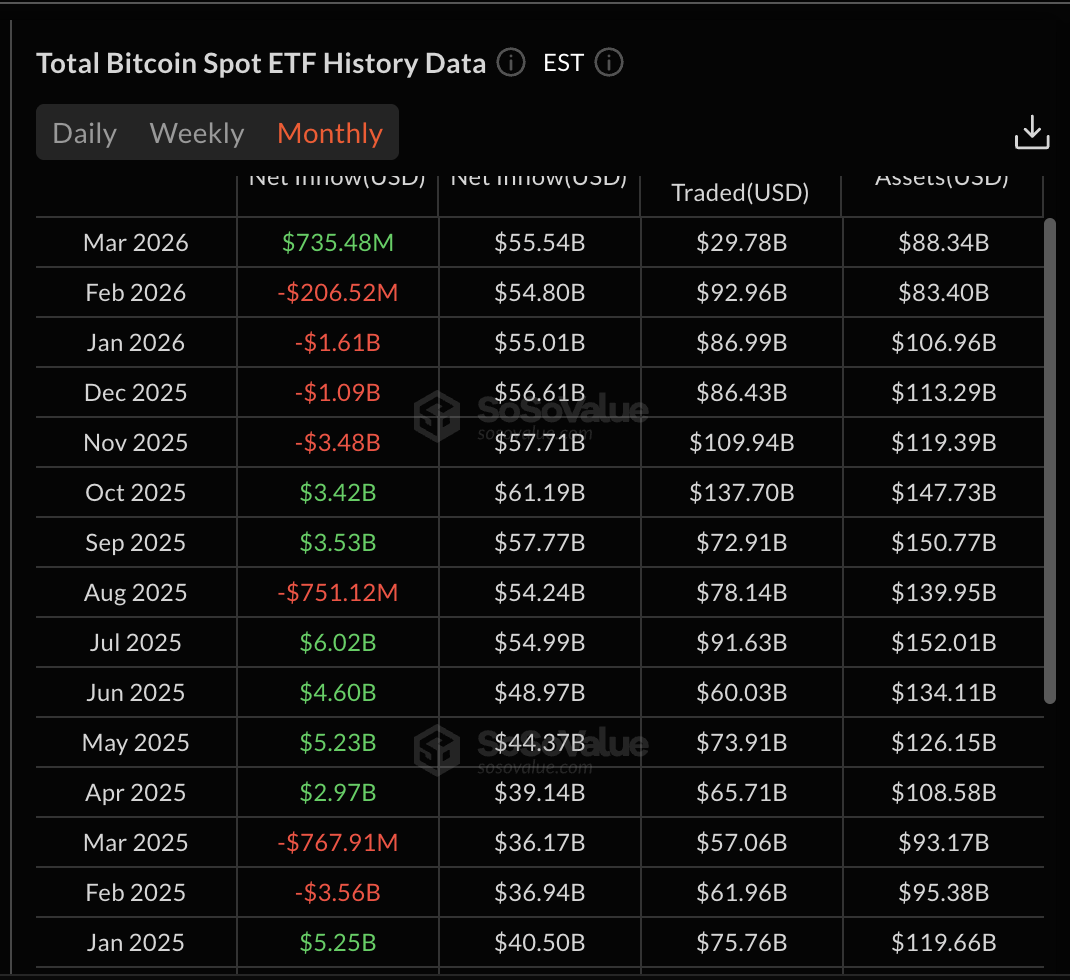
Before the April 2025 market bottom, Bitcoin experienced heavy ETF outflows during February and March. However, inflows began returning in April and continued through several months, helping confirm the recovery. The current cycle shows a similar pattern.
Bitcoin ETFs experienced four consecutive months of outflows from November 2025 through February 2026. These sustained outflows reflected weakening institutional demand during the correction.
 Bitcoin ETFs: SoSo Value
However, March has already recorded roughly $735 million in inflows, suggesting that institutional investors may be gradually returning to the market. If inflows continue through the rest of the month, it could signal that the market is entering the early stages of base formation.
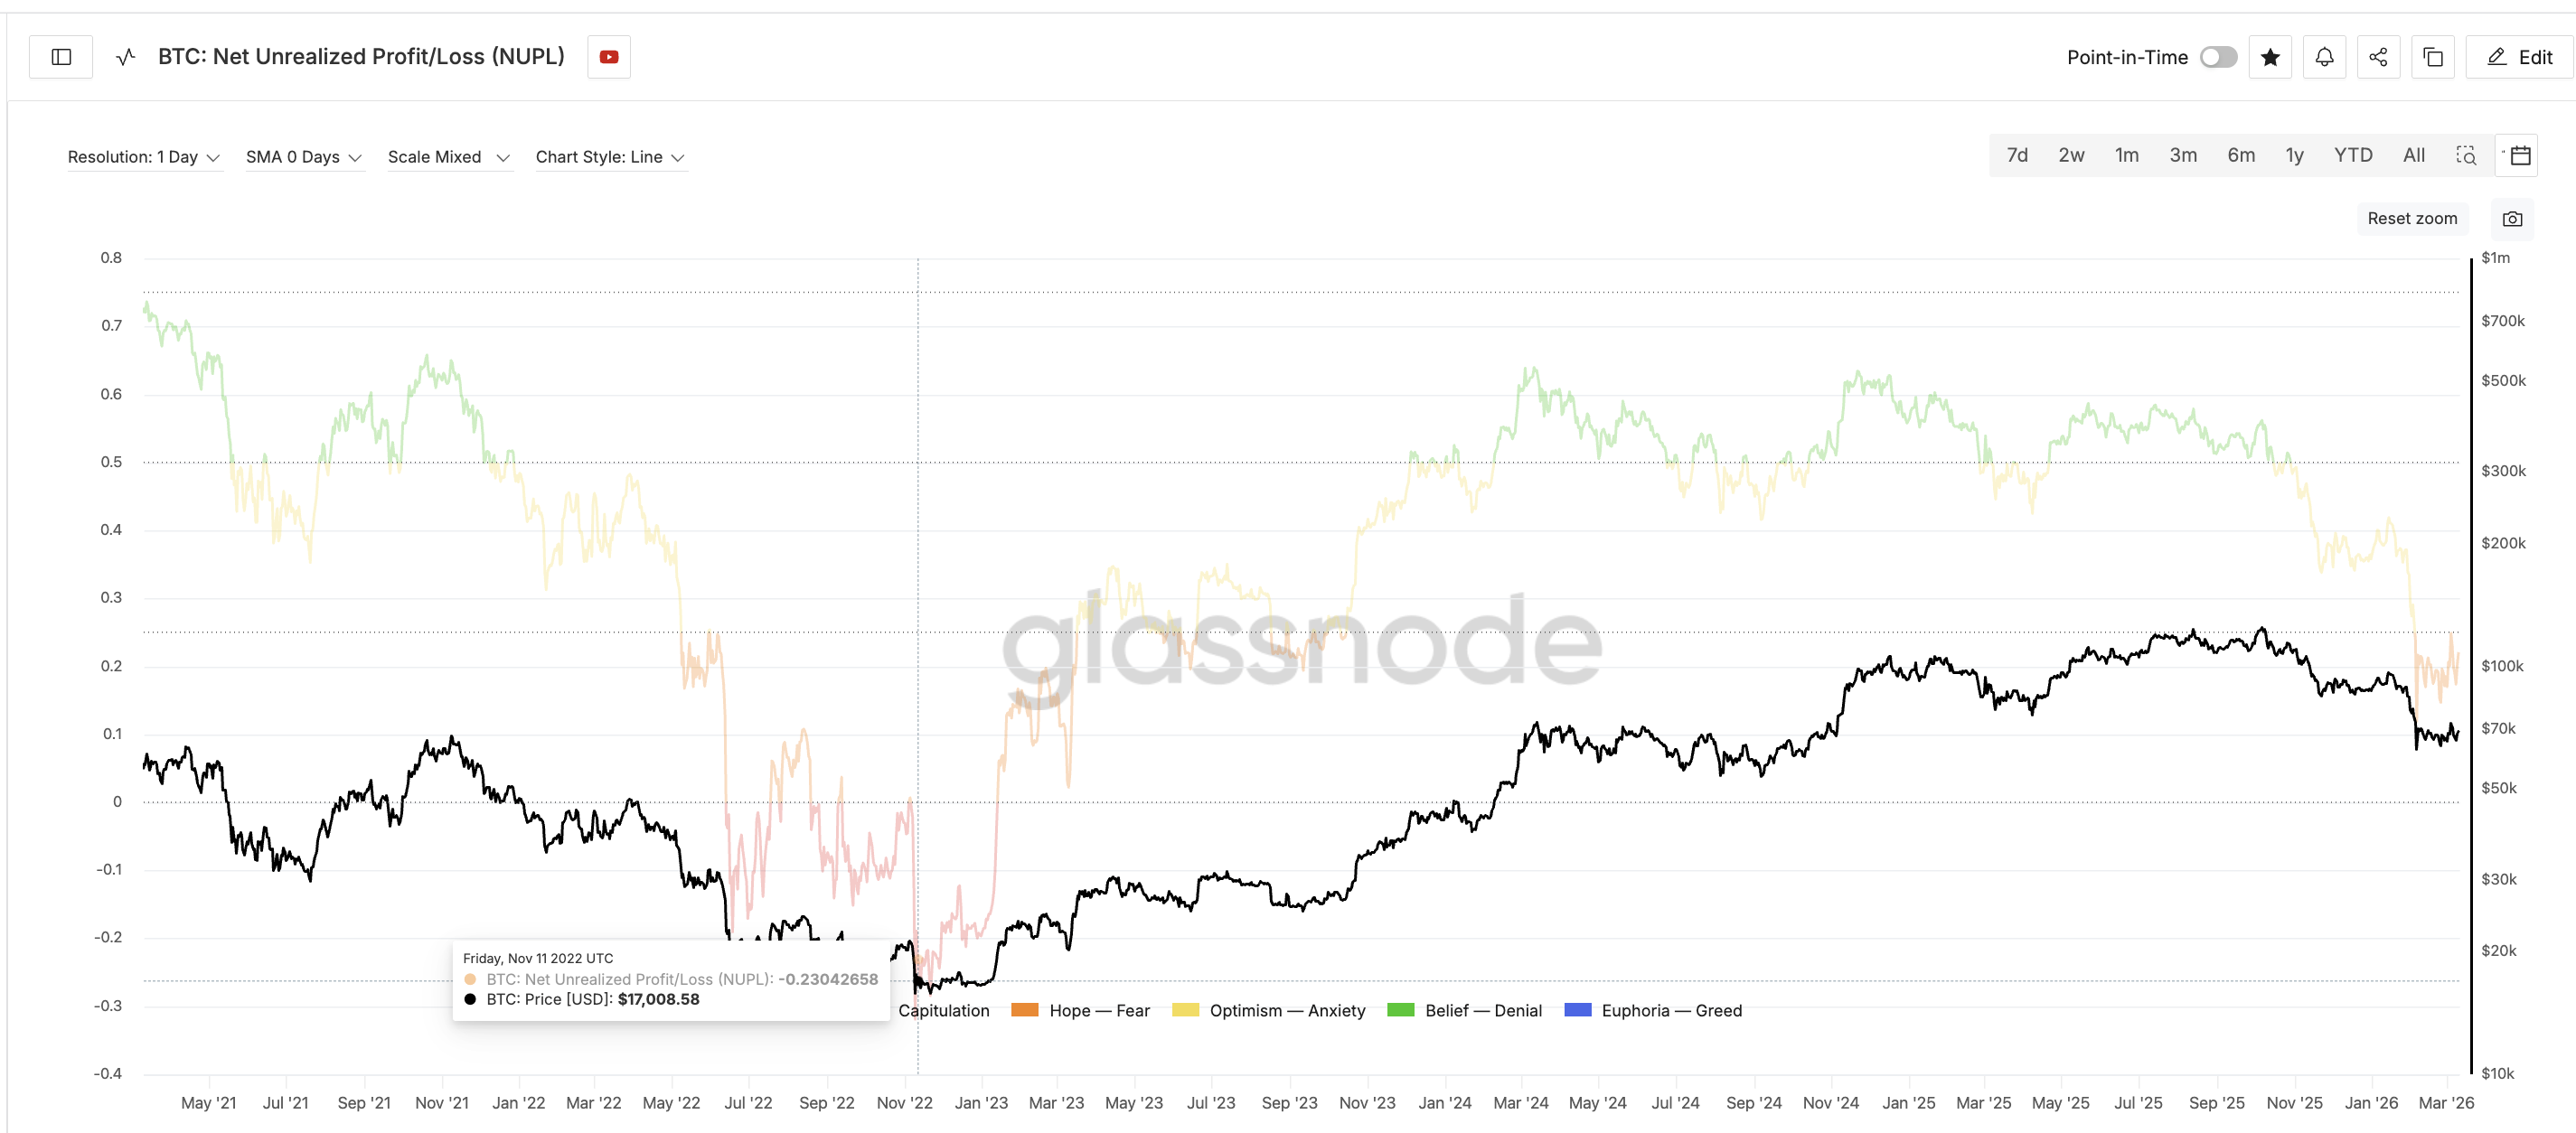
Investor sentiment metrics offer additional insight. One widely used metric is Net Unrealized Profit/Loss (NUPL). This indicator measures the total unrealized profit across the Bitcoin network.
When NUPL is high, most investors are sitting on paper profits. When NUPL turns negative, the market enters capitulation because most holders are underwater. Bitcoin’s NUPL currently sits near 0.22, placing the market in what analysts call the hope-fear zone.
This means investors still hold moderate unrealized profits, far from the deep capitulation levels seen during the 2022 bear market (timeline we earlier used as reference), when NUPL dropped below -0.23. Interestingly, the 2025 market bottom formed without deep capitulation, as NUPL remained around 0.42 before the rally began.
 NUPL Levels: Glassnode
If ETF inflows continue improving, Bitcoin may be able to form a base within the current sentiment zone rather than entering a full capitulation phase.
Bitcoin Price Structure Highlights the Critical Levels to Watch
While on-chain metrics provide context, the price chart ultimately defines the key levels investors must watch.
On the 3-day chart, Bitcoin recently completed a death cross, a technical signal that occurs when the 50-period exponential moving average (EMA) falls below the 200-period EMA, a trend-tracking indicator that gives greater weight to recent prices.
The EMA-led weakness coincides with Bitcoin’s growing correlation with technology stocks. This correlation was also highlighted by our experts.
Bitcoin’s relationship with the Invesco QQQ Trust (QQQ), which tracks the NASDAQ-100 and serves as a proxy for major tech stocks, recently climbed as high as 0.77 in late February. This suggests Bitcoin is still trading like a risk asset alongside growth equities. If tech stocks weaken due to macro pressures or geopolitical tensions, Bitcoin could face similar short-term headwinds.
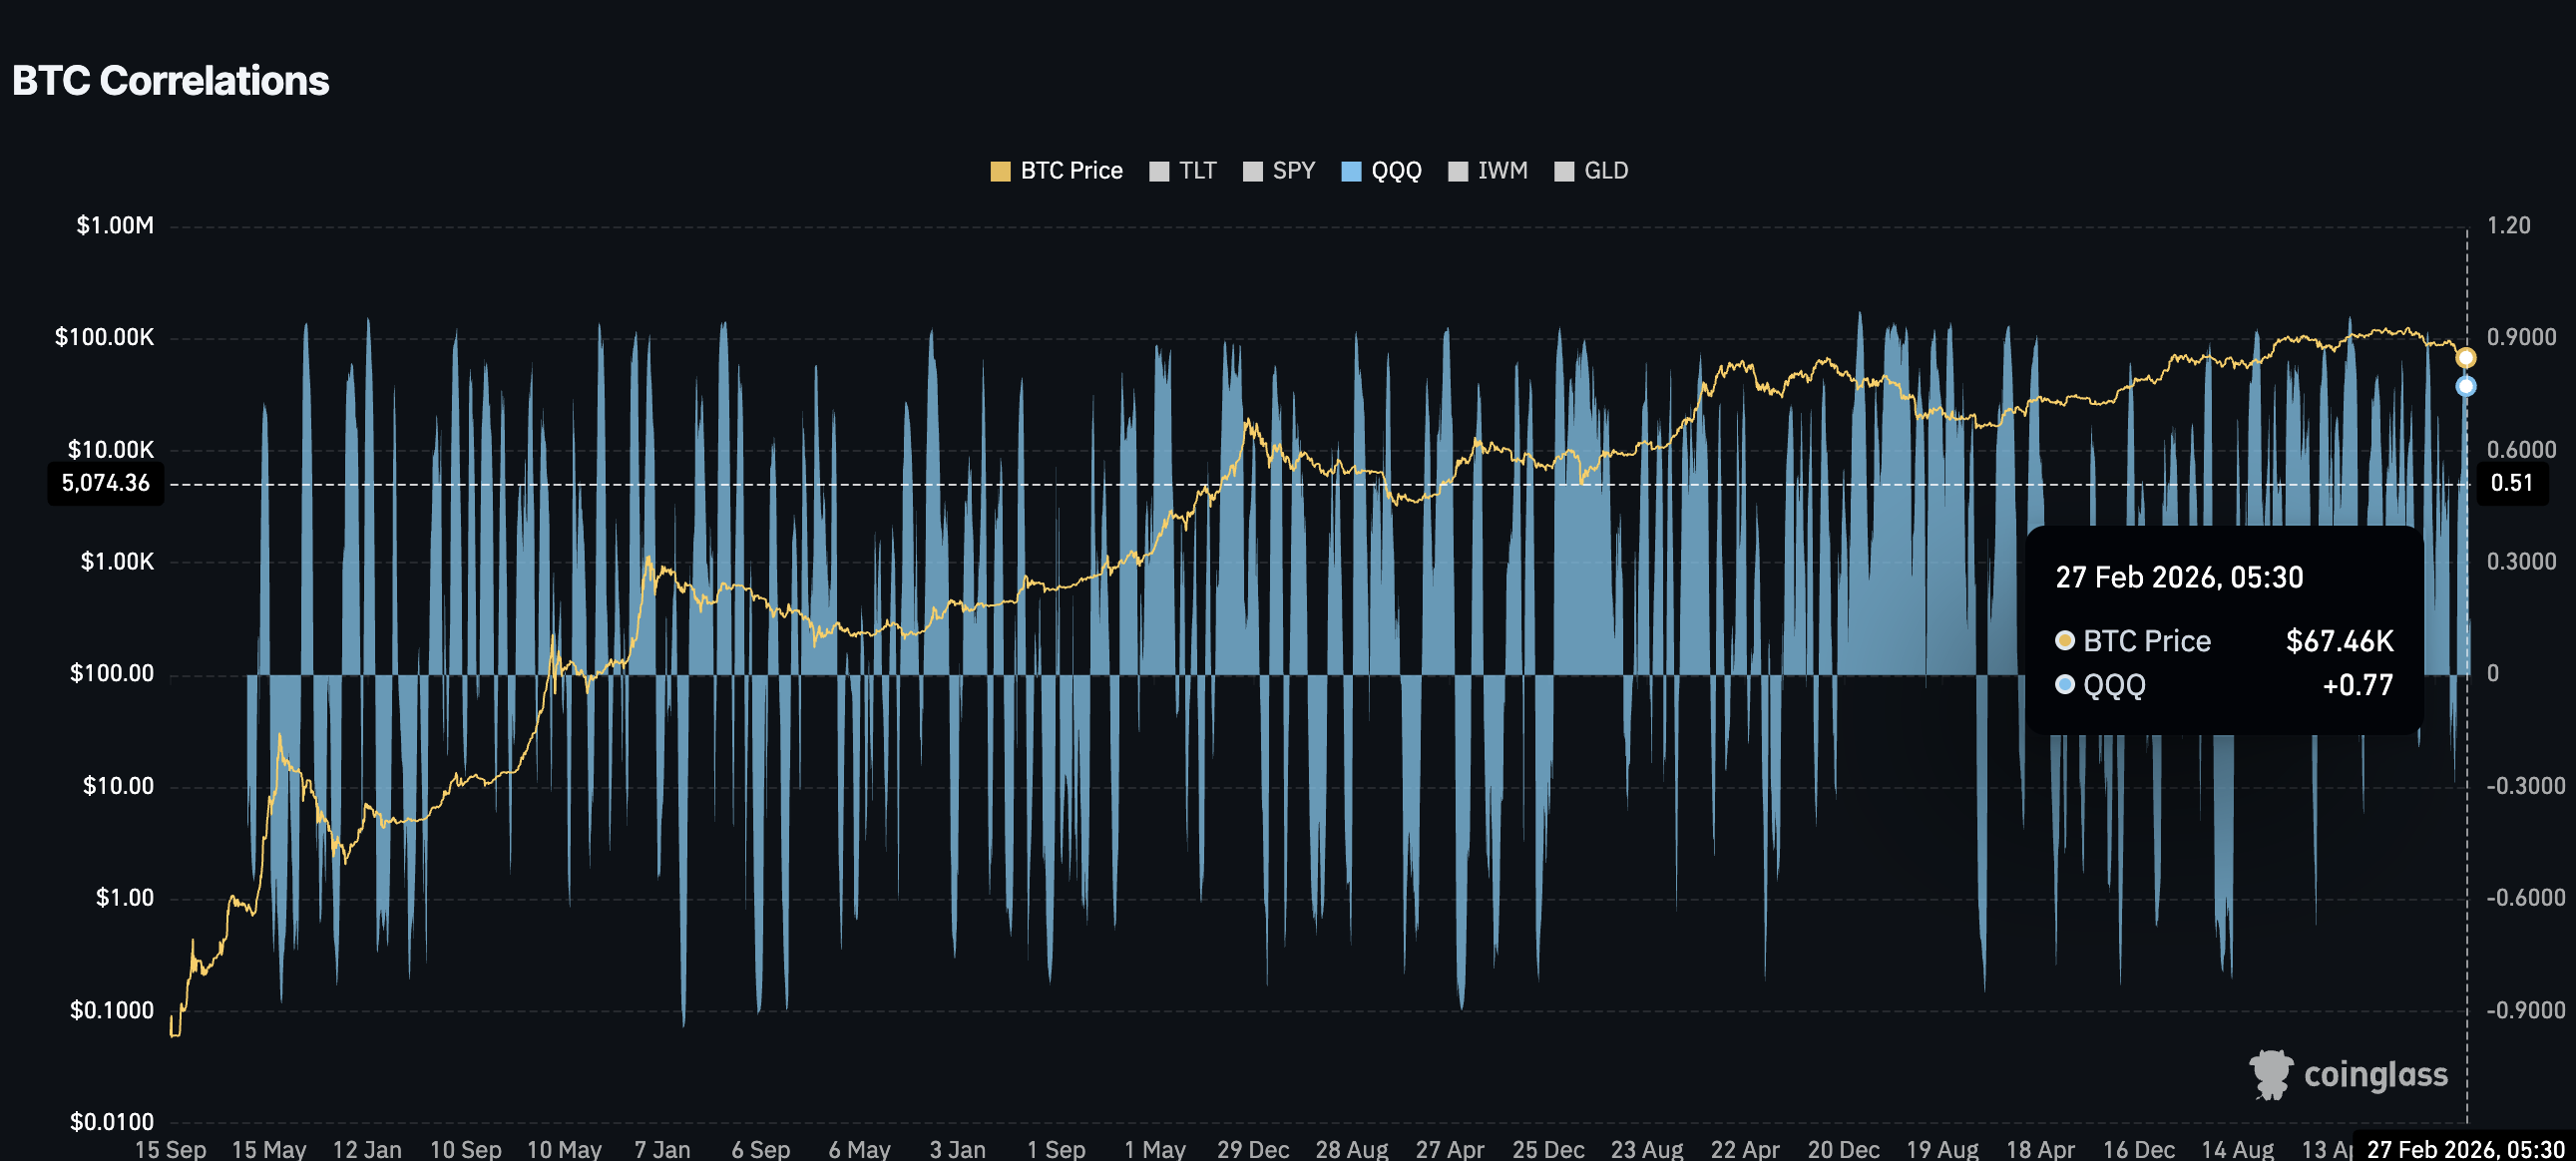 BTC-Tech Correlation: Coinglass
Using technical levels to map January’s BTC high near $98,000 to the February low near $60,000 and a bounce to $73,900, several key price levels now emerge.
The first major resistance sits near $73,900 (obviously). A confirmed three-day close above this zone would strengthen the recovery narrative and signal that bullish momentum is returning.
On the downside, the $60,000–$59,500 zone remains the most critical support region. If that support fails, the next major level appears near $55,000, which aligns closely with Bitcoin’s realized price.
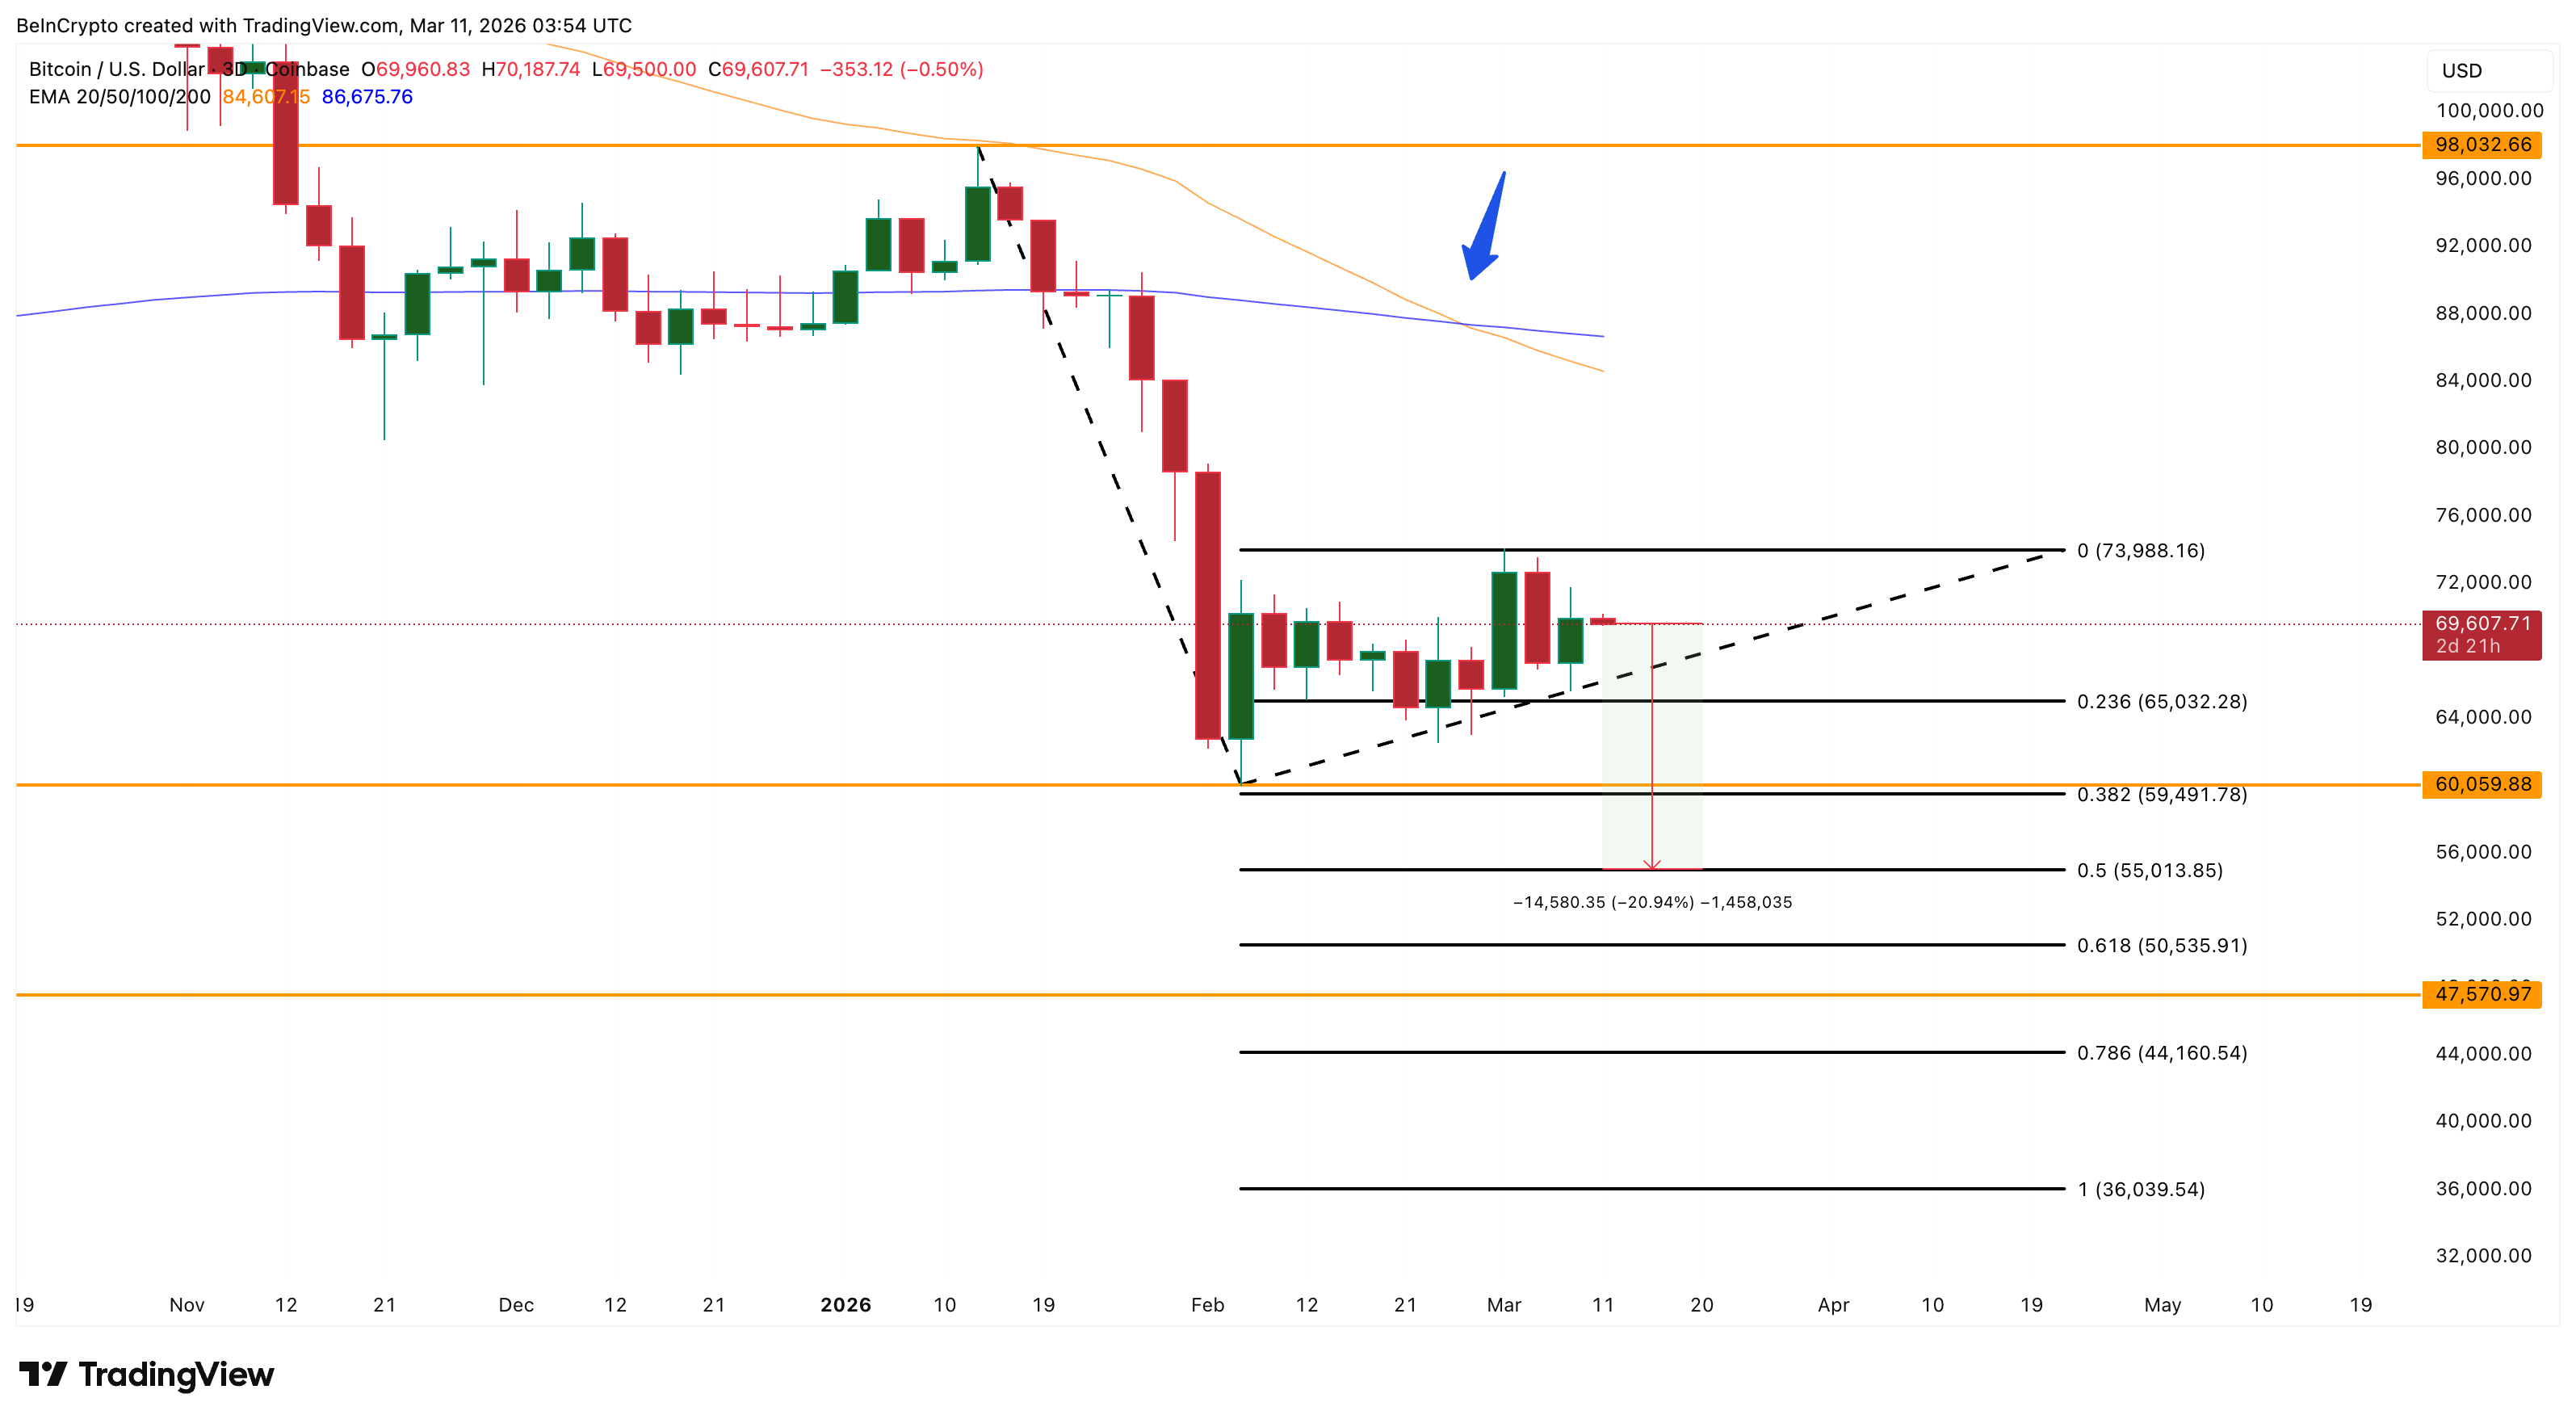 Bitcoin Price Analysis: TradingView
A deeper decline could push BTC prices toward the $50,000–$44,000 range, where the long-term holder’s realized price sits.
Standard Chartered’s Geoff Kendrick previously highlighted a similar possibility but with a bullish angle:
“I think investors want to start buying into those dips. Like any dip below $60K I’d say is good. Maybe we get to $50K… I could see it’s back to $100K by the end of this year,” he said
Bitcoin’s current market structure suggests the asset may be entering a transition phase rather than a full capitulation cycle.
However, resistance near $74,000 still needs to break. Until that happens, the possibility of another decline toward the $55,000–$50,000 zone remains on the table.
0
0


 Manage all your crypto, NFT and DeFi from one place
Securely connect the portfolio you’re using to start.


0
0

