Dogecoin jumps 12%, but warning signs flash for near-term drop

0
0

Dogecoin (DOGE) is the best performer among the top 10 cryptocurrencies by market cap in the last seven days, up 12% during that period.
The leading memecoin maintains its price above $0.1100 at press time on Tuesday, but could encounter selling pressure in the near term.
The coin is losing retail confidence in the derivatives market despite the broader market sentiment improving.
Furthermore, the technical outlook has flipped cautiously bullish for DOGE, with bulls aiming to surpass the $0.1160 resistance zone despite the overbought conditions.
Derivatives data indicate declining demand for Dogecoin
Dogecoin led the market charge over the weekend after adding 12% to its value in the last seven days. While Bitcoin crossed the $80,000 psychological level, DOGE finally surpassed the $0.1000 resistance zone following weeks of sideways price action.
However, the leading memecoin could reverse some of its recent gains as derivatives data suggest declining retail demand.
Data obtained from CoinGlass shows the DOGE futures Open Interest (OI) is down over 4% in the last 24 hours to $1.70 billion, indicating a reduced notional value of outstanding contracts.
In addition to that, the OI-weighted funding rate also dropped to 0.0019% from 0.0043% at the peak on Monday, indicating reduced bullish interest among traders in holding long positions.
At press time, DOGE is down by less than 1% and could slip further in the near term. Dogecoin, like other memecoins, is supported by retail demand. The declining retail demand could negatively impact its price action over the next few hours and days.
DOGE technical outlook
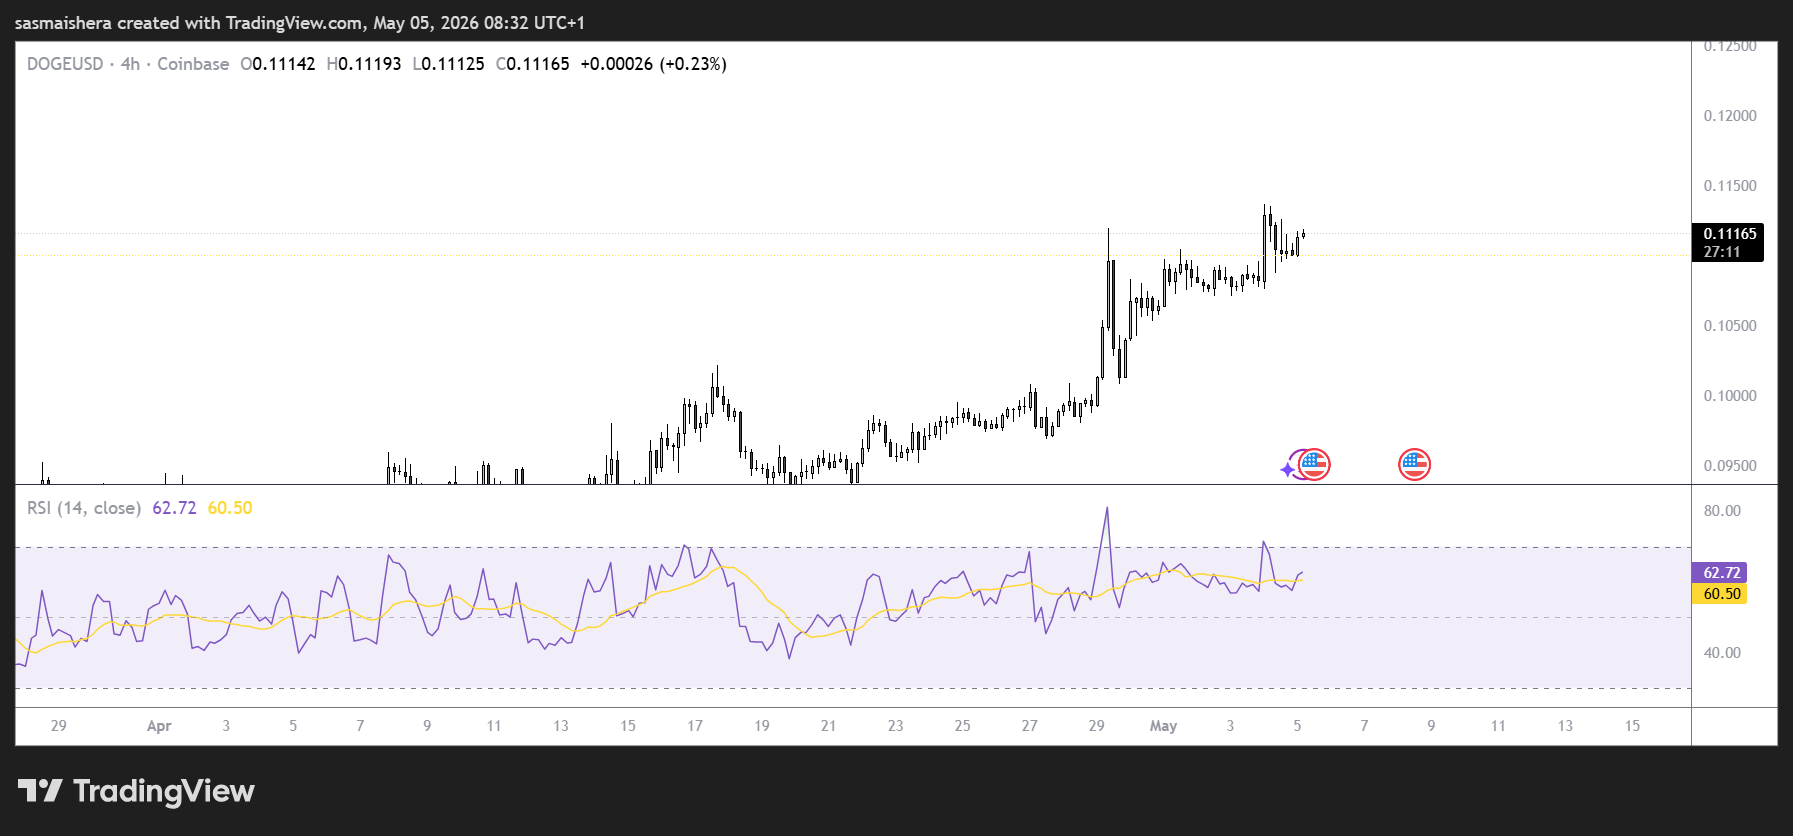
The DOGE/USD 4-hour chart remains bearish and efficient despite Dogecoin’s recent rally. The coin is trading at $0.1115 on Tuesday, extending a bullish near‑term bias as price holds above the 50-day Exponential Moving Average (EMA) at $0.0993.
However, it remains below the 200-day EMA at $0.1254. The surge past the 50-day EMA suggests improving underlying demand.
The Relative Strength Index (RSI) at 76 on the daily chart signals overbought conditions.
The upside momentum reflected in the Moving Average Convergence Divergence (MACD) could be prone to consolidation or a corrective pause before DOGE can test higher levels.
If the rally persists, DOGE could surge towards the Transactional Liquidity (TLQ) at $0.11882, above the February 15 supply zone.
A daily candle close above this level could mean that the broader downtrend is being challenged and could allow DOGE to test the 200-day EMA at $0.1254, the next notable resistance.
However, if the overbought conditions remain in play, sellers would encounter support at the $0.1000 psychological threshold, with stronger technical backing at the 50-day EMA around $0.0993.
Buyers would be looking to step in at the 50-day EMA, as failure to do so could result in a deeper pullback for the leading memecoin.
The post Dogecoin jumps 12%, but warning signs flash for near-term drop appeared first on Invezz
0
0


 Manage all your crypto, NFT and DeFi from one place
Securely connect the portfolio you’re using to start.

0
0


0
0

0
0