
Polkadot Price Prediction: Analyst Eyes a Massive DOT Rally Ahead?

0
0

$DOT has hit the same resistance three times this month and every single rejection has come with a higher floor underneath it.
This Polkadot price prediction looks at whether today's 5% price crash is the one that finally cracks $1.2512, or whether DOT is due for one more fakeout first.
Polkadot Technical Analysis
$DOT spiked from around $0.85 in early September to a high near $1.28 on September 8, then spent the next week grinding all the way back down to the $1.00 zone by September 15.
What's happened is the interesting part: DOT bounced off that low, rallied into the $1.2512 resistance band around September 19 to 23, got rejected, and pulled back to a higher low near $1.0805 instead of retesting $1.00 again.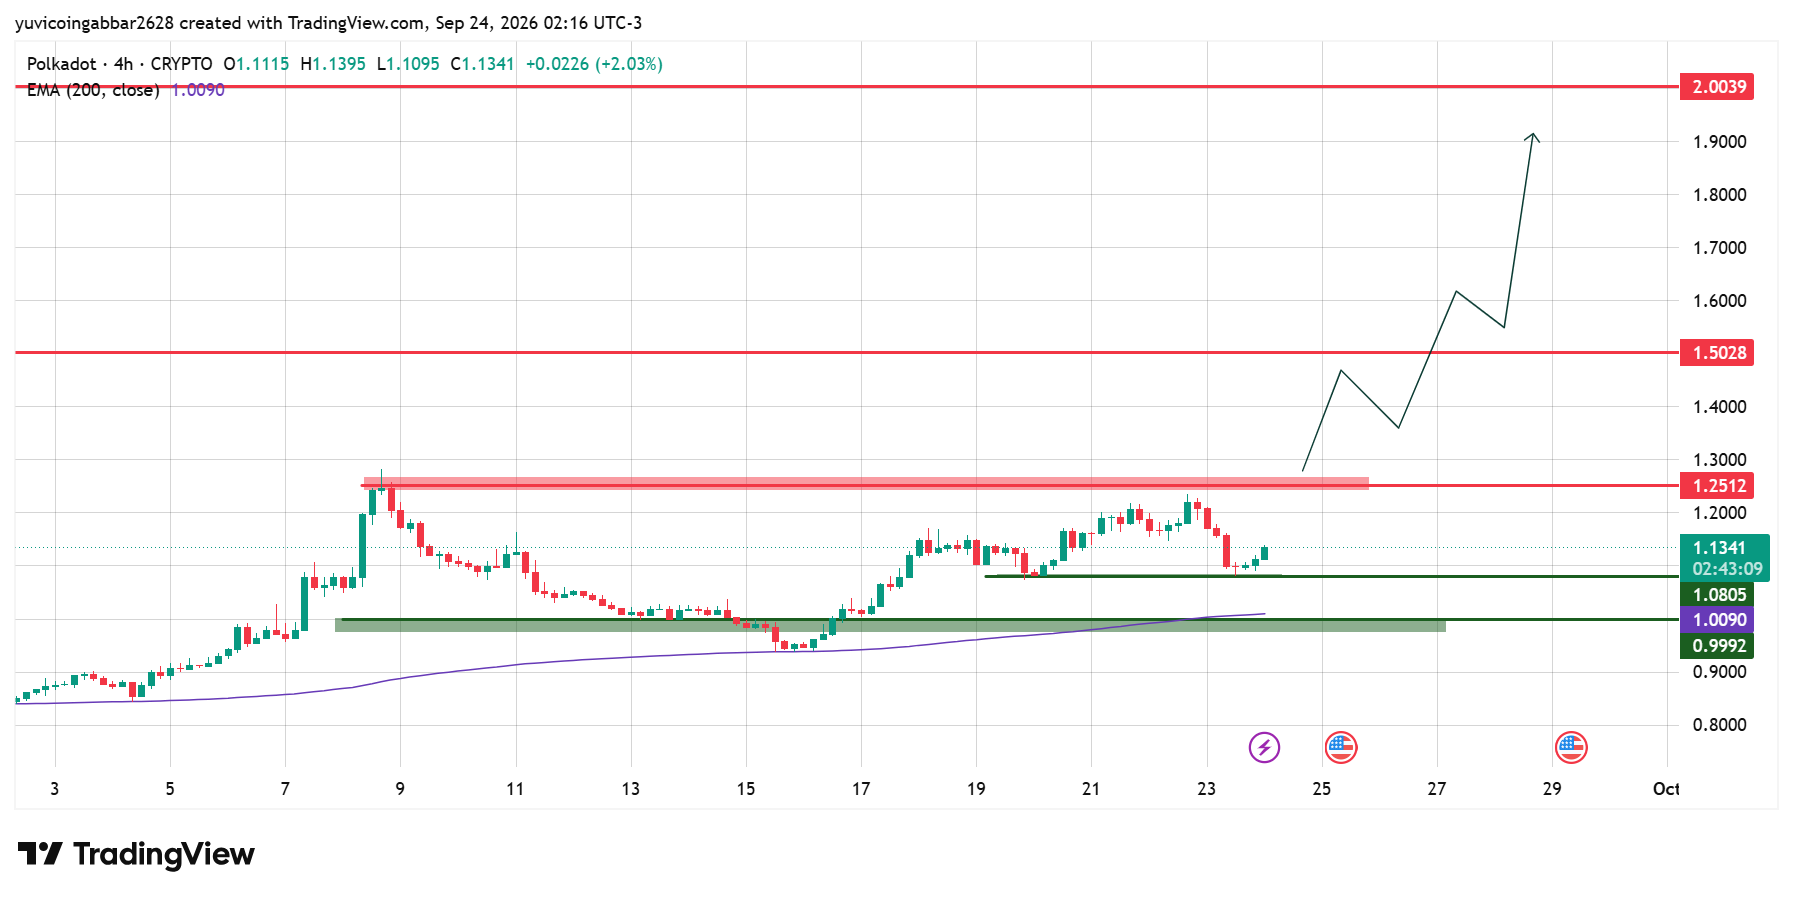
DOT Price Today is down 5%, with the 200 EMA now trending upward underneath price at $1.0090, well below current levels, showing the longer-term trend has firmly turned bullish even while the short-term chart keeps stalling at the same level.
DOT Outlook Key Levels
Level Type | Price |
Resistance 2 | $2.0039 |
Resistance 1 | $1.5028 |
Key Resistance Zone | $1.2512 |
$1.1341 | |
First Confirmed Support | $1.0805 |
EMA 200 Support | $1.0090 |
Deeper Support | $0.9992 |
Polkadot Price Forecast
Bull case: Each pullback since the September 8 high has landed higher than the last, and a confirmed close above $1.2512 would break a resistance level that has held for over two weeks, opening the path toward $1.5028.
The rising 200 EMA underneath the price adds a structural bullish backdrop to any breakout attempt.
Bear case: DOT has already failed at $1.2512 multiple times this month, and a rejection here followed by a close back below $1.0805 would suggest the pattern of higher lows is breaking down.
Losing the EMA 200 support at $1.0090 would be a more serious signal that this entire recovery structure is in trouble.
Polkadot Price Prediction: Can $DOT Reach $2.00?
$2.0039 is the highest resistance level marked on the chart. Reaching it would require $DOT to first clear $1.2512, a level it has failed at repeatedly, and then $1.5028, meaning today's move is really about clearing the first hurdle before any of the bigger targets are realistic.
Polkadot Price Prediction 2026: Expert View
According to CoinGabbar analysts, the pattern of higher lows since the September 8 peak is the most bullish part of this chart, even though the headline story is still "DOT can't clear $1.2512."
A rising 200 EMA well below price is a healthy sign for the broader trend, but this resistance zone has already turned back three rallies, so a close above it, not just an intraday wick, is what would actually confirm the breakout.
Disclaimer
This piece is for informational purposes only and isn't financial advice. The levels and scenarios above are based on technical chart analysis and publicly available data at the time of writing, and crypto markets can move sharply within hours, so past patterns don't guarantee future outcomes. It's worth doing independent research and considering your own risk tolerance before acting on any of the levels discussed here.
0
0

 Gestisci cripto, NFT e DeFi in un unico luogo
Connetti in sicurezza il portafoglio che usi per iniziare.


