The Graph (GRT) Price Recovery at Risk Due to Rising Selling Pressure
11d ago•

bullish:
1
bearish:
0
Share

The Graph (GRT) price is recovering from multi-week lows, trading at $0.20, but this might be the extent of the recovery.
As GRT holders move to sell their holdings, the price will likely take a hit, resulting in the altcoin losing the recent gains.
The Graph Investors Like Their Profits
The rise in GRT price invoked investors’ interest in making money, resulting in the altcoin taking a hit. Signs of the same are visible upon observing the active addresses by profitability. The investors sitting in profit made up 26% of all participating investors.
Generally, these investors tend to be active only when they are seeking to book profits. Their dominance exceeding 25% is a bearish sign as it negatively impacts the price, resulting in a decline in profits or extending losses.
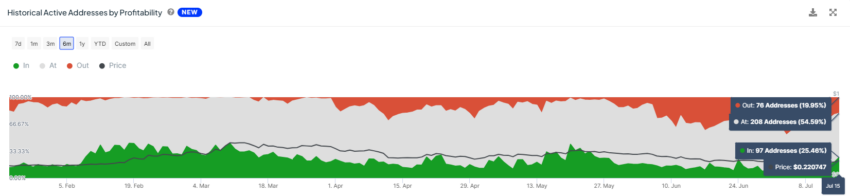 The Graph Active Addresses by Profitability. Source: IntoTheBlock
This is the case with The Graph as well.
Further substantiating this bearishness is the actions of the large wallet holders. The top wallet holders, excluding exchanges, have sold a substantial amount of tokens in the past two weeks.
About 70 million GRT, worth $14 million, have been sold by The Graph investors as the price rose. This profit-taking continues even as the GRT price struggles to close above $0.20.
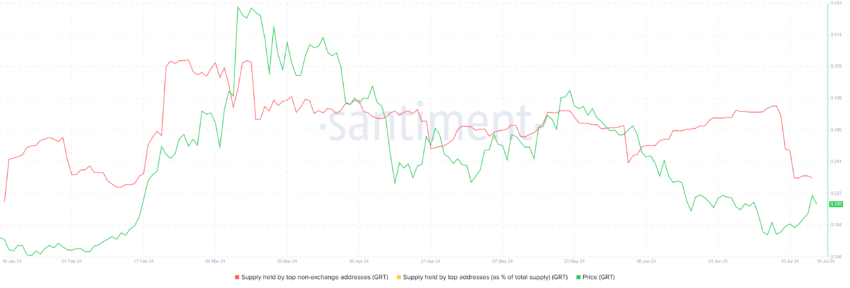 Cardano Supply Held by Top Wallets. Source: Santiment
Consequently, the altcoin could continue to hover around this support level, potentially even losing it amid the bearishness.
GRT Price Prediction: Aiming at Recovery
The GRT price is currently hovering at $0.20, attempting to flip the resistance level into support. Given that this level has been tested in the past, there is a fair chance that it could trigger a cooldown and further recovery.
On the other hand, if the selling continues, it is possible that this support could be lost. Consequently, the altcoin could slip to $0.16, wiping out all the gains noted in the last few days.
Read More: The Graph (GRT) Price Prediction 2024/2025/2030
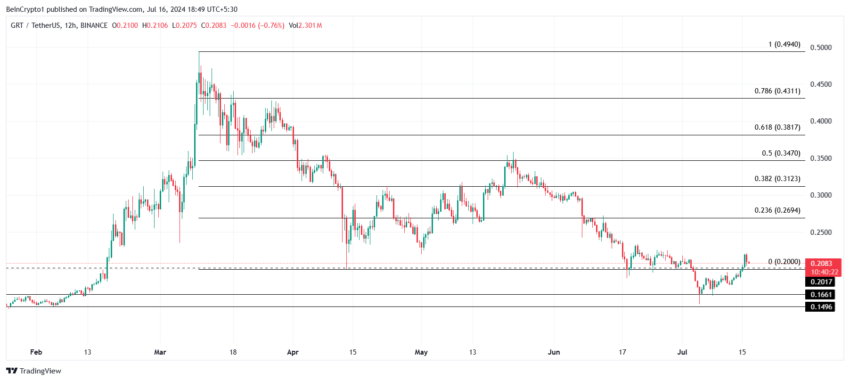 The Graph Price Analysis. Source: TradingView
But if the bounce off the support is successful, a rally to $0.26 is likely. This level marks the 23.6% Fibonacci Retracement line, and flipping it into support would invalidate the bearish thesis.
11d ago•
bullish:
1
bearish:
0
Share


 Manage all your crypto, NFT and DeFi from one place
Securely connect the portfolio you’re using to start.

bullish:
1
bearish:
0

bullish:
1
bearish:
0

bullish:
1
bearish:
0

bullish:
1
bearish:
0