Price Analysis 3/30: BTC, ETH, XRP, BNB, SOL

0
0

BTC is on the verge of having a bearish close to the week. The one-week chart shows a long wick sticking out at the top, indicating that the asset was on the surge at the start of the session. However, the price plunged during the second half of the week.
BTC price action was not isolated, as the crypto market had a similar performance. The global crypto market cap significantly declined over the last three days. Several cryptocurrencies started declining on Mar. 26, causing the industry’s worth to retrace.
The sector dipped from $2.88 trillion to a low of $2.67 trillion. Trading volume over the last seven days gradually dwindled, showing a notable drop in interest. The market saw very little liquidity inflow during this period.
Investors are unable to overcome the massive uncertainty across the market. Crypto ETFs and other products are seeing little inflow due to the uncertainties. One reason for the trend is the US President’s policy on international trade.
The trade wars are causing a significant decline in American stocks. This affects the crypto market as investors bet less on high-risk assets and invest in low-risk assets to hedge the ongoing bearish sentiment across several markets.
The crypto top 10 hit a wall in their recovery bid. However, let’s take a closer look at their price action.
BTC/USD
Bitcoin climbed almost 3% last Sunday. The uptick continued on Monday, with the apex coin surging higher. It broke above $88k for the first time in fourteen days, peaking at $88,772. However, the uptrend ended abruptly as the bulls struggled to maintain momentum.
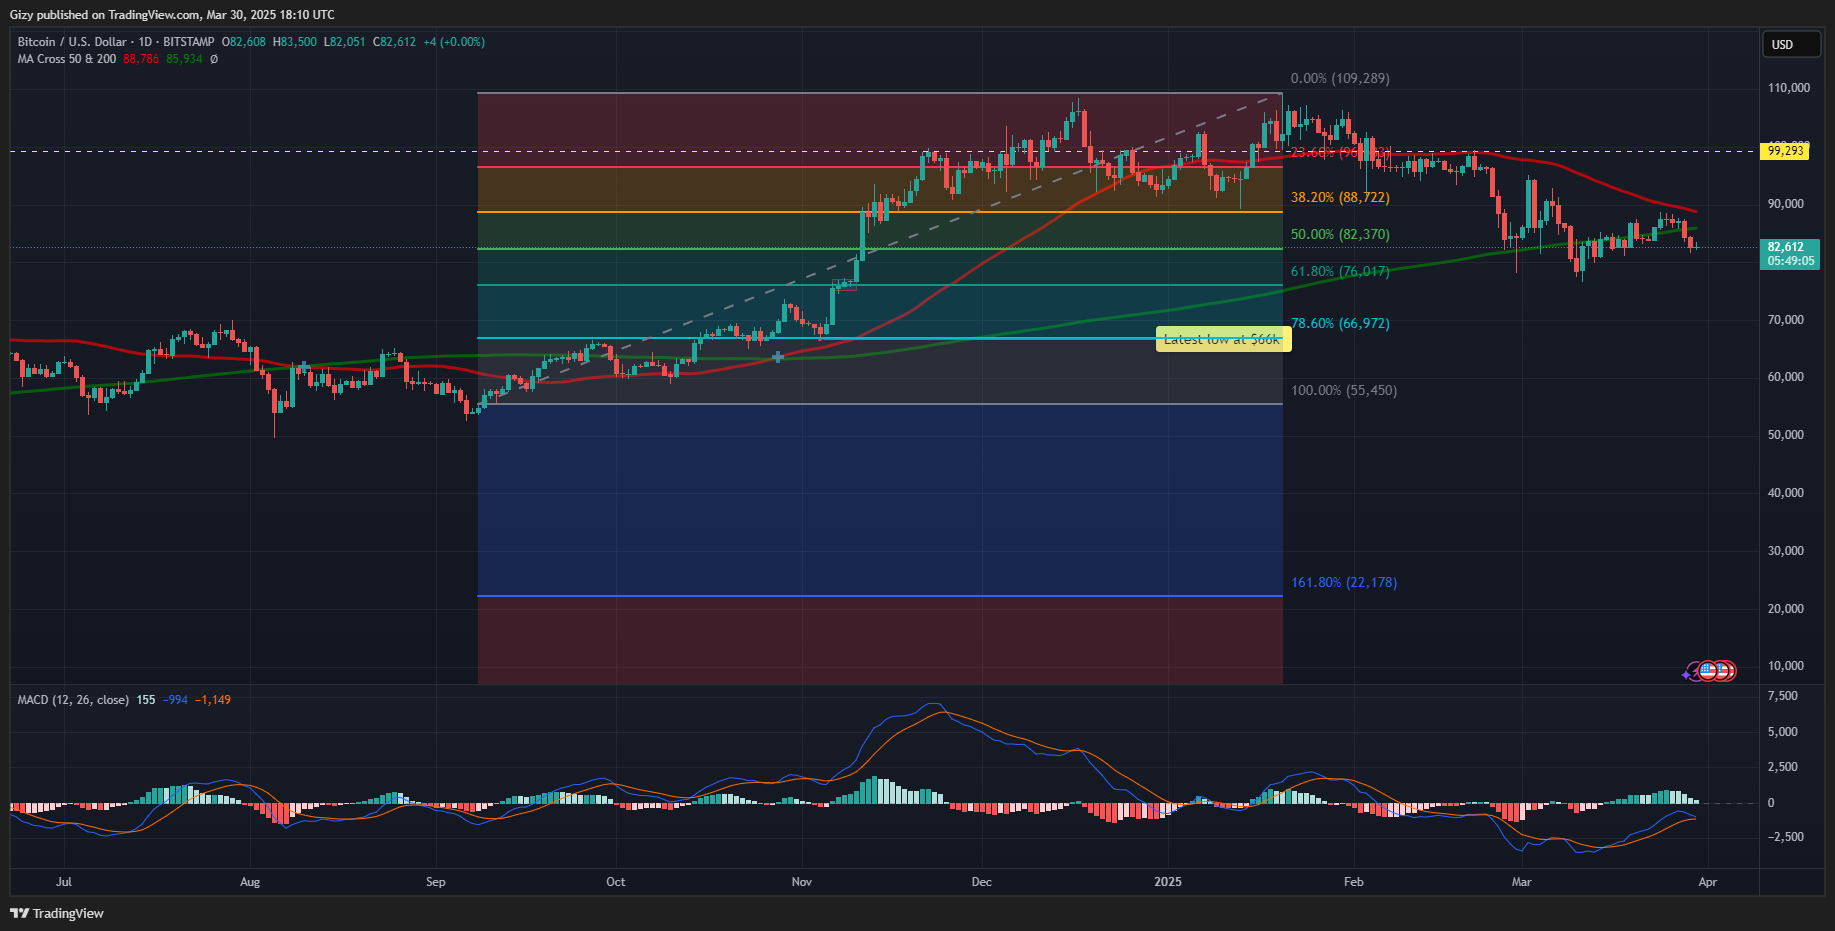
Over the next three days, price actions saw prices remain stable as the asset registered several dojis. Investors’ expectations of lessening bearish sentiment ended as news of further tariffs hit the market. Uncertainty and doubt return to the market during the second half of the week.
BTC started Friday at $87,224 but plunged as the day progressed, hitting a low of $83,544. The largest cryptocurrency lost 3% and continued its decline the next day.
However, data from Cryptoquant shows that traders attempted buybacks but failed as selling pressure spiked. More funds are moving into cold storage while exchanges register notable inflows. Nonetheless, trading volume over the last six days was notably low, resulting in BTC price stability during the first half of the week.
Since then, indicators have flipped bearish. The moving average convergence divergence shows an ongoing bearish interception. The 12-day EMA edges closer to the 26-day EMA as many fear further retracement.
ETH/USD
The one-day chart shows that the largest altcoin was on an uptrend at the start of the week. It gained almost 4% on Monday, continuing the previous day’s increase. However, this was the only green candle on the chart as the asset retraced afterward.
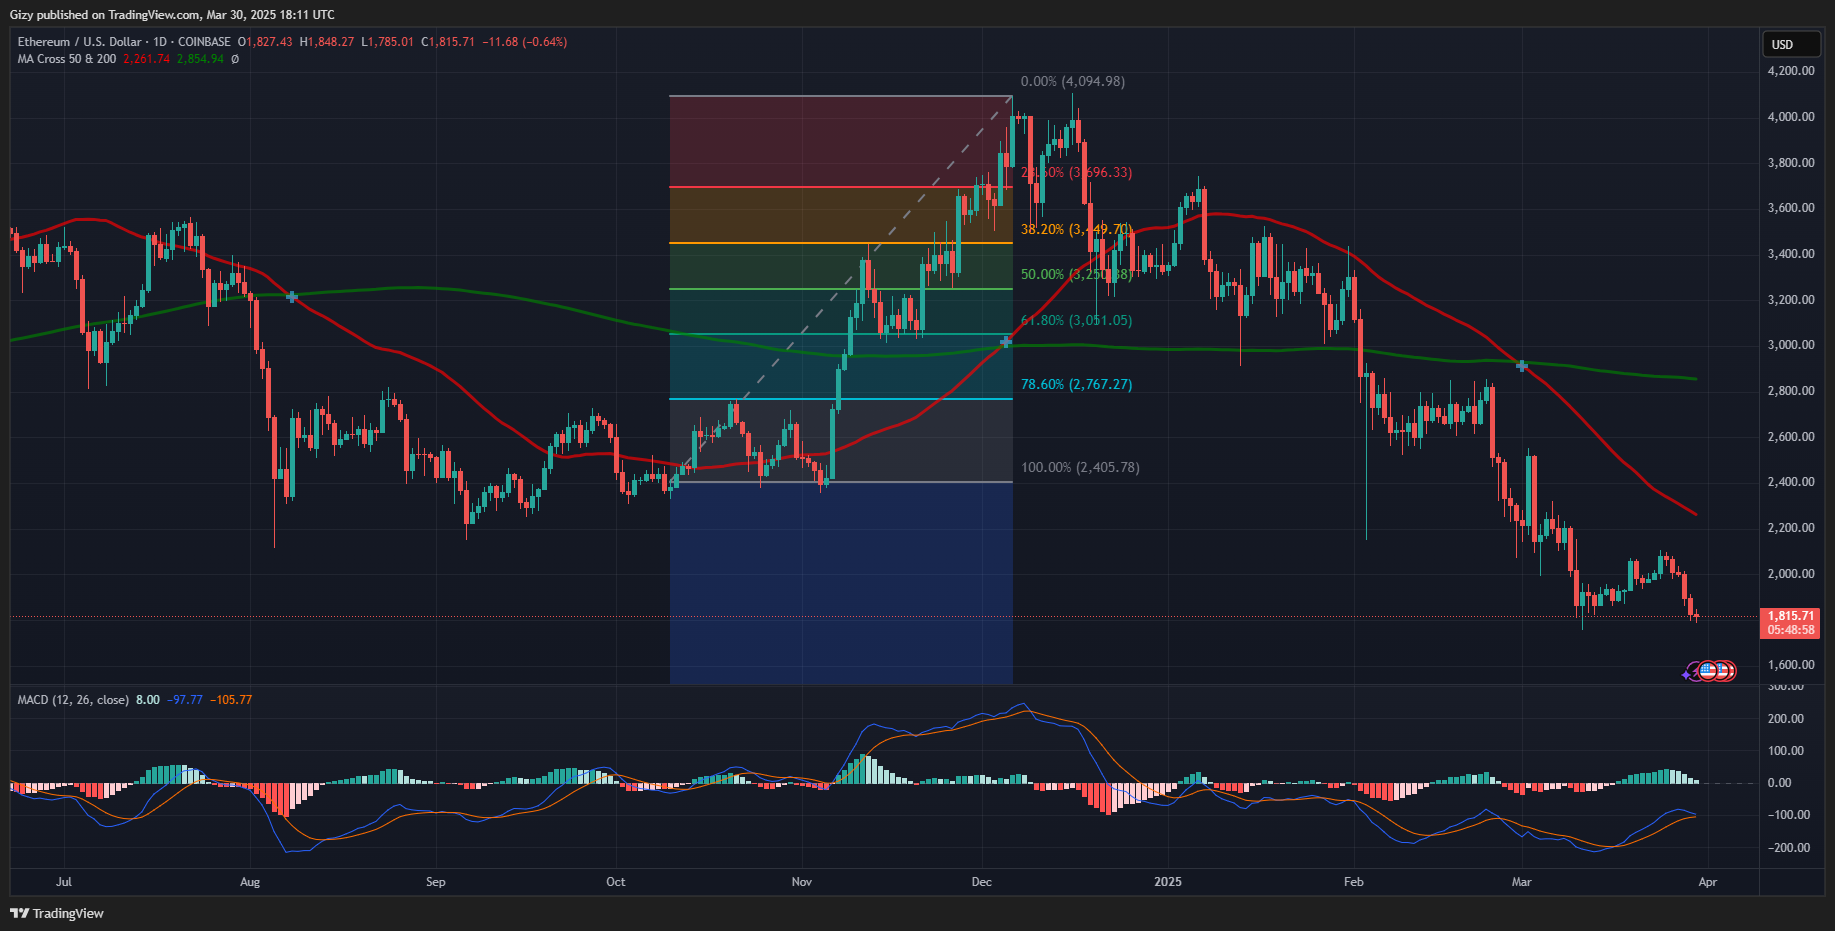
Ethereum briefly broke the $2,100 resistance but hit a brick wall, sending prices lower. The next day, it started its downhill movement with slight declines, which intensified as the session progressed. One of the most significant dips happened on Friday as prices retraced from $2k to $1,860 and lost over 5%.
The downtrend is ongoing, and ETH is approaching its fourteen-day low, with indicators flipping bearish. Down by over 10% this week, the apex altcoin resumes its decline on the one-week scale after a brief pause last week.
Ethereum’s death cross worsened following its most recent price movement, with the 50-day MA dipping lower. MACD prints grimmer signals, displaying a bearish convergence. If the price trend remains unchanged, a divergence may happen in the next 24 hours.
XRP/USD
XRP broke above $2.50 on Monday following its almost 3% increase on Sunday. The asset failed to continue its uptrend as it saw a spike in selling pressure, resulting in a retracement to its opening price.
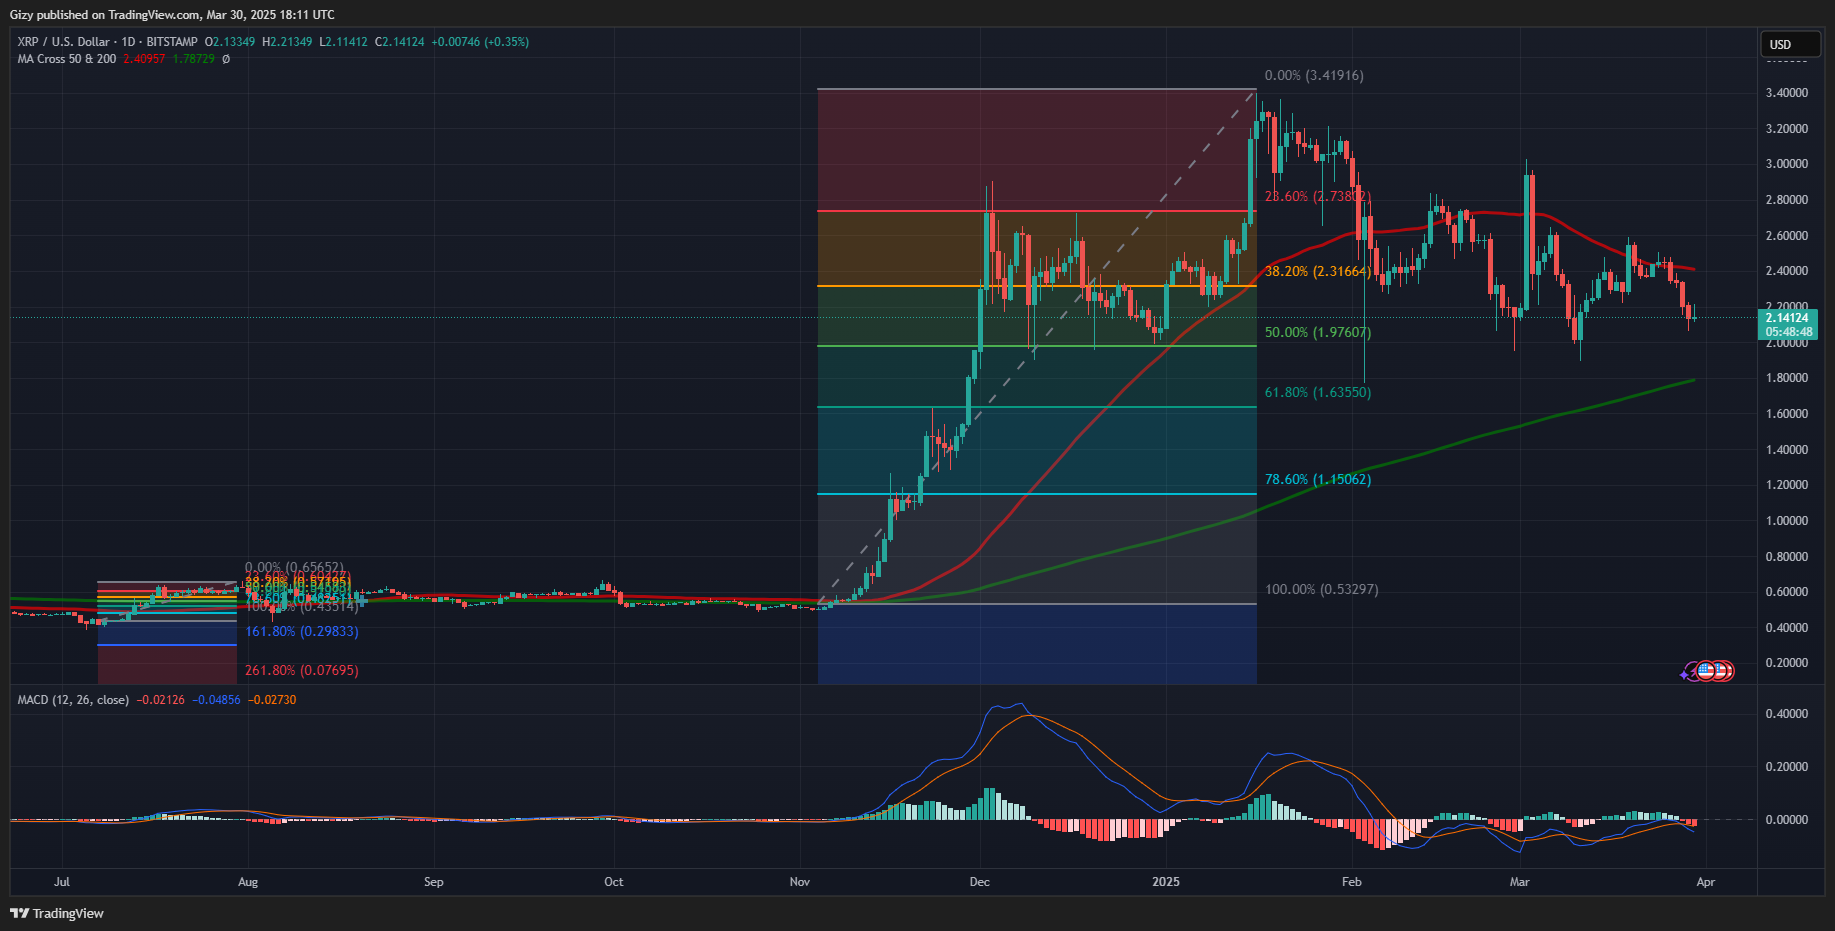
The asset plummeted on Wednesday, slipping below its 50-day MA. The altcoin lost over 4% as it dropped below $2.40. A previous analysis pointed to the implication of a slip below the $2.38 support, hinting at a possible dip to $2.20.
XRP trades at $2.13 at the time of writing as it grapples with significant selling pressure. It briefly reclaimed $2.20 earlier on Sunday but failed to sustain the momentum, resulting in its current valuation. It is worth noting that the cryptocurrency is down by over 12% on the weekly scale.
The altcoin had a bearish divergence on MACD in response to the most recent price trend. The 50-day MA continues its downtrend, edging closer to the 200-day.
BNB/USD
Binance coin had a death cross two weeks ago. However, the bulls attempted a buyback with minimal success. Prices remained rangebound for most of the last fourteen days.
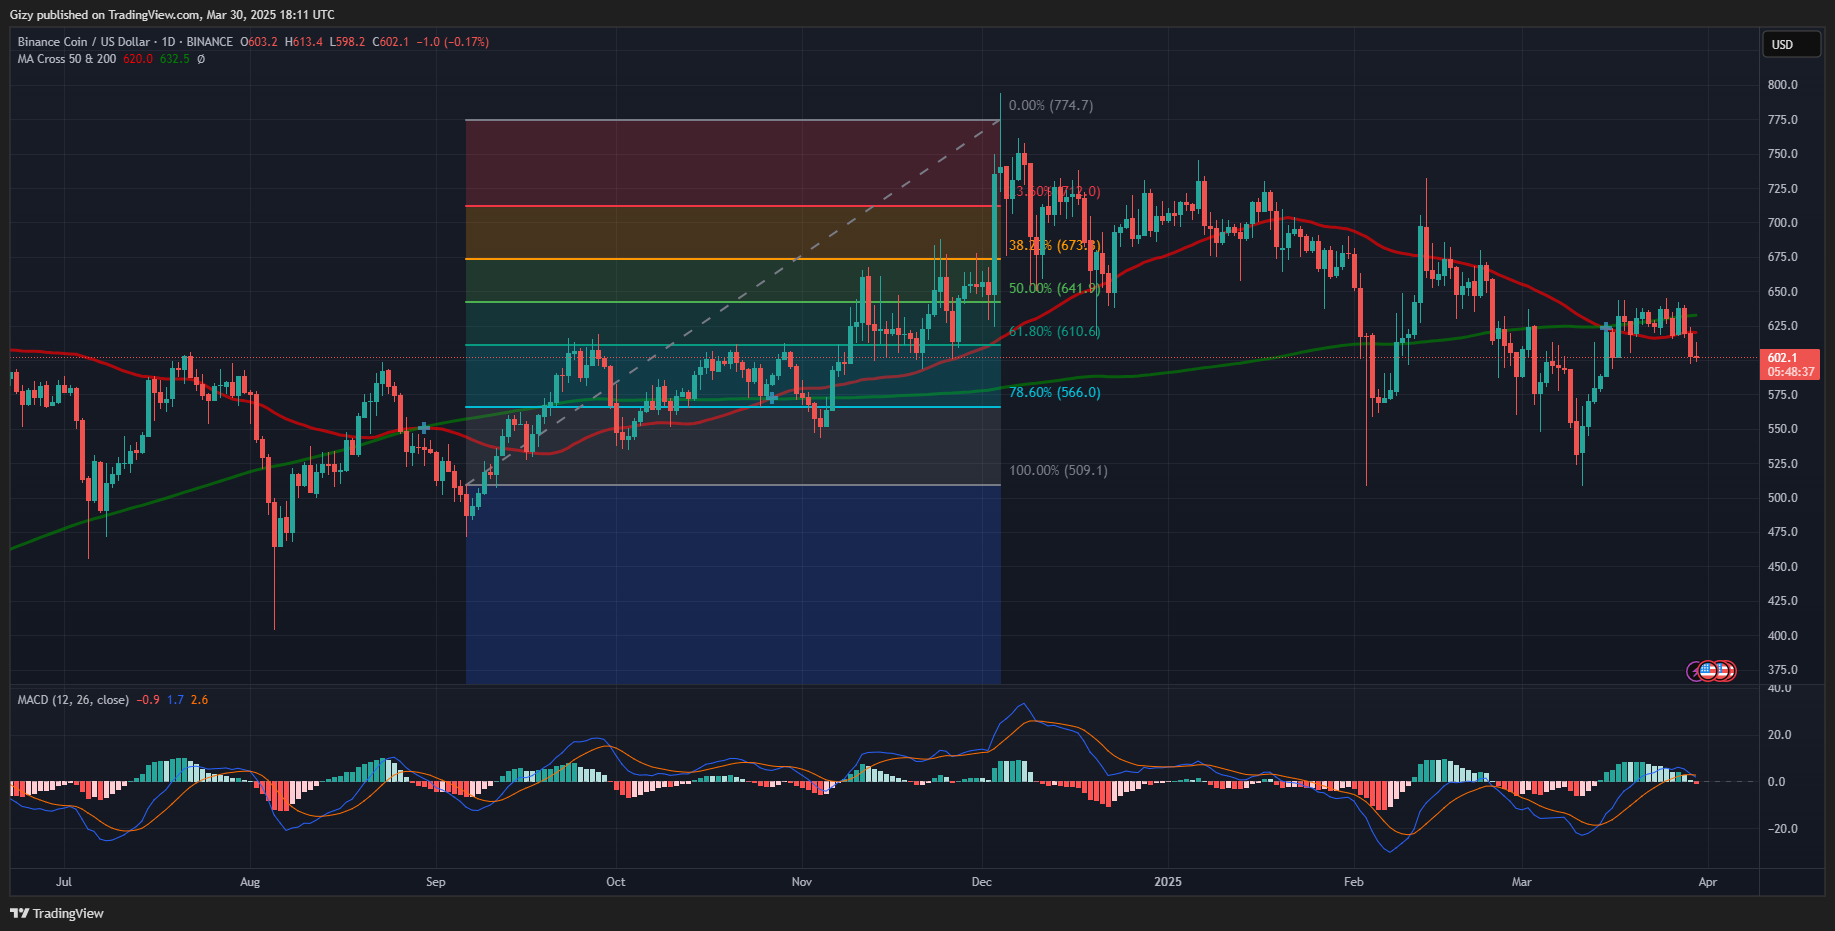
The asset recently broke out of the trend on Saturday, dipping below the 50-day MA. It is worth noting that BNB has held this metric as critical support since Mar. 20. The previous day’s decline saw it break out of its trend.
Binance coin lost almost 6% in the last three days. It trades at $600, and indicators point to a slip below this important level. One such indicator is MACD, which displayed a bearish divergence during the previous intraday session. The ongoing divergence may signal further declines.
SOL/USD
SOL is trading closer to critical support at the time of writing. The one-day chart shows it trading close to the $120 mark. Maintaining prices above this key level is vital, as previous price movement points to a slip to $118.
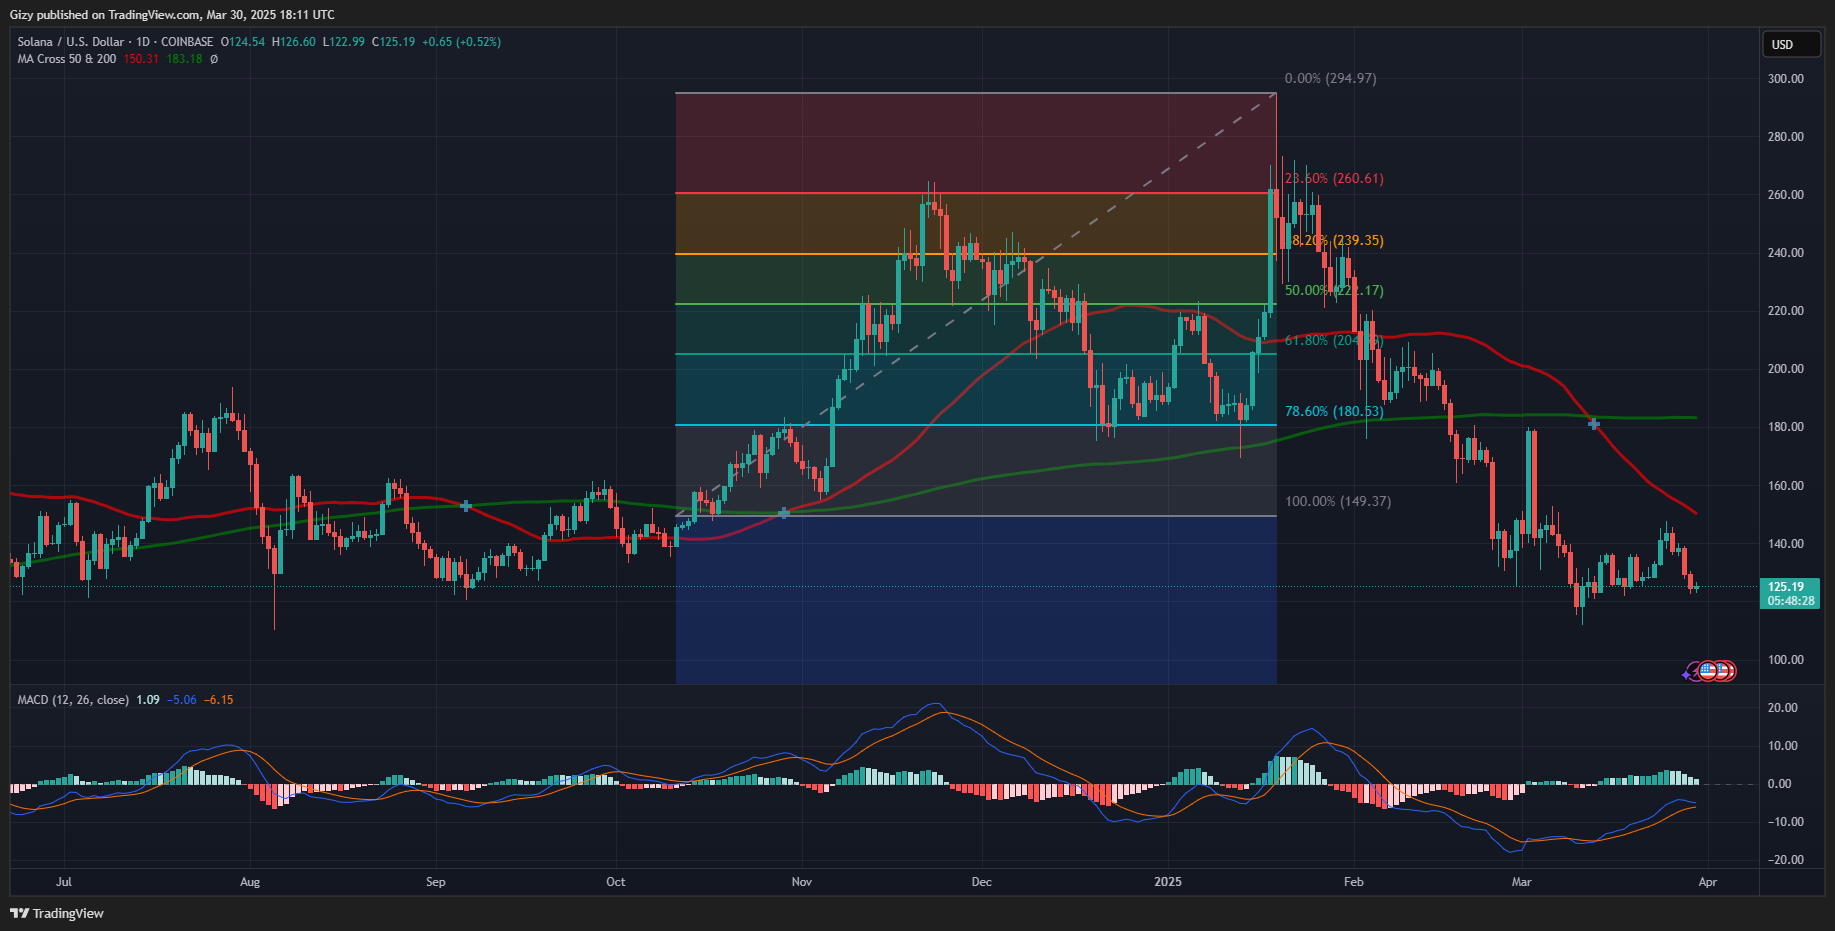
Nonetheless, the altcoin had a death cross last week as the 50-day MA intercepted the 200-day MA. The asset is on the verge of another flipping. The moving average convergence divergence displays a nearly complete interception between the 12-day EMA and 26-day EMA.
SOL’s latest trend started after it failed to sustain its upward trajectory on Tuesday. Wednesday kicked off the selloffs with a 4% decline. The downtrend is ongoing, and the cryptocurrency is down by over 6% on the weekly scale.
The post Price Analysis 3/30: BTC, ETH, XRP, BNB, SOL appeared first on Cointab.
0
0


 Manage all your crypto, NFT and DeFi from one place
Securely connect the portfolio you’re using to start.


