
1
0

Key takeaways
Despite occasional challenges for Solana ecosystem, including network congestion and competition from other blockchain platforms, Solana demonstrates resilience and adaptability, despite the current price fluctuations , positioning itself as a leading player in the decentralized finance (DeFi) and Web3 landscape.
Overall, the prevailing sentiment within the Solana community is one of confidence and excitement, with stakeholders eagerly anticipating the platform’s continued evolution and impact on the broader crypto ecosystem.
While uncertainties persist, Solana’s innovative approach and robust infrastructure instill optimism for its future price trajectory, as indicated by the solana price forecast and market dominance. How high can SOL go in 2025 and beyond?
| Cryptocurrency | Solana |
| Token | SOL |
| Price | $104.28 |
| Market Cap | $53,757,609,042.13 |
| Trading Volume 24-h | $5,184,915,724.17 |
| Circulating Supply | 515,471,685.26 SOL |
| All-time High | $294.33 Jan 19, 2025 |
| All-time Low | $0.5052, May 11, 2020 |
| 24-hour High | $112.30 |
| 24-hour Low | $103.14 |
| Sentiment | Bearish |
| 50-Day SMA | $139.69 |
| 200-Day SMA | $182.91 |
| Price Prediction | $220.50 (111.41%) |
| F & G Index | 22.90 (extreme fear) |
| Green Days | 14/30 (47%) |
| 14-Day RSI | 30.42 |
TL;DR Breakdown:
The price analysis of Solana for April 8 shows The analysis reveals strong bearish momentum in the price action in the past few days as the price fell from above $150 to the $94 level. The bulls were able to carry the price past the $110.00 level, but due to a lack of support above the $105.00 mark, the price retraced sharply to the current level.
Solana showed significant bearish pressure on the daily chart, reaching $94. However, the bulls could not maintain a foothold above the level, and the following selloff caused the price to fall back to $105.0, where it currently trades.

The Relative Strength Index (RSI) stands at 32.76, showing little room for further downward movement across the daily charts. The Moving Average Convergence Divergence (MACD) line crosses the signal line downwards, suggesting strong bearish momentum. On the other hand, the MACD histogram shows rising bearish pressure in the cryptocurrency market as bulls find bleak support at $100.
The hourly chart for Solana reveals a breakdown as the bulls failed to stabilize at the $130 level, and the price fell to the $125 mark before retracing even further. The high trading volume suggests that the selloff has not ended and the price seeks stability above $100.

From a technical perspective, the MACD shows bullish momentum at 0.32, with the indicator showing falling bullish momentum with recent candles. This suggests that the bulls are yet to find a foothold at the level. The RSI (Relative Strength Index) is at 40.18, indicating that Solana has little to no room for further decline across the short term.
| Period | Value | Action |
|---|---|---|
| SMA 3 | $ 153.22 | SELL |
| SMA 5 | $ 149.85 | SELL |
| SMA 10 | $ 145.96 | SELL |
| SMA 21 | $ 134.71 | SELL |
| SMA 50 | $ 155.93 | SELL |
| SMA 100 | $ 182.10 | SELL |
| SMA 200 | $ 184.03 | SELL |
| Period | Value | Action |
|---|---|---|
| EMA 3 | $ 141.43 | SELL |
| EMA 5 | $ 152.40 | SELL |
| EMA 10 | $ 169.67 | SELL |
| EMA 21 | $ 184.42 | SELL |
| EMA 50 | $ 196.02 | SELL |
| EMA 100 | $ 193.66 | SELL |
| EMA 200 | $ 179.41 | SELL |

The Solana price analysis across the daily and 4-hour charts indicates a notable decay after rising towards the $150 price level. The 4-hour chart reinforces this downward trend with a bearish crossover in the MACD and the RSI falling into unfavorable territory, signaling potential continued downward momentum. Overall, Solana appears to be in freefall, and if the selloff continues, the price could soon fall to $80 lows.
Solana is a high-performance blockchain platform known for its scalability and speed, boasting a substantial Total Value Locked (TVL). The network continues to hit key development milestones. Despite a challenging month, price predictions indicate a more optimistic outlook, suggesting Solana prediction the potential for future growth.
The minimum predicted value for Solana in 2025 is $178.82, with an average price of $395.40. The maximum price could reach $438.30 during the year.
The price forecasts indicate that SOL could reach a minimum of $1,139 by 2030. Given the bullish scenario and the projected positive market sentiment and growth trend, SOL might reach $1,000 within the next five years.
Reaching $5,000 is plausible but would likely take several years beyond the current forecast period. However, a snowball in the asset’s adoption might bring the moment sooner.
Yes, Solana has a good long-term future, with a promising market capitalization due to its high scalability, low transaction costs, and robust ecosystem. Its growing adoption, strong developer community, and strategic partnerships further enhance Solana’s forecast of its potential for sustained growth.
Solana’s price prediction for April 2025 suggests a range of outcomes based on current market trends and analysis. The forecast anticipates SOL fluctuating between a minimum of $93.01 and an average of $167.90, and potentially reaching a maximum of $234.99.
| Month | Minimum Price | Average Price | Maximum Price |
| April | $93.01 | $167.90 | $234.99 |
The SOL price prediction for 2025 suggests a minimum value of 97.47 with an average price of 215.52. The price could reach a maximum of $238.90 during the year.
| Year | Minimum Price ($) | Average Price ($) | Maximum Price ($) |
| 2025 | 97.47 | 215.52 | 238.90 |
| Year | Minimum Price ($) | Average Price ($) | Maximum Price ($) |
| 2026 | 233.41 | 262.93 | 274.17 |
| 2027 | 319.79 | 382.43 | 390.71 |
| 2028 | 418.09 | 471.33 | 492.29 |
| 2029 | 418.09 | 471.33 | 492.29 |
| 2030 | 515.46 | 582.88 | 595.53 |
| 2031 | 731.62 | 779.77 | 811.85 |
Solana’s price is predicted to reach a minimum of $233.41 in 2026. Experts suggest that the coin could reach a maximum value of $274.17 and an average price of $262.93.
In 2027, the price of Solana is forecasted to be around a minimum value of $319.79. Solana’s price can reach a maximum of $390.71, and the average trading value is $382.43.
If the bullish run from previous years continues into 2028, SOL can reach a minimum price of $418.09, a maximum price of around $492.29 , and an expected average trading price of $471.33.
An analysis of SOL’s historical performance shows that the coin could attain new highs in 2029, reaching a maximum price of $492.29, a minimum of $418.09, and an average trading price of $471.33.
Based on the Solana price prediction for 2030, investors can expect a maximum price of $595.53 and a minimum SOL price of $515.46 . On average, the SOL coin could trade at $582.88.
Solana’s price is projected to reach a minimum of $731.62 in 2031. Expert findings suggest that it could reach a maximum of $811.85 and an average forecast price of $779.77.
Solana Price Prediction 2025 – 2031
| Firm | 2025 | 2026 |
| Gov.Capital | $211.99 | $334.233 |
| DigitalCoinPrice | $414.94 | $476.21 |
Our predictions show that SOL will achieve a high of $238.90 in 2025. In 2028, it will range between $418.09 and $492.29, with an average of $471.33. In 2031, it will range between $731.62 and $811.85 , with an average of $779.77. Note that these predictions are not investment advice. Seek independent professional consultation or do your research.
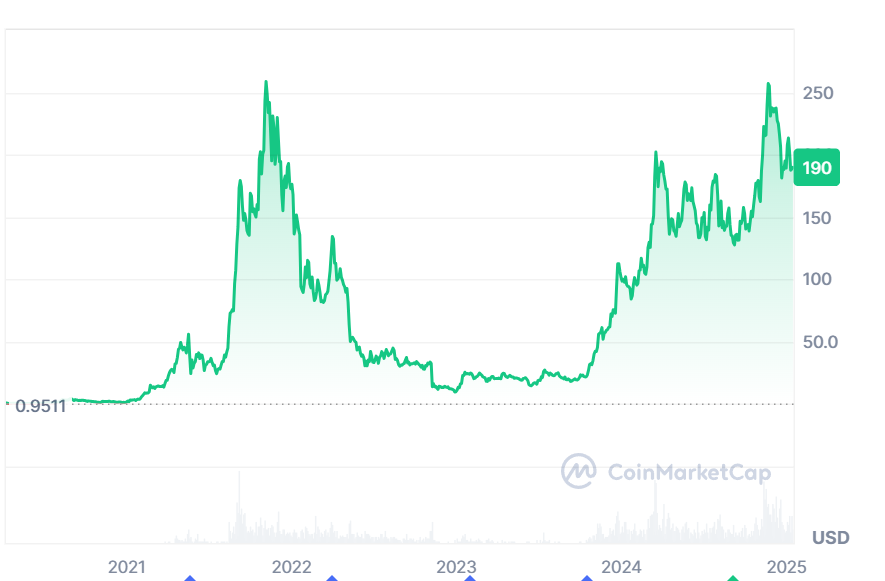
Solana Price History Source: Coinmarketcap
1
0
 Manage all your crypto, NFT and DeFi from one place
Securely connect the portfolio you’re using to start.


0
0

0
0

0
0

