Price Analysis 3/22: BTC, ETH, XRP, BNB, SOL

0
0

XRP is on the verge of ending another week with significant gains. It climbed to its fourteen-day high, veering closer to $2.60.
XRP continues to hold its position on the market cap rank as the crypto market gradually recovers after several weeks of consistent declines. This may mark the second week with notable increases.
Data from Coinmarketcap shows that the global cryptocurrency market cap hit $2.82 trillion a few days ago. The fear and greed index indicates a growing shift in traders’ sentiment. The metric hit its highest mark in the last fourteen days.
Further data from the platform shows that trading volume is declining amid a slight increase in buying pressure. Liquidity inflow into the market has significantly reduced and shows no signs of increasing this week.
Fundamentals were relatively silent over the last six days. Nonetheless, data from Santiment stated that Ethereum’s supply on crypto exchanges has dropped by 16.4% since January, the lowest since November 2015, a 10-year low.
BNB chain received more trading volume over the last seven days. The week started with news of DEX volume crossing $1 billion, surpassing Solana and Ethereum. The launches of Mubarak and TUT gained massive acceptance.
Nonetheless, several cryptocurrencies in the top 10 show slight hints of recovery. Let’s examine them.
BTC/USD
Bitcoin started the week at $82,569 but surged above $87k a few days later. However, the uptick was short-lived, as the apex coin retraced. The events of Wednesday saw the largest coin surge from $82k to $87k.
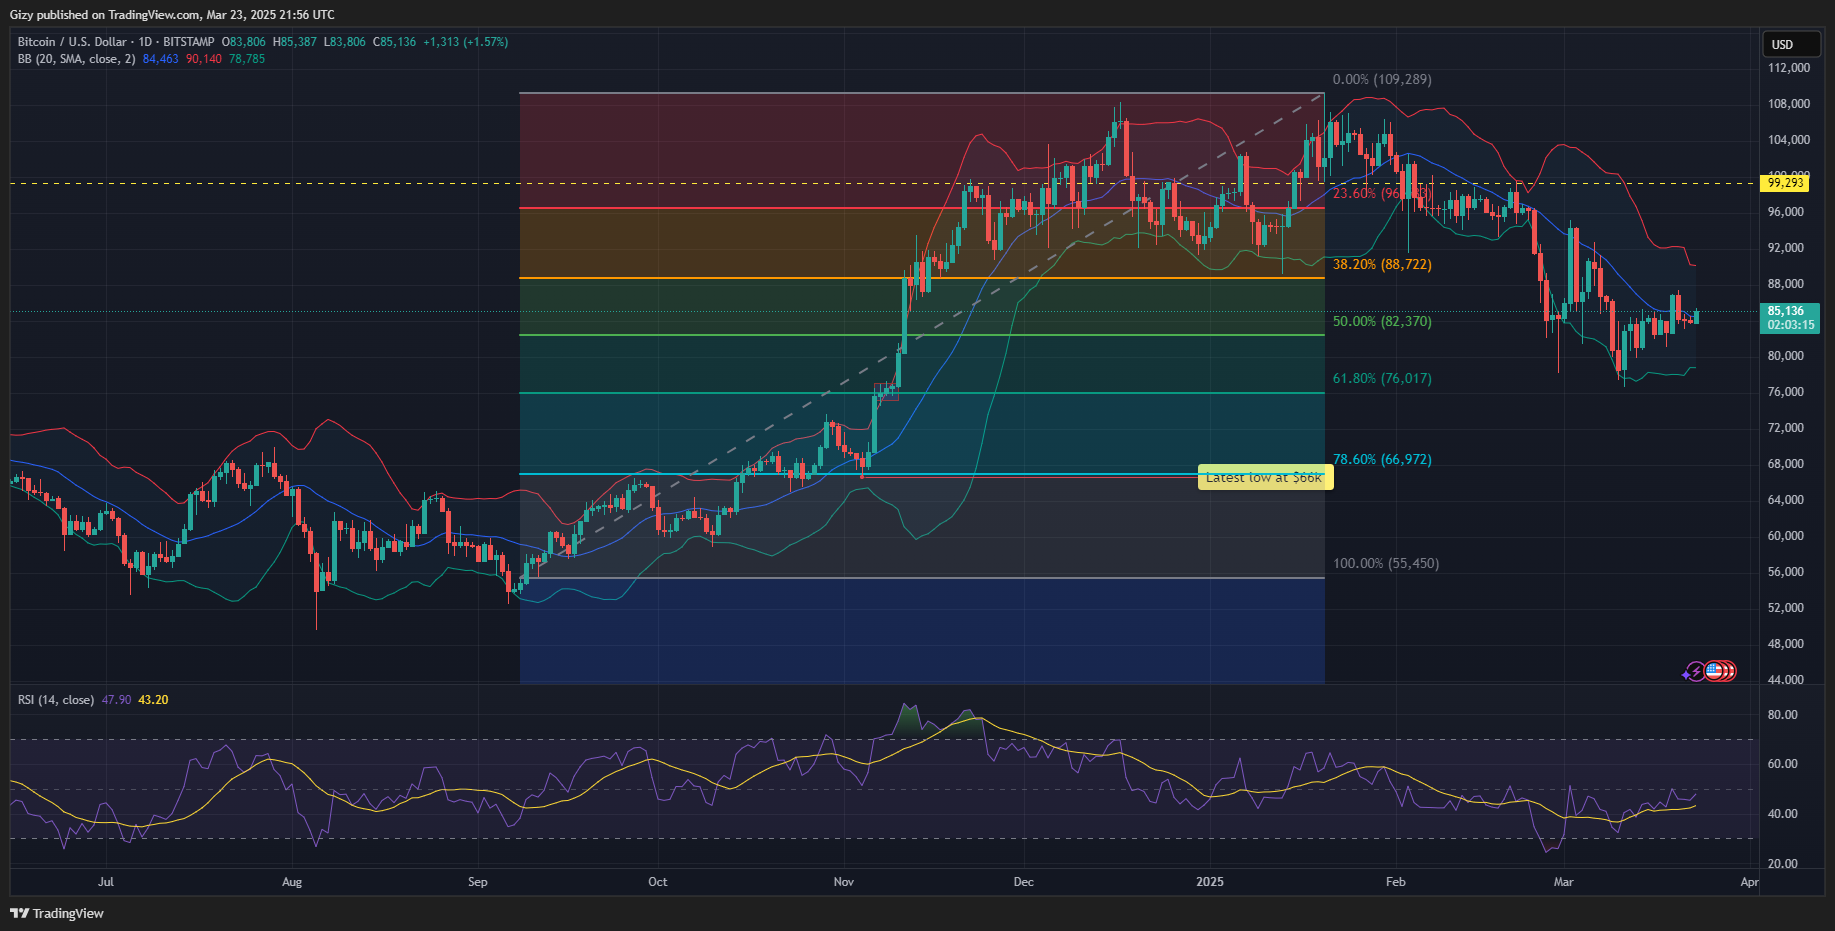
The surge ended abruptly the next day as many took profit. Calls from CryptoQuant CEOs about the start of a bear market may have contributed to the decline, as BTC has yet to continue its uptrend. It dipped by almost 2%, hitting a low of $81,138.
Nonetheless, Bitcoin maintains its upward trajectory on the one-week scale. It gained over 2% last week and almost 3% in the last six days. The relative strength index on this scale has risen, indicating more buying pressure during the previous two weeks.
The one-day chart paints a more bullish picture of the apex coin’s performance. A few days ago, the moving average convergence divergence had a positive interception. The metric continues upward as trading conditions improve.
It is worth noting that the apex coin is trading above Bollinger’s middle band, which suggests further goodwill for the asset.
ETH/USD
Ethereum made a significant move on Wednesday, surging from $1,931 to $2,070. Its bullish start to the week saw it climb from $1,886 on Monday to $2k in three days. However, the uptick ended on Thursday following a sharp decline.
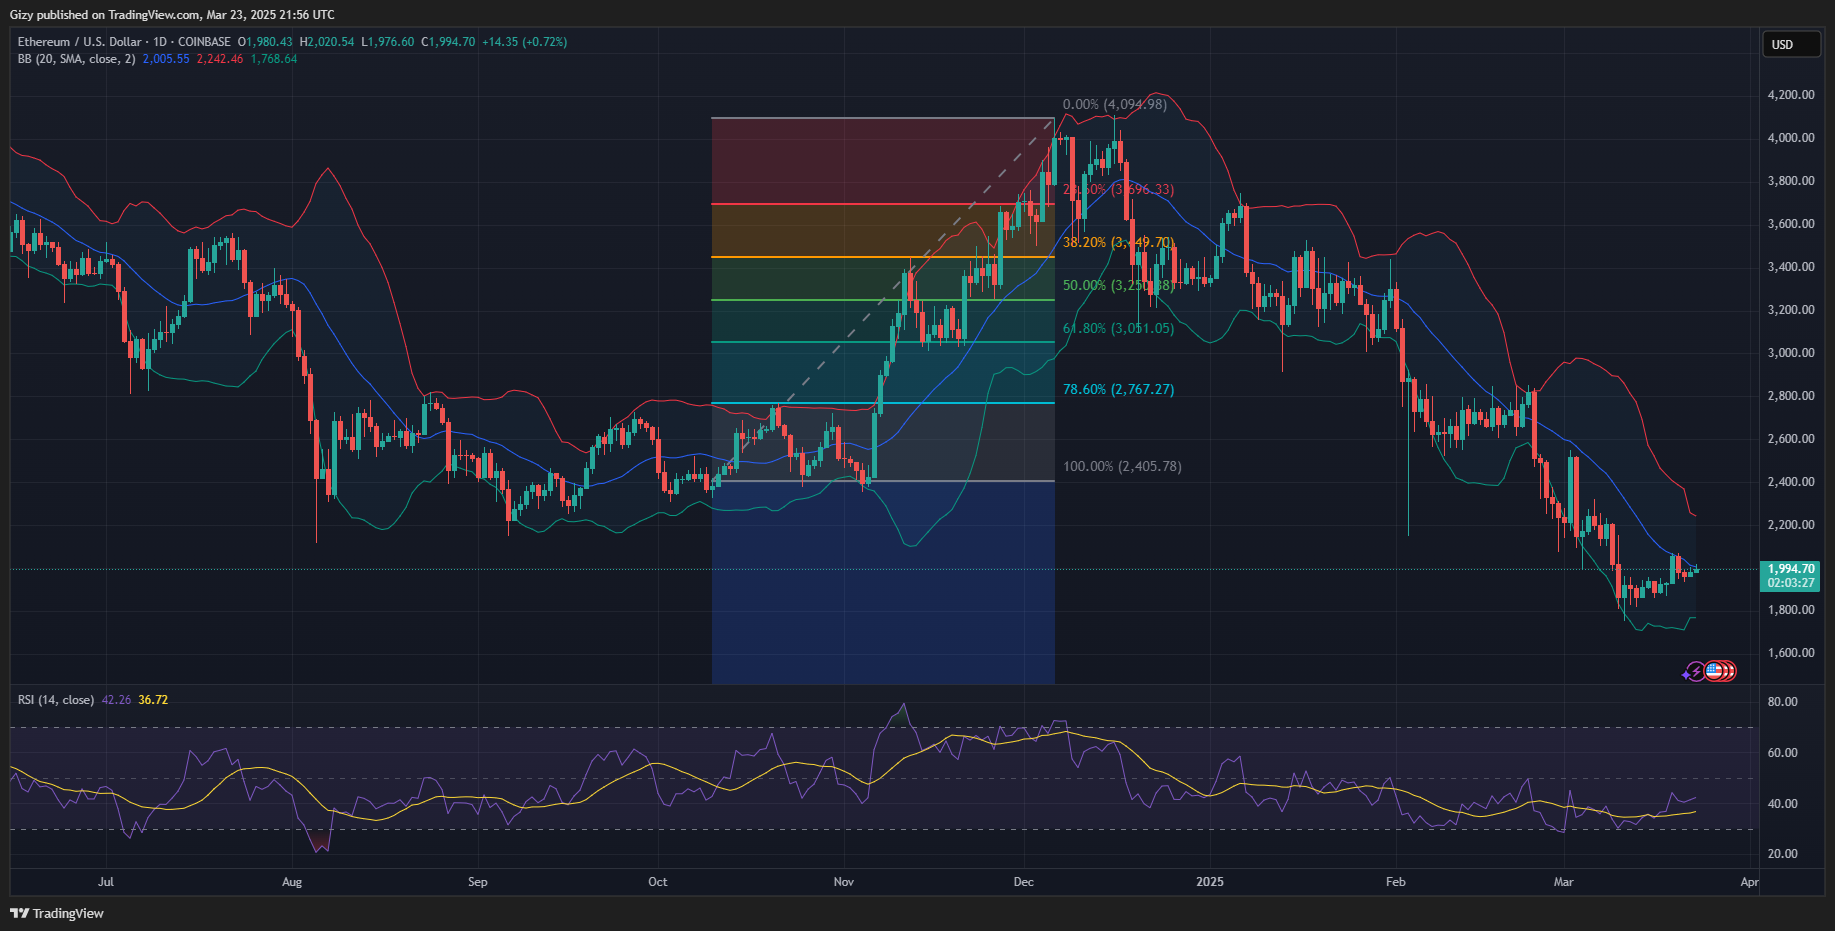
Nonetheless, the largest altcoin is heading for its first green close after three weeks of consistent declines. It is up by over 5% on the one-week scale, with indicators gradually flipping bullish. RSI was at 33 last week but surged higher following the previous six days’ performance.
The one-day chart reflects the improvement, as some metrics flipped bullish. A few days ago, MACD displayed a positive interception and continued upward as buying pressure surged.
The accumulation and distribution charts show the same reading. Nonetheless, ETH is trading close to its Bollinger middle band.
Data from DefiLlama shows that more traders are staking. This may be due to a slight increase in buying pressure. It may also indicate traders favoring long-term investments, as Ethereum’s short-term performance is bearish.
XRP/USD
XRP is on the verge of closing another week with significant increases. It recovered from a massive decline to below $2 last week and continued its recovery this week. The altcoin is up by over 4% over the last six days.

Wednesday’s price actions marked a major bullish push for the asset. It opened trading at $2.28 and broke the $2.50 support. It surged to a high of $2.59 and closed with gains exceeding 11%. Although it saw a 4% drop the next day, it trades close to the $2.40 barrier.
It shows signs of recovering with its slight price change at the time of writing. Nonetheless, the indicator on the one-day chart remains positive. MACD shows the 12-day and 26-day EMA on an uptrend following the previous bullish interception.
Other metrics, like the RSI and Bollinger band, show almost equal pressure between the bears and the bulls over the last three days. Due to the highlighted trend, the relative strength index remained close to 50. Price stayed close to the Bollinger middle band during this period.
BNB/USD
Binance coin struggled to continue its uptrend over the last six days. The coin surged by over 8% last week, hitting a high of $623. It had a good start on Monday, surging from $602 to $643, and closed with gains of almost 5%.
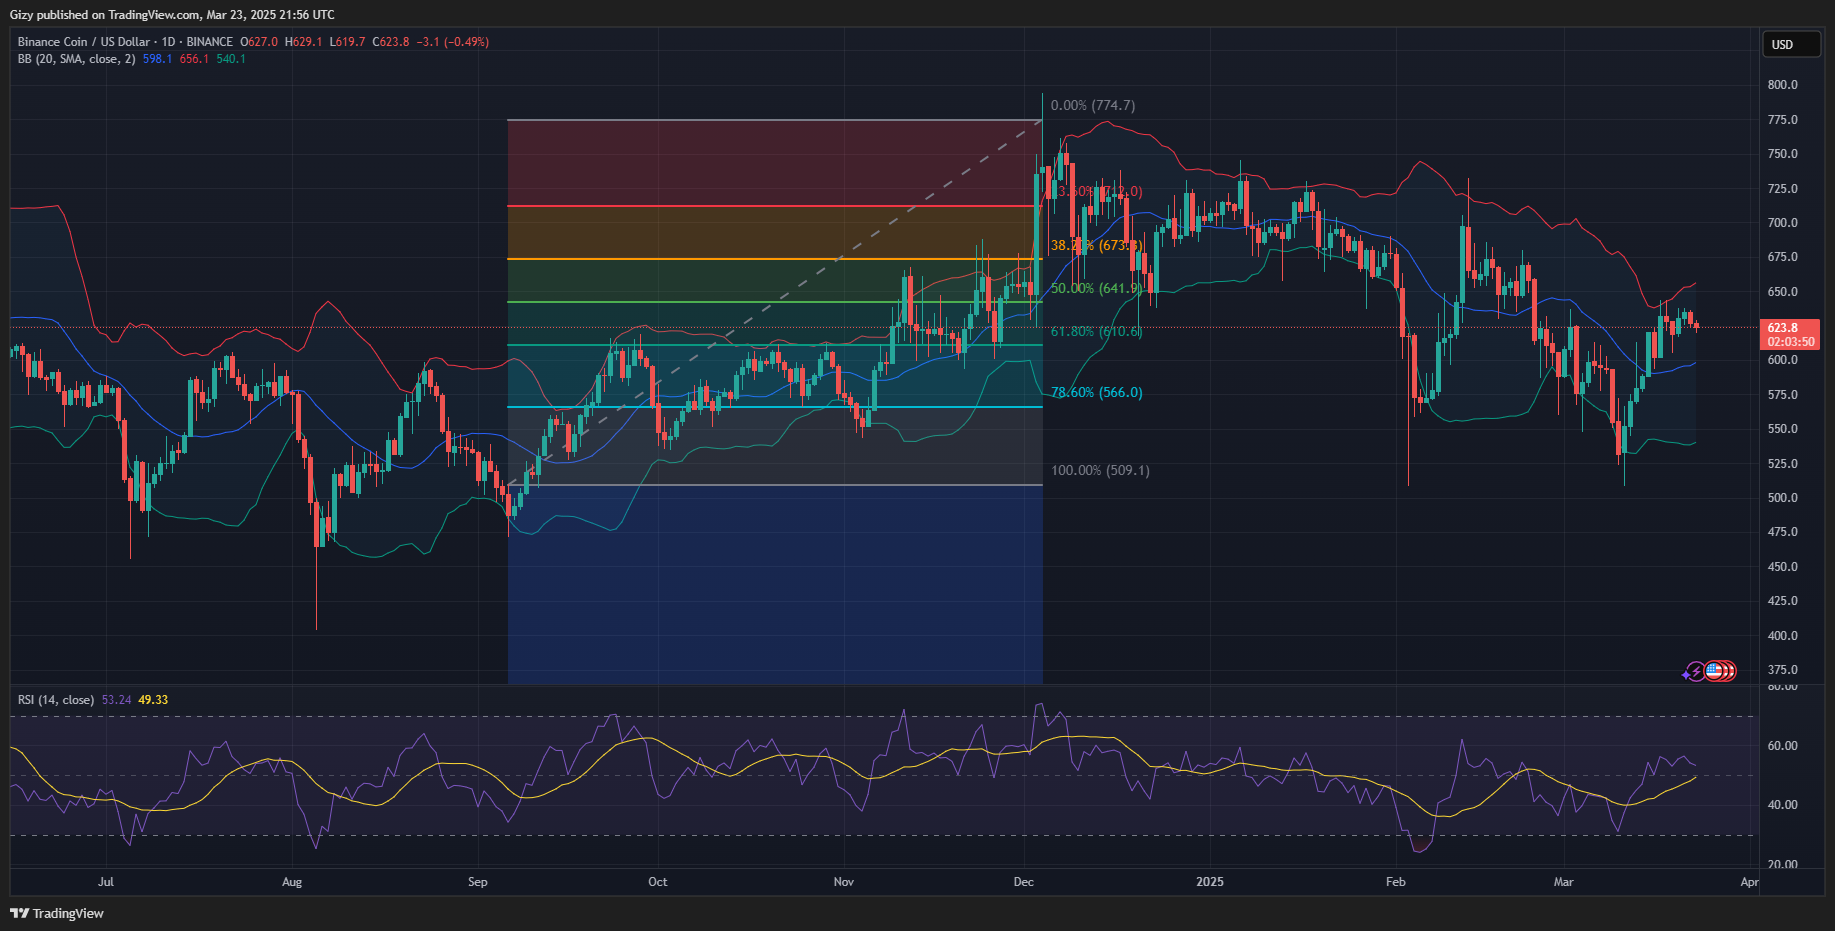
However, this was its only significant bullish push as it retraced over the next two days. Nonetheless, the one-day chart suggests it held the $620 support for most of the session. It is up by almost 4% on the one-week scale, with indicators pointing to further increases.
The moving average convergence divergence displays bullish signals amid the price trend. However, the 12-day EMA has slightly altered its trajectory. Further price decline may trigger the start of a bearish convergence.
The relative strength index shows growing selling pressure, slipping from 56 to 53. This is the same reading on the A/D chart.
SOL/USD
The one-week chart shows that Solana may end the week with significant increases for the first time in two weeks. The latest green candle follows a doji, indicating a gradual shift in traders’ sentiment. Up by almost 4%, it grapples with significant selling pressure at $130.
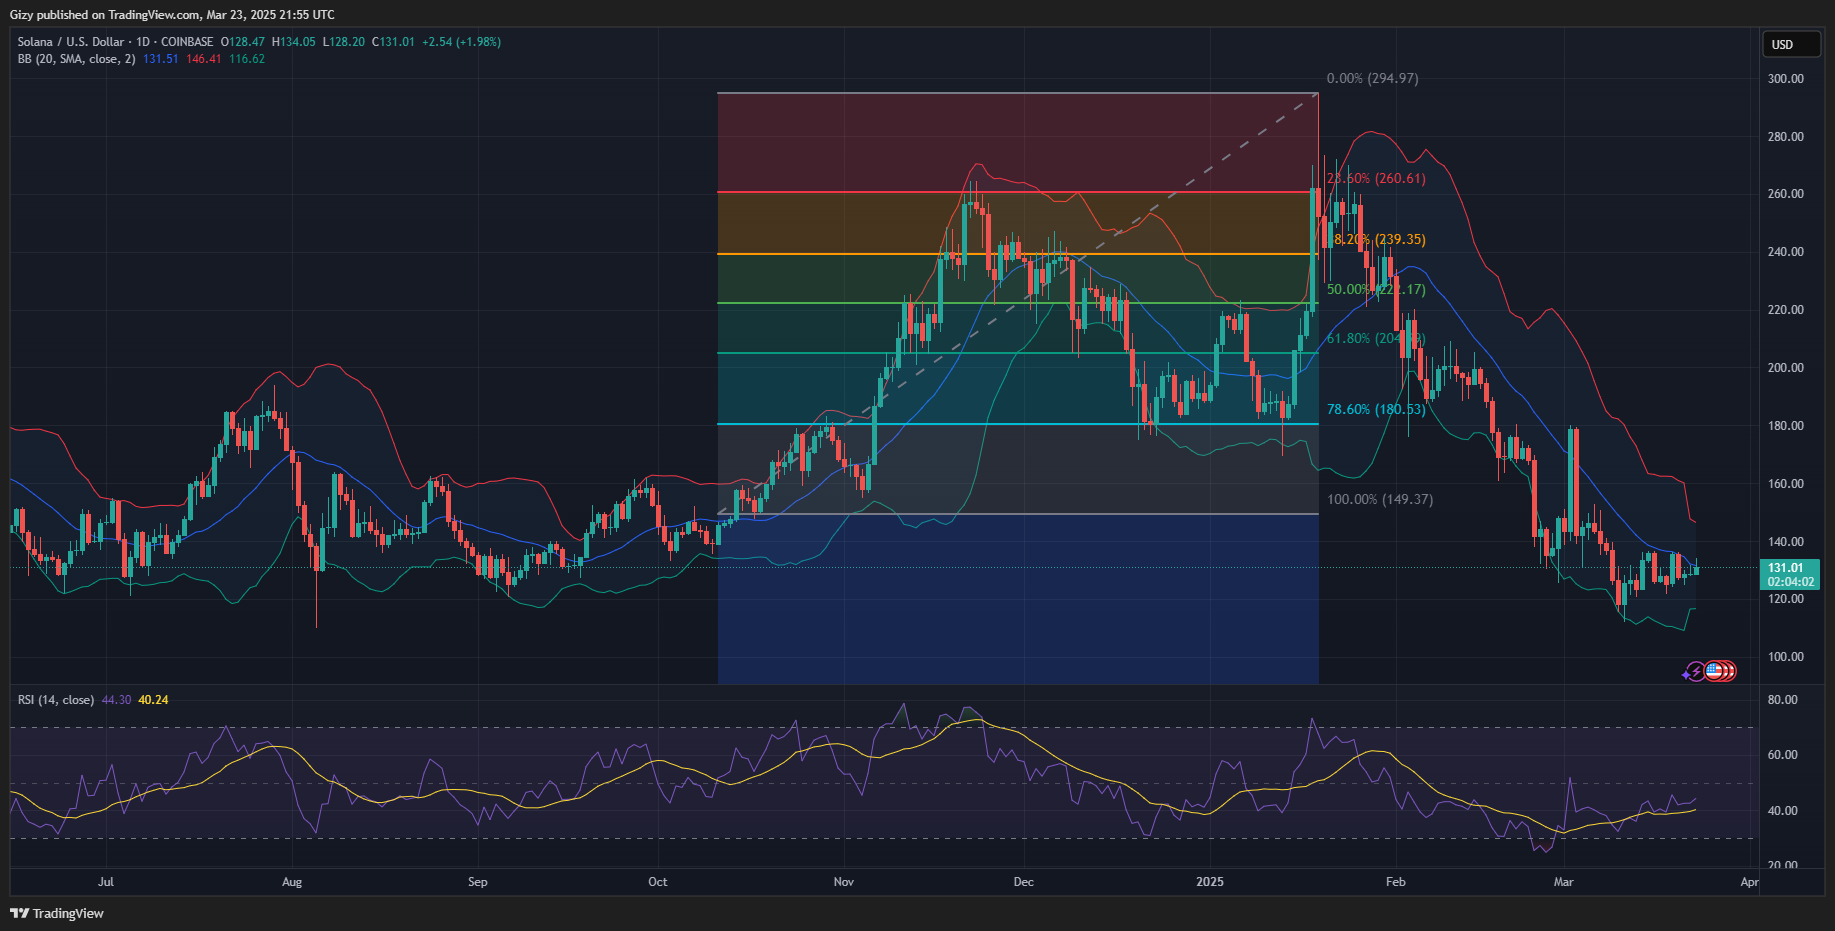
It remains slightly bullish on the one-day chart. The RSI was at 32 last week but surged higher following the last six days’ performance. It is trending at 44 at the time of writing, signifying a notable increase in buying pressure.
The moving average convergence divergence displayed a positive intercept a few days ago and continued upward as buying pressure surged.
The post Price Analysis 3/22: BTC, ETH, XRP, BNB, SOL appeared first on Cointab.
0
0


 Manage all your crypto, NFT and DeFi from one place
Securely connect the portfolio you’re using to start.


0
0