VeChain Surges Past 200-Day EMA, VET Eyes $0.060 Target

0
0

- VET briefly reclaims $0.030 level with 8.58% daily surge.
- Inverted head-and-shoulders pattern targets potential 88% rally.
- Open interest jumps 5.75% to $86.47 million amid bullish momentum.
VeChain has recorded a surge yesterday as broader crypto markets rally. The price action has enabled VET to break above its 200-day exponential moving average, currently trading at $0.029 after briefly reclaiming the $0.030 psychological level.
The daily chart reveals a potential inverted head-and-shoulders pattern taking shape, with the neckline positioned near $0.0327. This key resistance level aligns with the 23.60% Fibonacci retracement, creating a critical test for VeChain’s bullish momentum.
Following the 200-day EMA breakout, VeChain has formed three consecutive bullish candles, indicating sustained buying pressure. The breakthrough of this long-term moving average often signals a shift in market sentiment from bearish to bullish territory.
VeChain technical indicators support continued upside
The daily RSI has bounced off the halfway mark and crossed above its 14-day simple moving average, pointing toward higher levels. With the RSI line trending upward, the distance from the overbought zone indicates room for further growth before reaching exhaustion levels.
The 200-day EMA breakout increases the likelihood of positive momentum in the 50- and 100-day EMA lines, potentially leading to bullish crossovers that would strengthen the overall technical picture.
According to Fibonacci analysis, a successful pattern breakout would likely push VeChain past the 61.80% level at $0.055. Technical projections suggest an 88% rally potential to $0.061 by adding the pattern’s depth to the breakout point, representing a move from current levels near $0.029.
However, failure to break above the 23.60% Fibonacci resistance at $0.0327 could trigger a retest of the 50-day EMA support around $0.027.
The VeChain derivatives market has witnessed increased activity alongside the price surge. Open interest has jumped 5.75% to reach $86.47 million, indicating growing trader participation and position building.
The funding rate remains steady around 0.010%, signaling consistent bullish sentiment among perpetual contract traders. This stable funding rate suggests the rally has not yet reached speculative extremes that typically precede corrections.
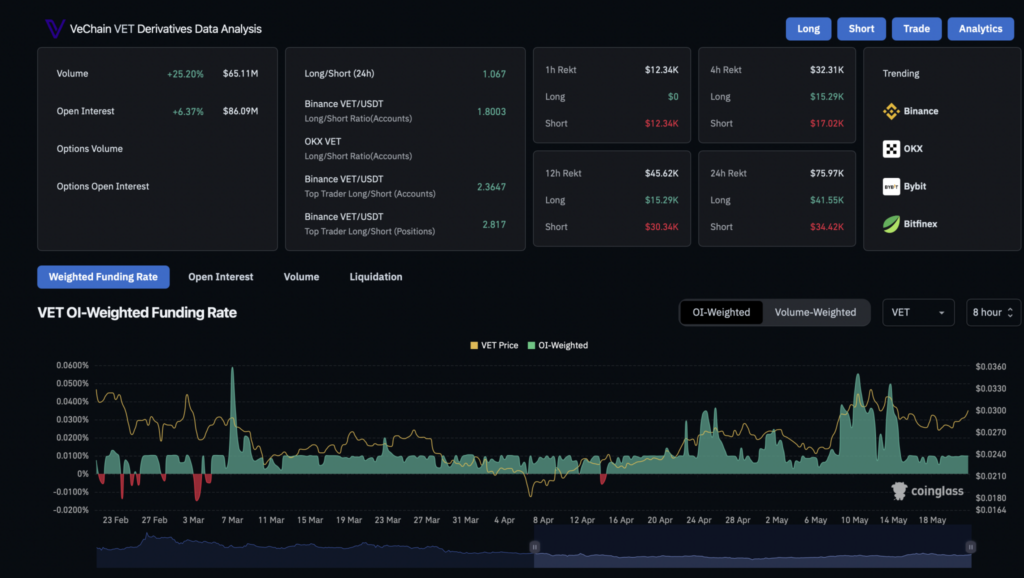
According to CoinGlass data, 64% of Binance accounts trading VET-USDT perpetual contracts maintain bullish positions on the altcoin. This creates a long-to-short ratio of 1.82 based on account distribution, reflecting widespread optimism among retail traders.
The bullish bias in derivatives positioning could support a leverage-driven rally if the technical breakout materializes. However, traders should note that the remaining 35% of short positions may command greater capital, potentially undermining the apparent long bias.
0
0

 Manage all your crypto, NFT and DeFi from one place
Securely connect the portfolio you’re using to start.

0
0


