
Chainlink Price Prediction: Fakeout Complete, Is LINK Ready to Rally?

0
0

Chainlink price prediction conversations are picking up after Chainlink pulled off a sharp reversal that caught short sellers off guard.
The 4-hour chart just flushed a chunk of liquidity below a key trendline invalidation zone before snapping back above it, and that kind of move tends to set the tone for what comes next.
Whether this turns into genuine follow-through or fades back into the range is the question traders are watching right now.
Chainlink Market Snapshot
Metric | Value |
Price | $8.38 |
24h Change | +0.67% (+$0.05584) |
Market Cap | $6.25B |
Futures Volume (24h) | $266.79M |
Spot Volume (24h) | $44.62M |
Open Interest | $425.33M |
Circulating Supply | 748.09M LINK |
Total Supply | 1.00B LINK |
Max Supply | 1.00B LINK |
Data from the LINK/USDT 4-hour chart on Binance via TradingView and the Chainlink market page on CoinGlass were captured on July 29, 2026, around 11:04 AM IST. Recheck live figures close to publish time since price and open interest shift fast.
Chainlink Liquidation Data
As per CoinGlass liquidation data, captured July 29, 2026, around 11:04 AM IST.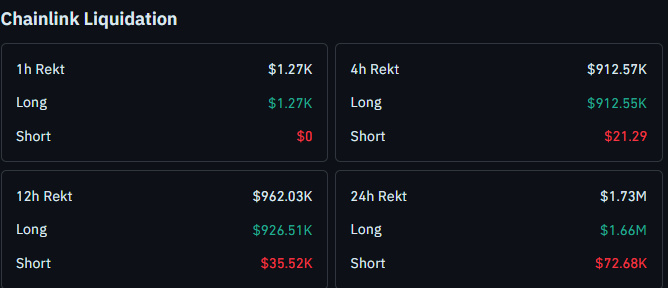
Long liquidations dominate across every window, which lines up with a market that just shook out overleveraged buyers on the dip before reclaiming the trendline rather than one facing broad seller conviction.
Chainlink Spot ETF Flows: Inflows Cool Off
As per SoSoValue, LINK spot ETF activity has gone quiet the last two sessions, with zero daily net inflows recorded on both July 27 and July 28, holding cumulative net inflows flat at $128.14M. 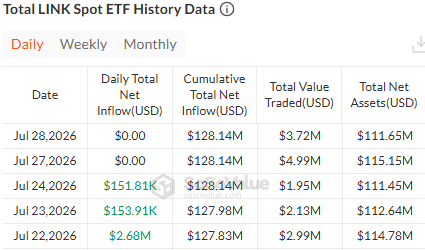
That follows a heavier week, including a $2.68M inflow on July 22 and $153.91K on July 23, which pushed total net assets from $114.78M up to a recent high near $115.15M before easing back to $111.65M.
Trading activity has also thinned out, with daily value traded dropping to just $3.72M on July 28 versus $4.99M the day before, suggesting demand is pausing rather than reversing for now.
Quick Take
LINK is trading near $8.38, having reclaimed its ascending trendline after a 4-hour liquidity grab below the invalidation zone
Bullish trigger: confirmed close above $8.764, opening room toward $9.312 and $9.686
Bearish trigger: confirmed close below $8.265, invalidating the buying view and opening room toward $8.006 and $7.789
This is a 4-hour read, so recheck these zones if price closes well beyond this range on a higher timeframe
Chainlink Technical Analysis
The 4-hour candle dipped through the ascending trendline's invalidation zone, swept the resting liquidity sitting below $8.265, and then closed back above that same zone, a classic bear trap that this LINK bear trap breakout coverage flags as one of the cleaner reclaim patterns on the chart right now.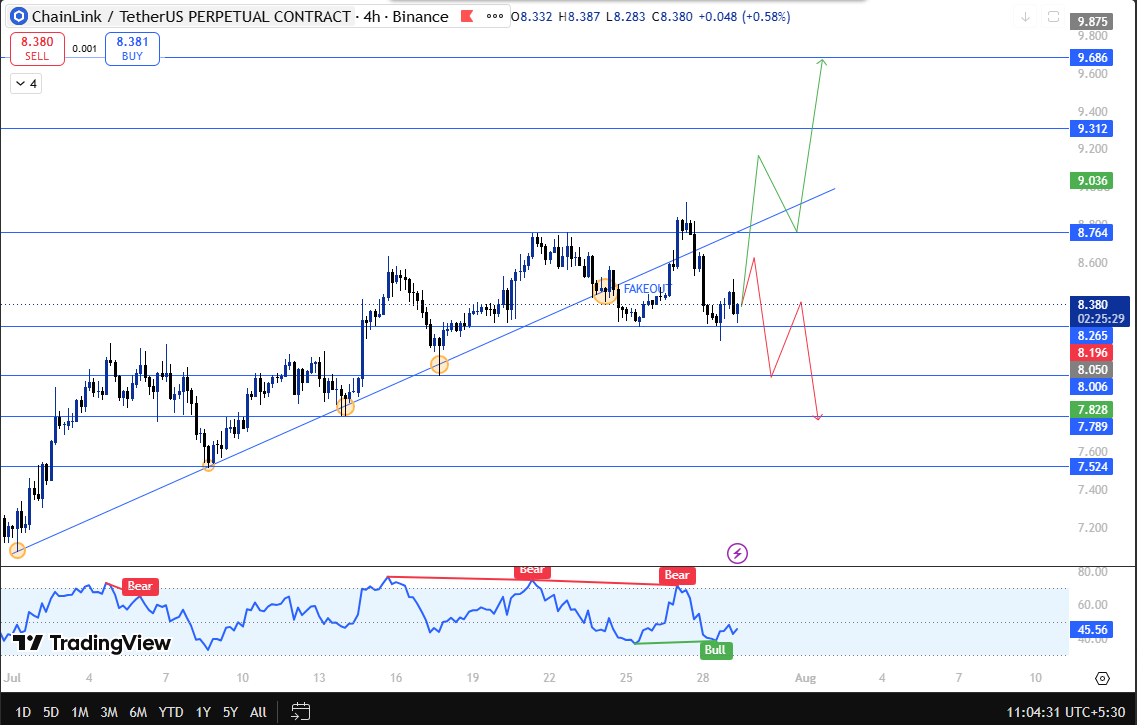
Now the focus shifts to the recent high near $8.764. If the price breaks that level and closes above it, the next resistance zone opens at $9.312, followed by $9.686 as the extended target, a level this LINK critical retest update is also watching.
On the downside, if the price breaks and closes below $8.265, that invalidates the buying view entirely and shifts attention to support at $8.006, with $7.789 as the deeper level if the pullback extends, a scenario covered further in this LINK trendline break piece.
As always, the closing price matters more than a wick. A brief spike above $8.764 or below $8.265 that gets reclaimed before the candle finishes does not confirm anything on its own.
Something this LINK trendline watch coverage also stresses, and the same liquidity grab and reclaim pattern showed up in our LINK retest before the rally piece, where a similar sweep preceded the next leg higher.
LINK Support And Resistance Levels
Level | Price | Note |
Resistance 2 | $9.686 | Extended target on continued breakout |
Resistance 1 | $9.312 | First target after clearing $8.764 |
Breakout Trigger | $8.764 | Needs a confirmed close |
Current Price | $8.38 | Just reclaimed the trendline |
Breakdown Trigger | $8.265 | Needs a confirmed close |
Support 1 | $8.006 | First support if $8.265 breaks |
Support 2 | $7.789 | Deeper support level |
Risk-Reward Table
Case | Trigger | Target |
Bull Case | Close above $8.764 | $9.312 toward $9.686 |
Bear Case | Close below $8.265 | $8.006 toward $7.789 |
Invalidation: This bullish structure holds only as long as LINK keeps closing above $8.265.
A confirmed close below that undoes the reclaim and shifts focus toward $8.006 and $7.789, while a close above $8.764 confirms strength and opens the path toward $9.312 and $9.686.
A continuation of this LINK institutional buzz update and this double confirmation piece are also tracking.
Expert View
Traders following this LINK price prediction note that a liquidity sweep followed by a same-candle reclaim is typically a bullish tell rather than a warning sign, especially with liquidations still skewed toward longs getting flushed on the dip instead of a broad distribution pattern.
The setup still needs $8.764 or $8.265 to actually give way on a closing basis before either case is confirmed.
Disclaimer
This article is for informational purposes only and does not constitute financial advice. Cryptocurrency markets are highly volatile. Please verify current data independently and consult a licensed financial advisor before making any investment decisions.
0
0

 Manage all your crypto, NFT and DeFi from one place
Securely connect the portfolio you’re using to start.


0
0

0
0
