
Dogecoin Price Prediction: Is DOGE's Bull Run Just Getting Started?

0
0

This Dogecoin price prediction starts with a bit of background: Dogecoin launched in December 2013, created by software engineers Billy Markus and Jackson Palmer as a lighthearted, meme-inspired take on Bitcoin, built around the popular "Doge" Shiba Inu internet meme.
What started as a joke quickly built a genuinely active community, and $DOGE went on to become one of the earliest and most enduring meme coins in crypto long before "meme coin" was even a widely used term.
Unlike Bitcoin's capped 21 million supply, Dogecoin runs on an inflationary, unlimited-supply model, with roughly 5 billion new coins added each year. It uses a proof-of-work consensus mechanism, similar to Litecoin, which it is merge-mined with.
Over the years, DOGE has been kept in the spotlight repeatedly by celebrity endorsements, most notably from Elon Musk, and by periods of massive retail-driven rallies, including its explosive run during 2021.
Today, DOGE is currently trading around $0.08314 right now, up 2.6% on the day.
Market cap works out to roughly $12.95 billion, keeping Dogecoin near rank #11 among all cryptocurrencies.
The rest of this Dogecoin price prediction breaks down where DOGE might go from here.
Live Market Data
Metric | Value |
Price | $0.08314 |
24h Change | +2.6% |
24h Range | $0.08021 – $0.08359 |
Market Cap | $12.95B |
Fully Diluted Valuation | $14.256B |
24h Trading Volume | $636.284M |
Circulating Supply | 155.759B |
Total Supply | 171.472B |
Max Supply | ∞ |
Source: DOGE market cap data taken from CoinGecko, data as of Sep 03, 2026. Figures may vary slightly across other tracking websites.
Exchange Volume
Most of DOGE's futures volume is concentrated on a handful of exchanges. Binance leads by a wide margin at $456.85M over 24 hours, with OKX ($231.83M) and Bybit ($124.86M) next in line.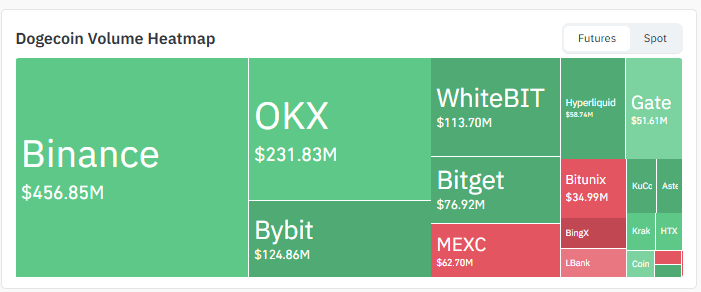
Source: Volume Heatmap Data Taken From CoinGlass, As of Sep 3, 2026
WhiteBIT adds another $113.70M, followed by Bitget at $76.92M and MEXC at $62.70M. Hyperliquid, Gate, Bitunix, BingX, KuCoin, LBank, Kraken, and HTX fill out the rest, each somewhere between $5M and $59M.
That kind of depth across so many exchanges points to strong, broad-based liquidity behind the recent move.
Liquidation Snapshot
The 24-hour window shows longs took the bigger hit overall, $1.42M in long liquidations against $619.98K in shorts, out of $2.04M total.
That points to a sharp drop earlier in the day that caught over-leveraged buyers off guard.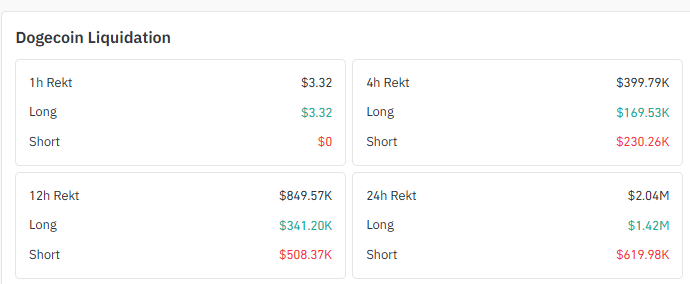
Source: Liquidation Data Taken From CoinGlass, As of Sep 3, 2026
But the more recent windows tell a different story. Over the last 12 hours, shorts got squeezed instead, with $508.37K liquidated versus $341.20K in longs.
And in the last 4 hours, shorts again took the bigger hit, $230.26K to $169.53K in longs.
Put together: a hard drop earlier in the day flushed out longs, followed by a sharp recovery that's now squeezing shorts. That lines up closely with the shift from a descending channel into a fresh ascending one on the chart.
Dogecoin News
Trader Tardigrade highlighted a fresh MACD bullish cross on Dogecoin's 2-week chart, calling it the first major signal of a trend reversal after an extended weak phase and suggesting a bull run structure could now be forming.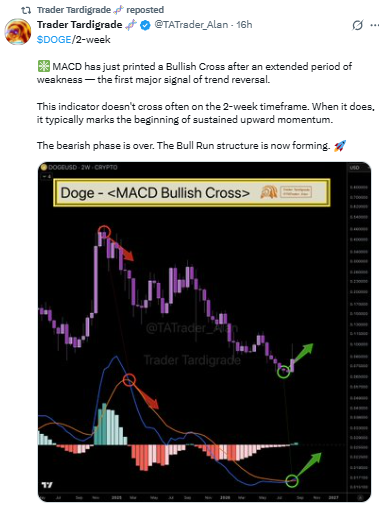
Source: Data Taken From @TATrader_Alan, X Account, As of Sep 03, 2026
Elsewhere, sentiment isn't universally bullish. A widely shared Polymarket-linked post noted that bettors are giving Dogecoin only a 6% chance of rising above $0.40 within 2026, a reminder that near-term technical optimism and longer-term market pricing can diverge sharply.
Source: Data Taken From @BSCNews, X Account, As of Sep 03, 2026
Both posts are worth weighing against each other rather than in isolation; one reflects short/medium-term chart momentum, the other reflects a much longer-horizon market bet.
Technical Analysis
Dogecoin From Descending to Ascending Channel
Zoom in on the 1-hour chart, and DOGE spent a good stretch sliding lower inside a clean descending channel.
That changed when the price broke through the channel's upper boundary with a strong push, and since then it's been climbing inside a brand-new ascending channel.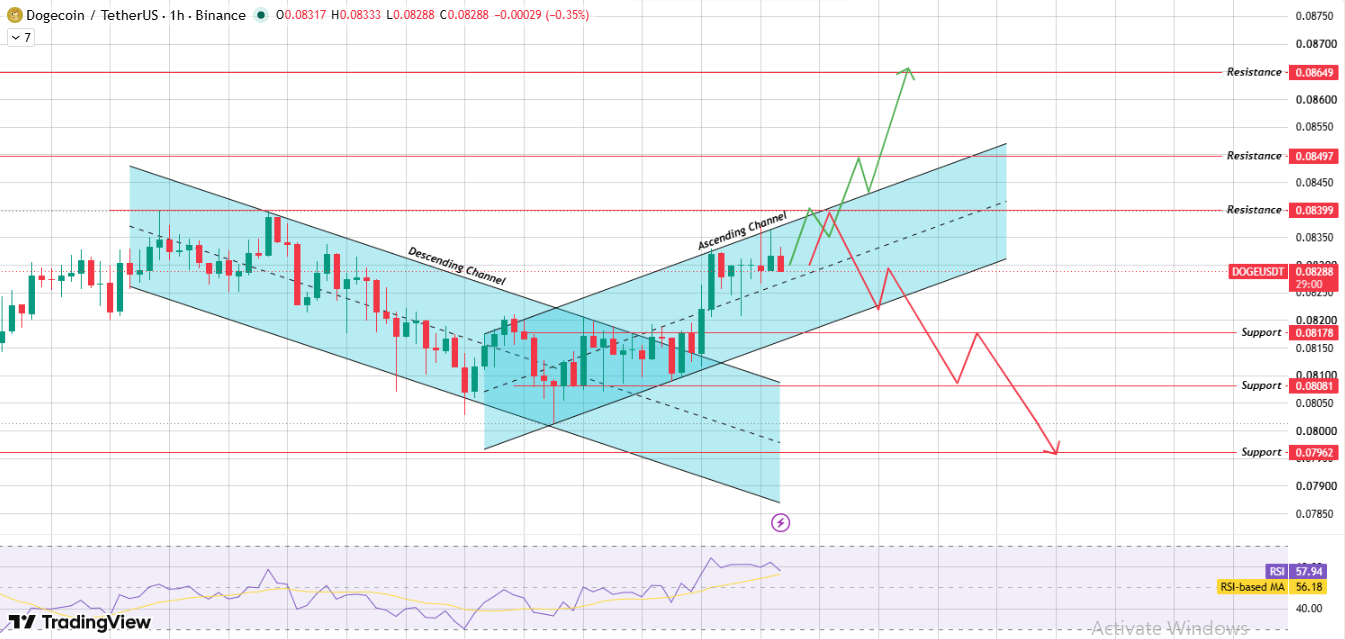
Source: Chart Taken From TradingView, As of Sep 3, 2026
Buyers have kept showing up along the rising lower trendline of this new channel, which is a good sign for near-term structure.
Price is currently sitting inside the channel, working its way toward the resistance zone around $0.08399.
Momentum Check
RSI is reading 57.94, sitting just above its own moving average of 56.18.
That's a moderately bullish reading, not overbought, but clearly on the stronger side of neutral, which fits with the recent breakout and short squeeze seen in the liquidation data.
There's also a broader tailwind here: a widely shared MACD bullish cross on the 2-week timeframe is being flagged by traders as a possible early signal of a longer trend reversal, following an extended period of weakness. 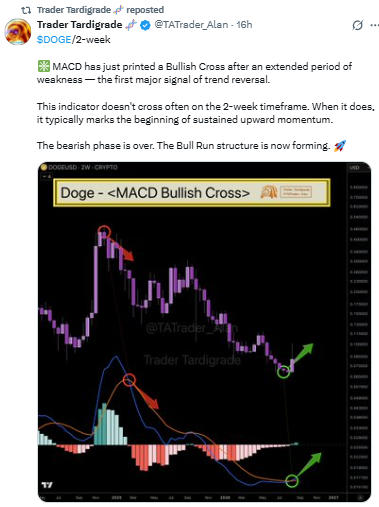
Source: Data Taken From @TATrader_Alan, X Account, As of Sep 03, 2026
That's a longer-horizon signal, though, and shouldn't be read as confirmation for what happens on the 1H chart in the next few hours.
Breakout and Rejection Scenarios
Here's the setup for continued upside: DOGE holds inside the ascending channel and breaks above its upper boundary with strength.
That would put $0.08497 in play first, with $0.08649 as the next resistance level above it in this DOGE price prediction.
The other side looks different. If price gets rejected at the channel's upper boundary and slides back down to the lower boundary, a clean break below that rising trendline would signal the ascending structure has failed.
In that case, $0.08178 is the first support to watch, followed by $0.08081 and then $0.07962 if selling pressure builds.
Support and Resistance Levels (1H Chart)
Level Type | Price |
Resistance 3 | $0.08649 |
Resistance 2 | $0.08497 |
Resistance 1 | $0.08399 |
Support 1 | $0.08178 |
Support 2 | $0.08081 |
Support 3 | $0.07962 |
Levels reference the 1-hour candle close on the DOGE/USDT chart, Binance, UTC.
Bull, Base, and Bear Case for DOGE
Scenario | Trigger | Price level |
Bull Case | DOGE holds the ascending channel's rising support and breaks above the upper boundary near $0.08399. | $0.08497, then $0.08649 |
Base Case | DOGE continues to oscillate inside the ascending channel, holding between the rising lower trendline and upper resistance. | Range-bound between channel support and $0.08399 |
Bear Case | Price is rejected at the channel's upper boundary and closes below its rising lower trendline. | $0.08178, then $0.08081, then $0.07962 |
Glossary
Ascending Channel: Two upward-sloping trendlines running roughly parallel, with price bouncing between them. Traders lean on the lower line for support and the upper one as a resistance zone to watch.
Descending Channel: The opposite structure has two downward-sloping trendlines, with price sliding lower between them until it breaks out in either direction.
RSI: Short for Relative Strength Index. It's a 0-100 oscillator built to measure how fast and how far price has moved recently, and it's most useful for spotting when a move has gotten overextended.
MACD Bullish Cross: A signal that occurs when the MACD line crosses above its signal line, often used by traders to spot potential shifts in trend direction, especially on longer timeframes.
Getting liquidated means a leveraged futures position gets force-closed because there isn't enough margin left to cover the loss. When liquidations pile up heavily on one side, the resulting scramble to close out can push price further in that same direction.
Disclaimer: This Dogecoin price prediction draws on technical chart analysis and publicly available market data, and it isn't financial advice. DOGE is volatile, and price could fall well below the support levels covered here if broader market conditions sour. Past patterns and indicator signals don't guarantee what happens next, and actual price action may look nothing like the scenarios above. Do your own research and weigh your own risk tolerance before acting on any of this.
0
0


 Manage all your crypto, NFT and DeFi from one place
Securely connect the portfolio you’re using to start.


