Why Is the Crypto Market Down Today?

0
0


The second week of May has opened with a slight dip in trading activity across the crypto market. Bitcoin (BTC) has mirrored the broader trend with a 1% drop over the same period. Ethereum Name Service (ENS) has emerged as the day’s top loser, underperforming the top 100 cryptos with a steep decline.
In the news today:
- Binance, the world’s largest crypto exchange, has entered into a strategic partnership with Kyrgyzstan’s National Investment Agency. The collaboration aims to accelerate the adoption of crypto payments across the country while promoting nationwide digital finance education.
- Phishing scams in crypto grew more sophisticated in April 2025, with attackers stealing over $5.2 million, despite a 17% drop in total losses from March. However, the number of victims rose sharply by 26%, affecting 7,565 users.
Crypto Market Faces Pressure
On Monday, the total crypto market capitalization (TOTAL) is down by approximately 1%, signaling a modest pullback in investor sentiment. This decline comes even as market participants continue to weigh macroeconomic factors and upcoming inflation data.
As of this writing, the market cap stands at $2.91 trillion, having shed $26 billion of its value during that period.
TOTAL currently holds above the $2.89 trillion support level, but strengthening bearish pressure makes a drop below this threshold increasingly likely. If sentiment worsens and TOTAL breaks this key level, the crypto market cap could decline further toward $2.85 trillion.
 Total Crypto Market Cap Analysis. Source: TradingView
However, a resurgence in bullish bias will prevent this. If market-wide demand soars, TOTAL could resume its uptrend and climb to $3.02 trillion.
BTC Price Slips as Bearish Signal Returns
BTC’s price has trended downward since briefly trading at an intraday high of $97,895 on May 2. As of this writing, the leading cryptocurrency trades at $94,659, witnessing a 3% pullback in its value over the past three days.
On the daily chart, readings from the coin’s Parabolic Stop and Reverse (SAR) indicator confirm the spike in selling pressure. At press time, the indicator is positioned above BTC’s price, acting as resistance for the first time since April 11.
The Parabolic SAR indicator helps identify potential reversal points by placing dots above or below the price chart. When the dots appear above the price, it signals a bearish trend, suggesting downward momentum and potential selling pressure.
In this case, BTC risks falling to $92,048. Should this level fail to hold, the coin could slide further to $87,908.
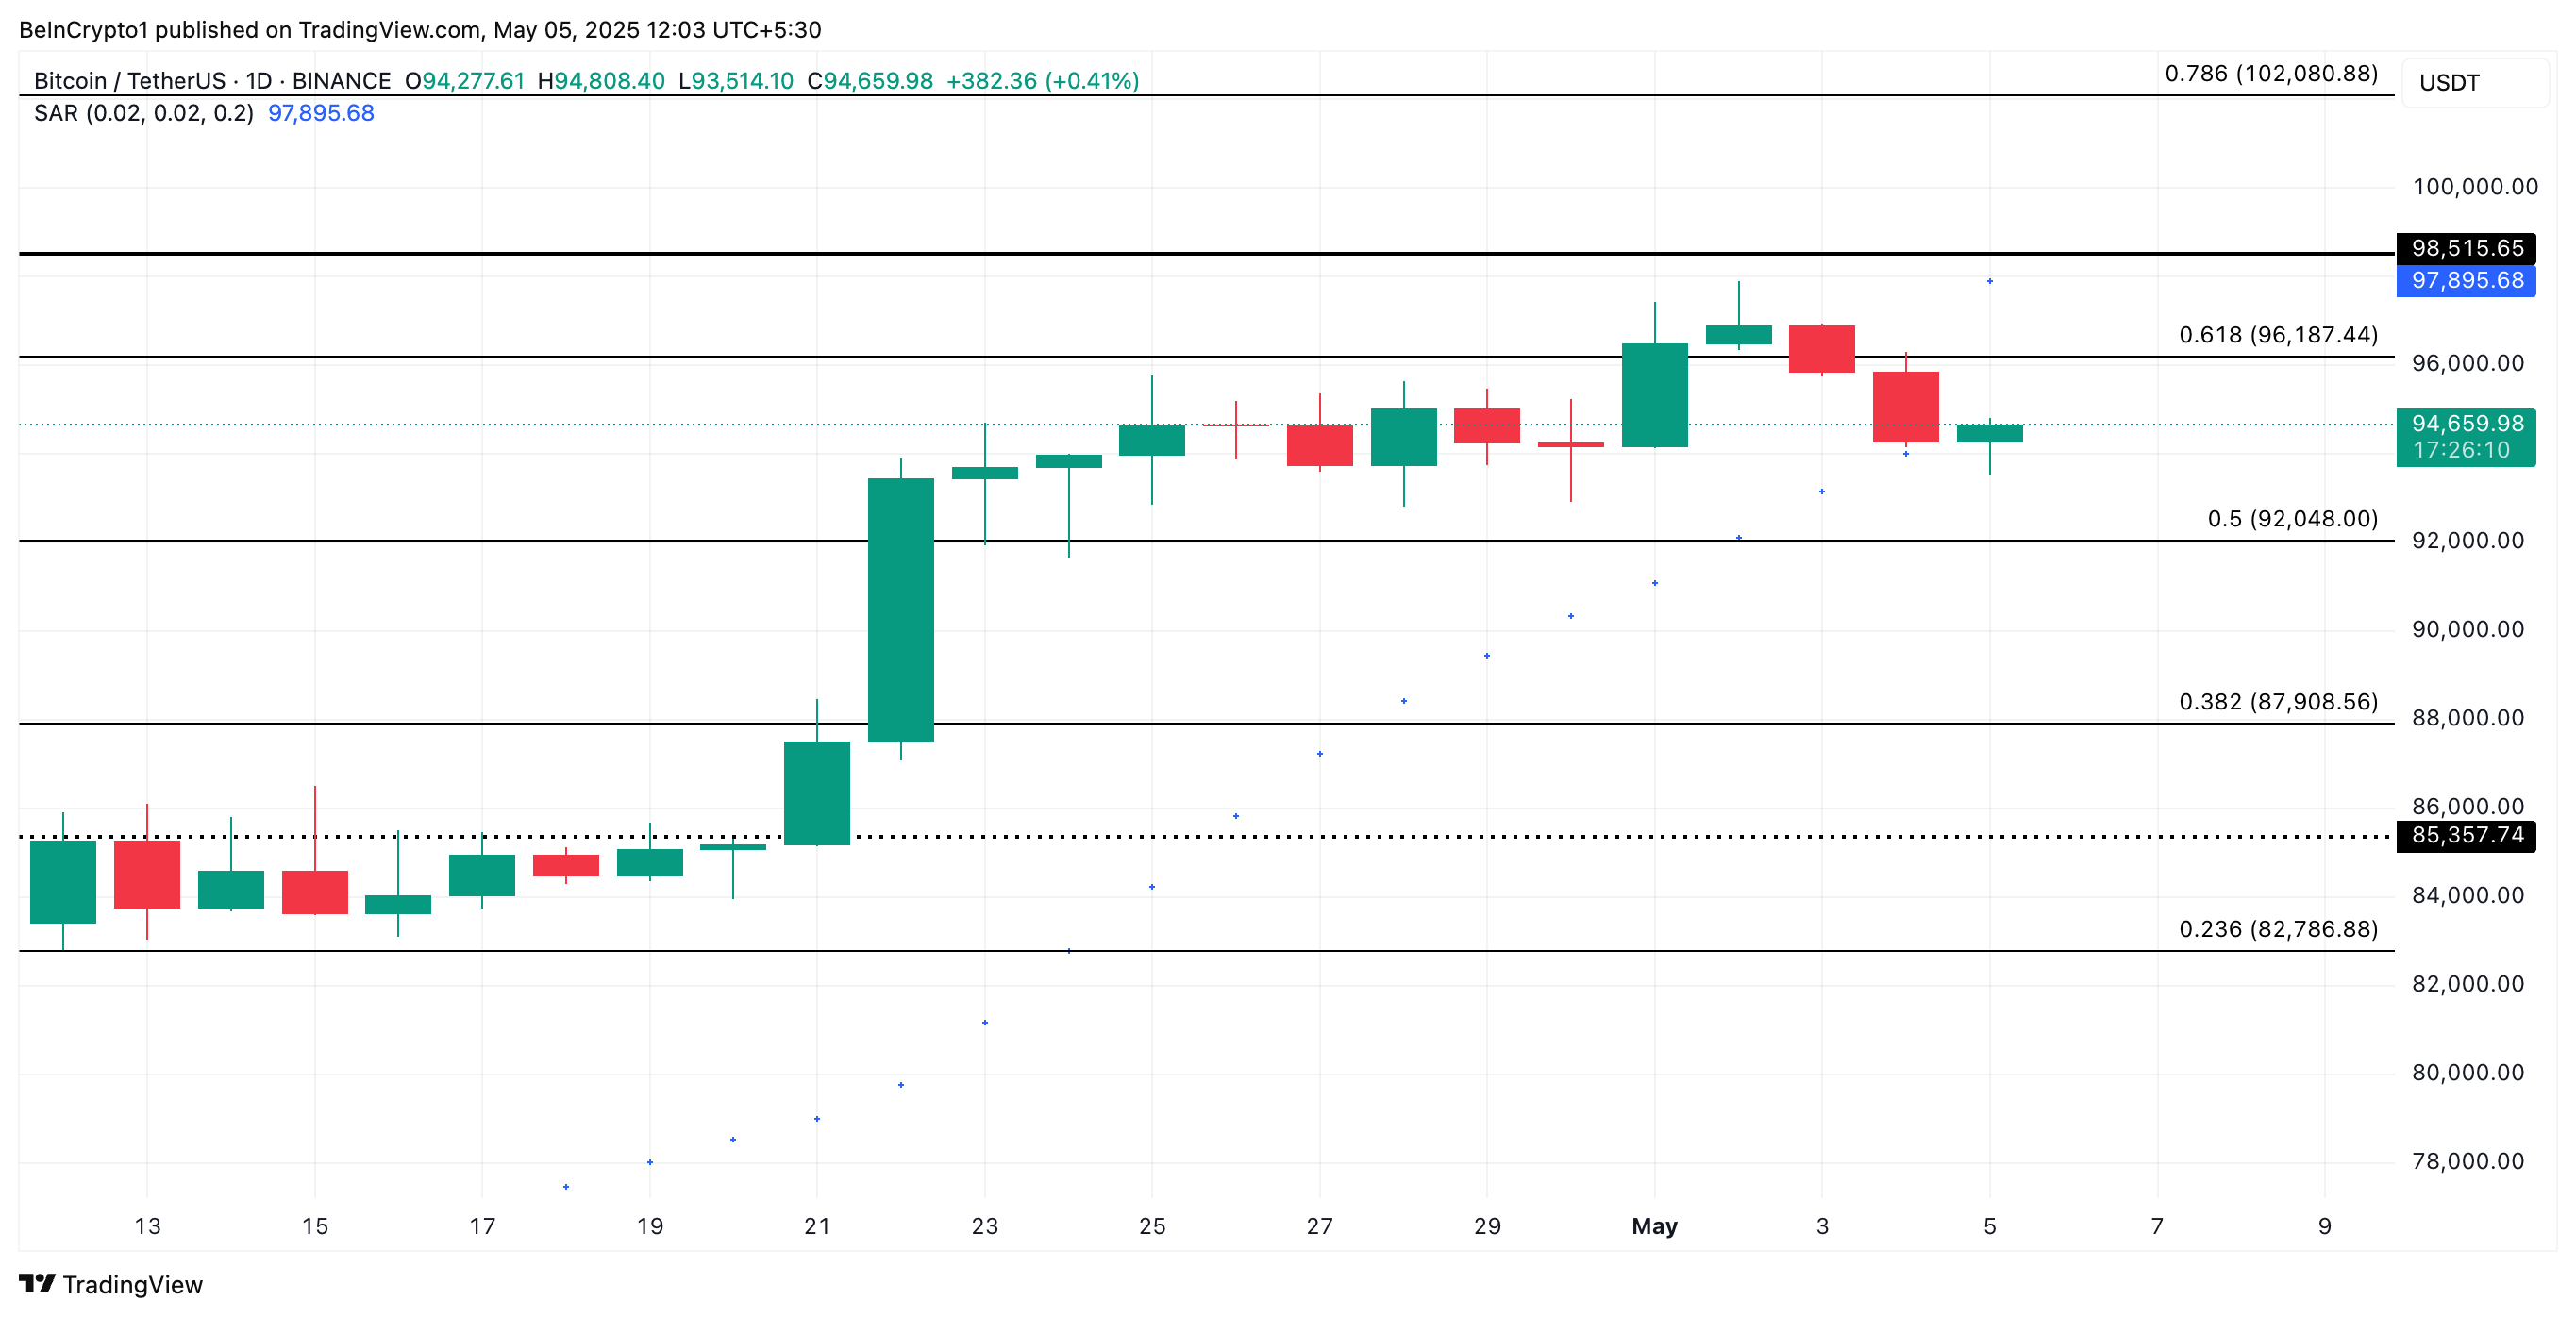 Bitcoin Price Analysis. Source: TradingView
Converesly, new demand entering the BTC market could drive the coin’s value to $96,187.
ENS Leads Market Losses With 7% Drop
ENS, the native token of Ethereum Name Service (ENS), a decentralized naming system built on the Ethereum blockchain, is down 7% today, making it the market’s top loser.
Technical readings show its Chaikin Money Flow (CMF) below the zero line, highlighting the market’s selling pressure. As of this writing, this momentum indicator, which measures an asset’s money flow, is at -0.04.
A negative CMF reading such as this indicates that selling pressure outweighs buying pressure, suggesting capital flows out of ENS. This signals weakening bullish momentum and could precede further price declines for the altcoin.
If buying pressure remains weak, ENS could break below $16.86 and fall to $14.38.
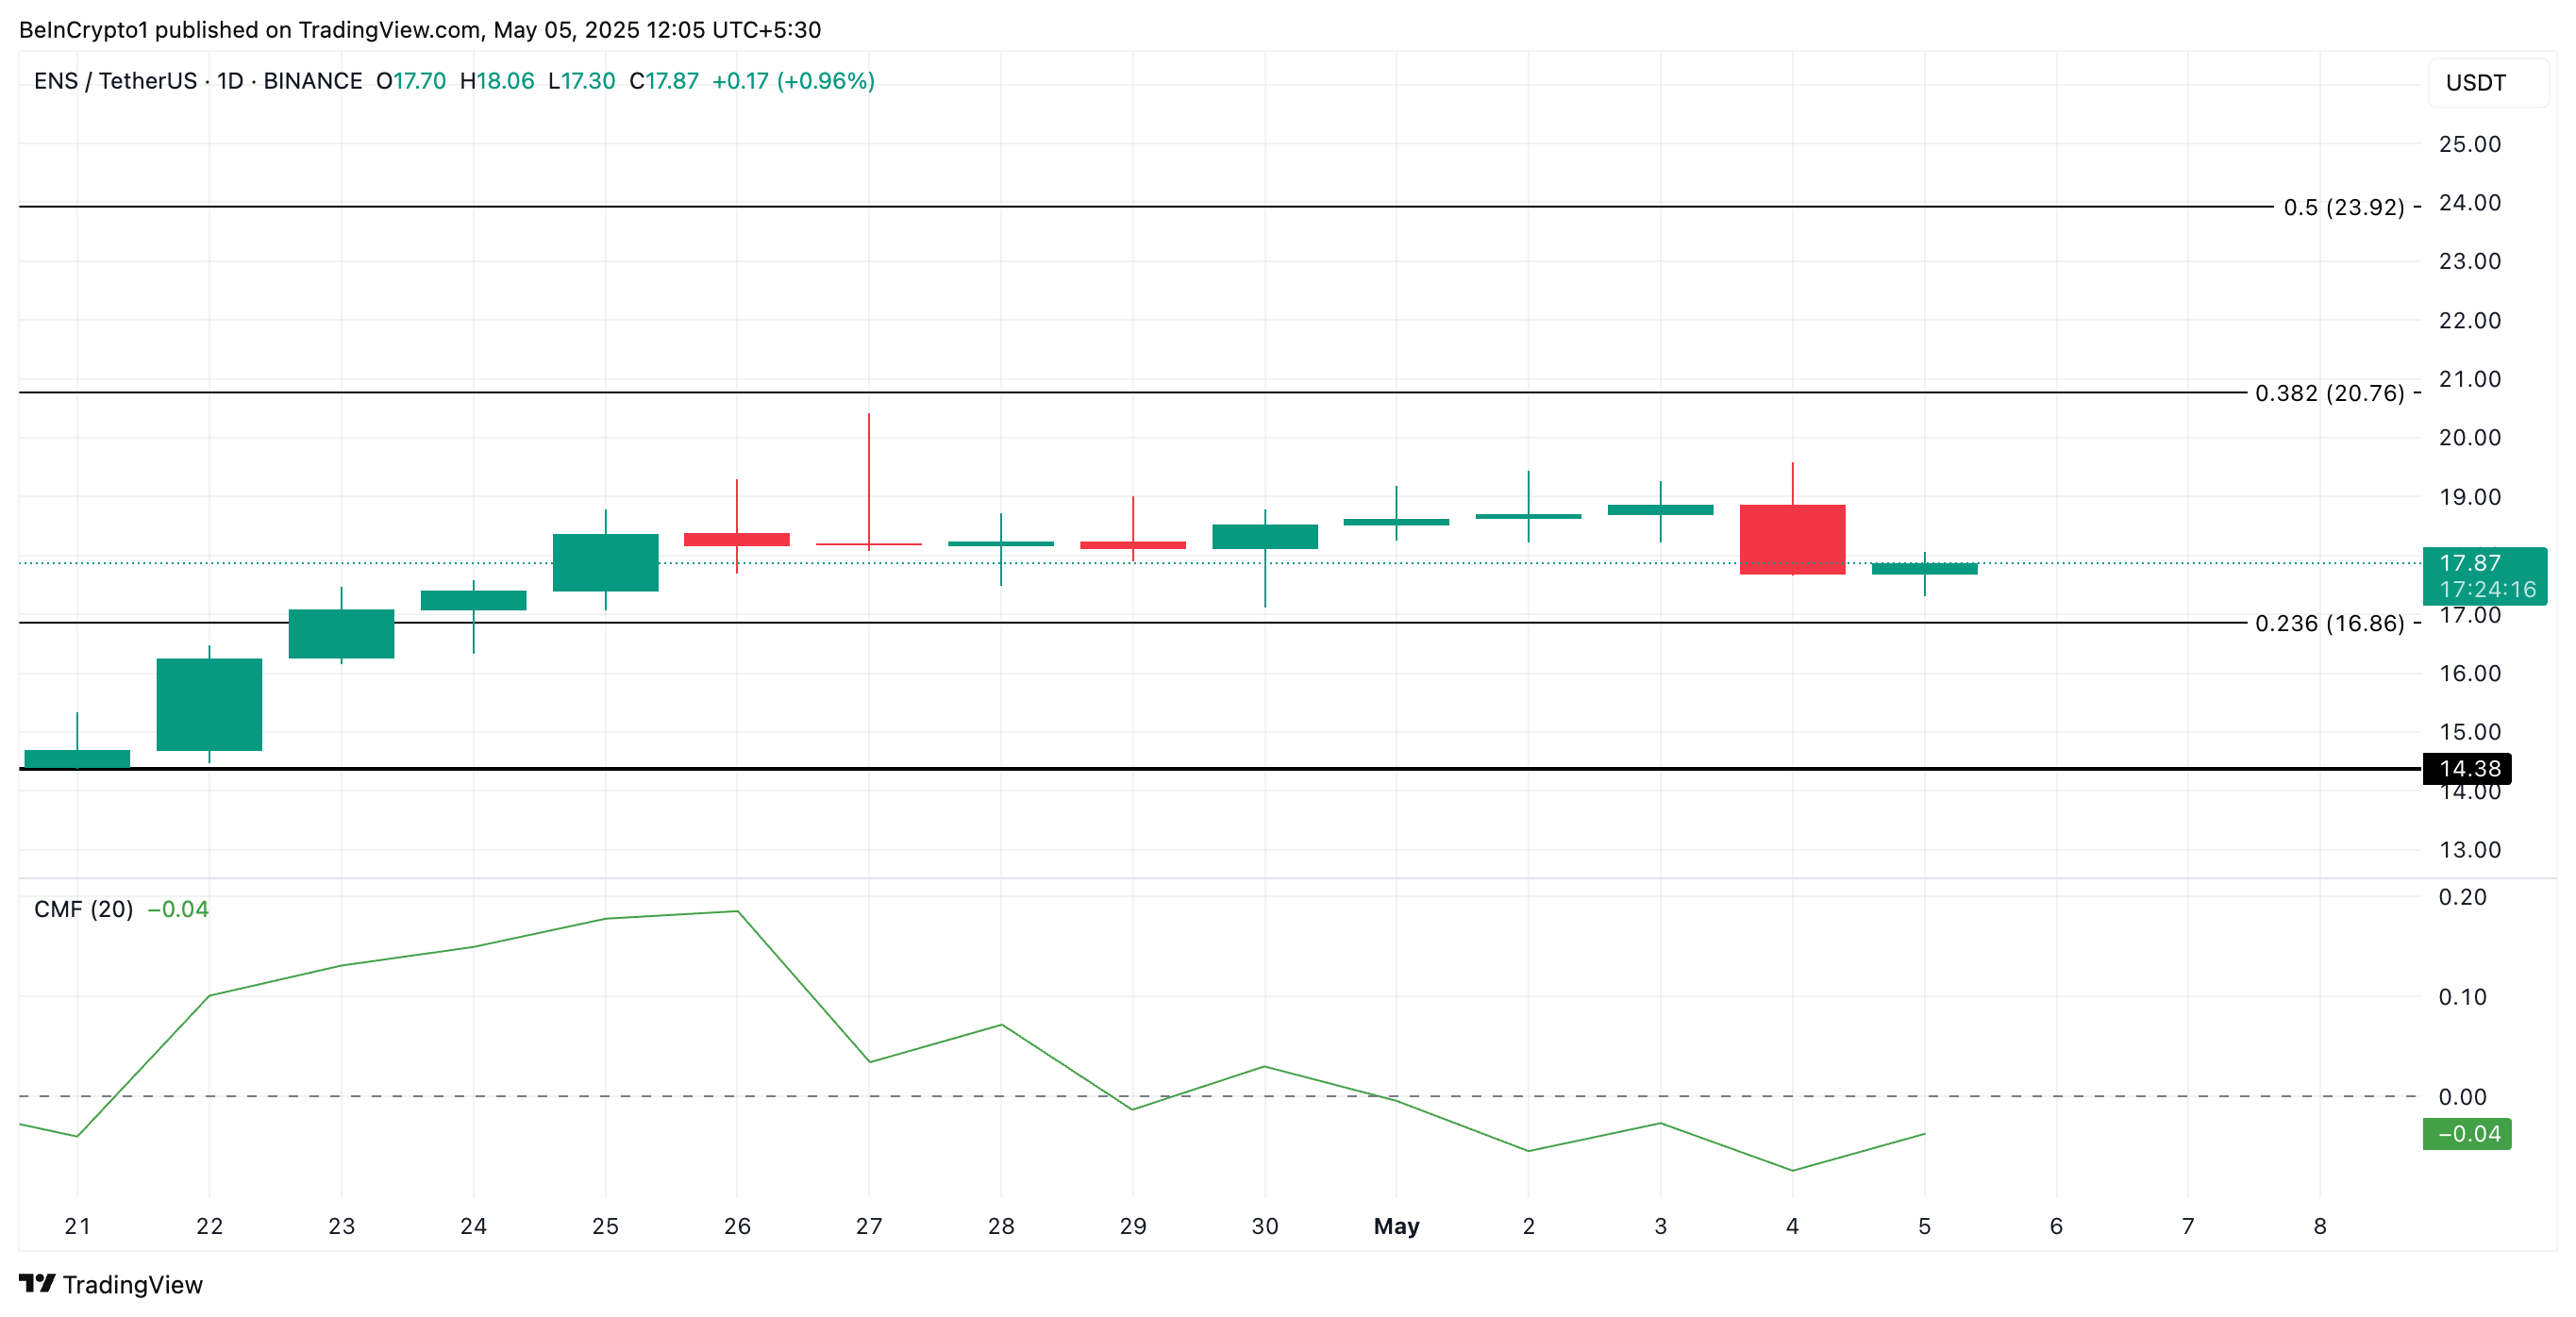 ENS Price Analysis. Source: TradingView
On the other hand, if buyers regain market control, they could drive ENS’ value up to $20.76.
0
0


 Manage all your crypto, NFT and DeFi from one place
Securely connect the portfolio you’re using to start.


