Bitcoin ETFs Just Had Their Darkest Week Yet

0
0


Bitcoin (BTC)’s brutal correction is now hitting one of the market’s most important demand engines. Spot Bitcoin exchange-traded funds (ETFs) recorded their worst week since launch, as investors pulled billions of dollars and BTC slipped toward the $60,000 level. The outflow streak comes as the crypto market struggles with heavy liquidations and growing uncertainty across risk assets.
Bitcoin ETFs Post Record $1.72 Billion Weekly Outflow
According to the latest data from SoSoValue retrieved on June 8, U.S. spot Bitcoin ETFs recorded $1.72 billion in net outflows during the past week. The figure marks the largest weekly withdrawal since the products launched and extends a four-week losing streak that has erased billions from the sector.
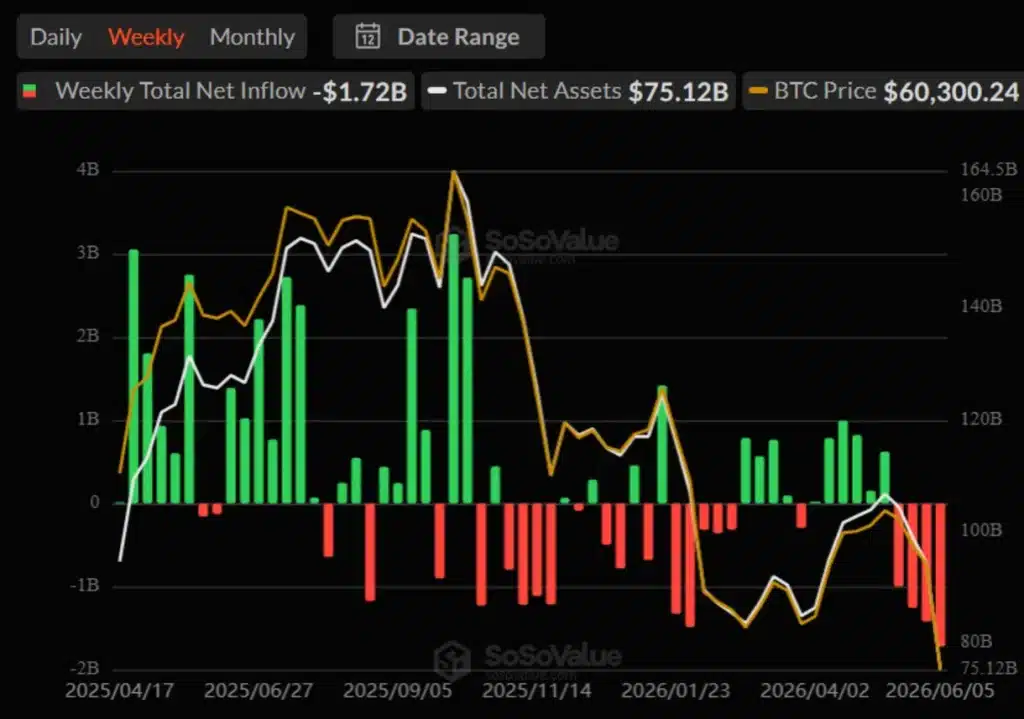
The chart shows that weekly flows have deteriorated sharply in recent weeks. After periods of strong inflows throughout much of 2025, sentiment flipped decisively negative as Bitcoin entered its latest correction.
Total assets held by spot Bitcoin ETFs have fallen to approximately $75.1 billion. The decline reflects both investor withdrawals and Bitcoin’s falling price.
The selling pressure has been remarkably persistent. Aside from a small positive day, nearly every recent trading session has ended with net outflows as institutions and large investors reduce exposure.
Bitcoin Slides Toward $60K as Institutions Retreat
The ETF retreat has coincided with one of Bitcoin’s weakest stretches in months. BTC traded near $60,300 according to the latest data and briefly dipped below the key $60,000 support area during the broader market selloff.
Just days ago, Bitcoin traded above $73,000. Since then, consecutive waves of selling have pushed the asset down by more than 17%, triggering billions in liquidations across the crypto market.
Currently, BTC is trading at the price of $63,539.07, up 1.7% in the last 24 hours, down 12.7% over the week, and losing 20.8% across the past month, per the latest chart information on June 8.
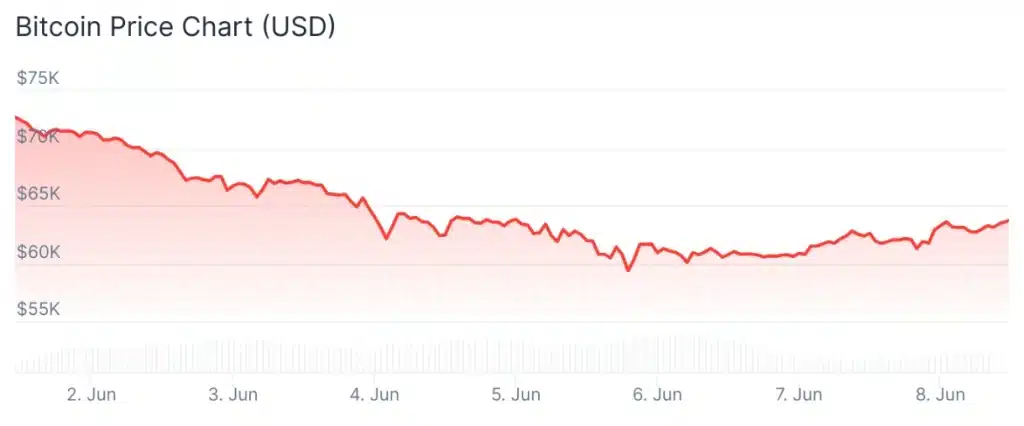
Bitcoin price 7-day chart. Source: CoinGecko
Though ETF flows aren’t the only factor behind the decline, they remain one of the most closely watched indicators of institutional demand. Throughout much of 2024 and 2025, strong ETF inflows helped fuel Bitcoin’s rally and supported higher prices.
The reverse appears to be happening now. As capital exits the funds, Bitcoin faces an additional source of selling pressure at a time when market confidence is already fragile.
Investors will be watching closely to see whether the outflow streak finally breaks next week. If withdrawals continue at this pace, ETF demand could shift from a major tailwind into one of the biggest headwinds Bitcoin has faced since spot products first entered the market.
The post Bitcoin ETFs Just Had Their Darkest Week Yet appeared first on TechGaged.com.
0
0

 Manage all your crypto, NFT and DeFi from one place
Securely connect the portfolio you’re using to start.


0
0


0
0