Cardano Dips Slightly — But ADA Charts Point to Hidden Strength in Q3

0
0
Cardano (ADA) may be showing a modest dip on the surface, but its technical indicators tell a deeper story. Despite recent declines, ADA’s chart structure hints at underlying strength that could play out as Q3 unfolds. As the broader market looks for direction, Cardano’s stable support zones and aligned moving averages suggest it may be quietly preparing for a rebound. This article explores whether ADA’s current setup could offer a strategic opportunity before the next leg up.
Cardano (ADA) Bounces Back, Eyes on Key Resistance Levels
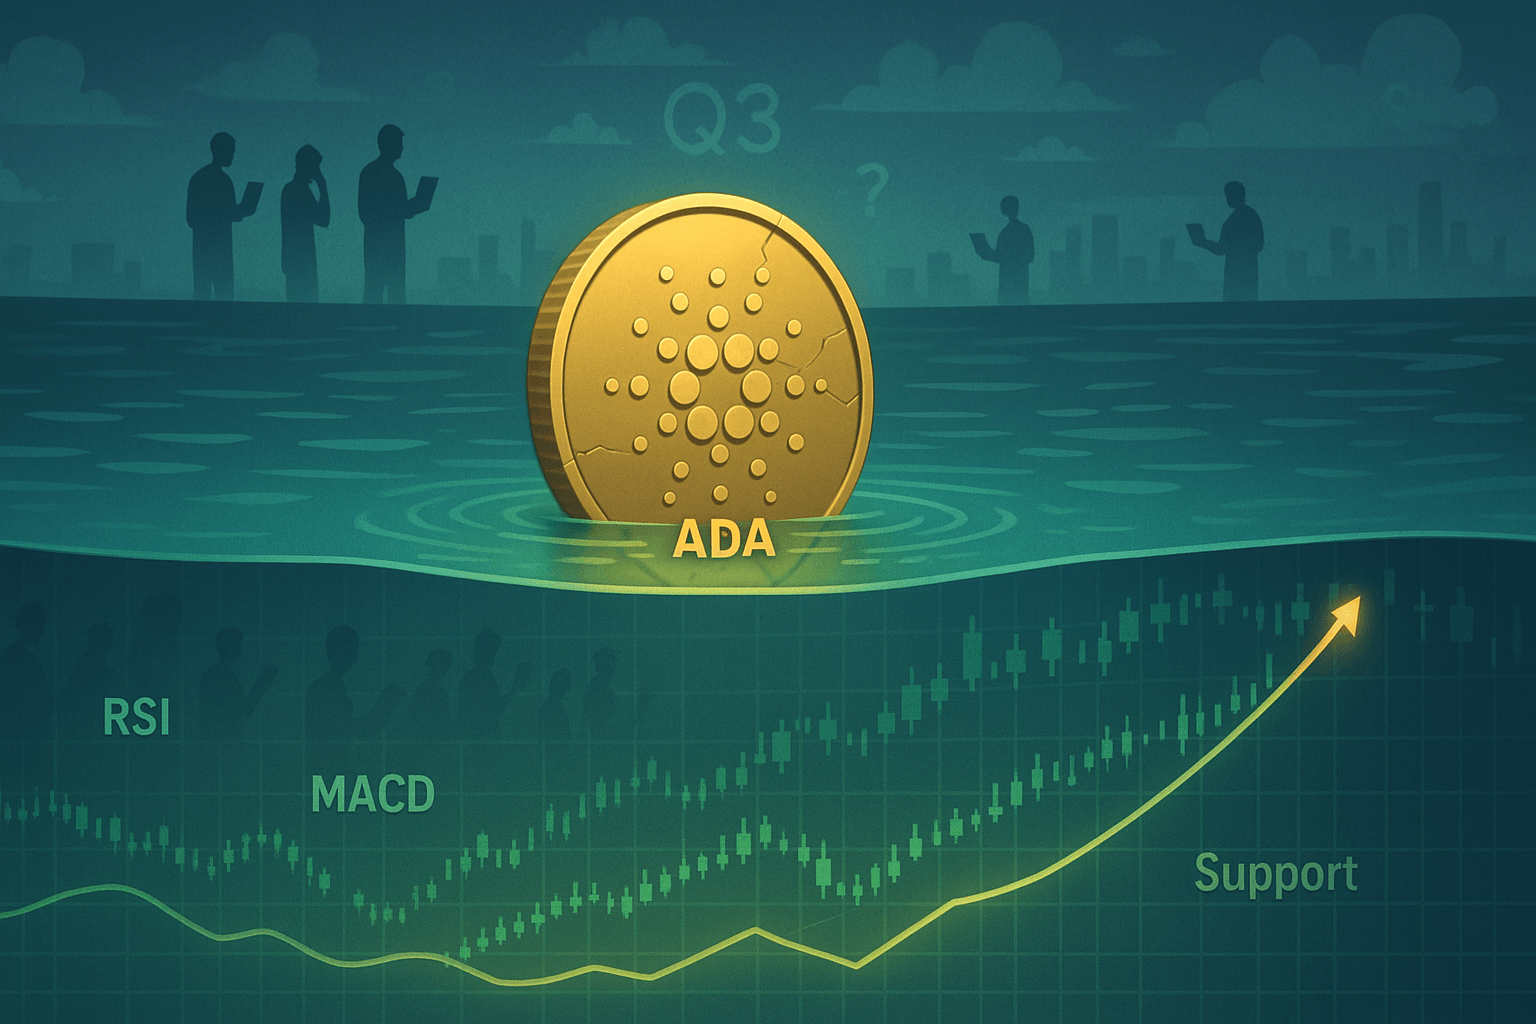
Source: tradingview
Cardano (ADA) currently trades between the mid-fifty cents and low sixty cents mark. It recently saw a slight rise of over 1% this week, though it’s still down about 13% from last month and nearly 39% in the past six months. The coin's short- and long-term averages are aligned at around 58 cents, suggesting a stable, sideways trend. The nearest barrier to further gains sits at sixty-five cents. Should ADA break through this, it could aim for seventy-three cents, reflecting a potential growth of over 17% from its lower range. Meanwhile, support is seen at 50 cents, providing a cushion for further dips. Enthusiasts watch closely, hoping for a sustained rebound.
Conclusion
While Cardano’s recent price action appears muted, its technical footing remains solid with clear support and promising upside targets. A break past $0.65 could mark the start of a Q3 recovery, especially if market sentiment improves. For investors eyeing resilience and long-term value, ADA’s current chart may offer more than meets the eye.
Disclaimer: This article is provided for informational purposes only. It is not offered or intended to be used as legal, tax, investment, financial, or other advice.
0
0

 Manage all your crypto, NFT and DeFi from one place
Securely connect the portfolio you’re using to start.


0
0

0
0
