Bitcoin Price Jumps 18% — On-Chain Data Reveals a Bear Rally in Disguise

0
0

Bitcoin price has staged a sharp 18% recovery from its February lows near $62,530, briefly tagging $74,150 this week. The headlines call it a comeback. On-chain data tells a different story.
BeInCrypto’s own on-chain research and Glassnode’s Week On-Chain report, released this week, together point to a market distributing into relief. Not one building toward a new leg higher.
The Profit Signal Has a Bear Market Feel
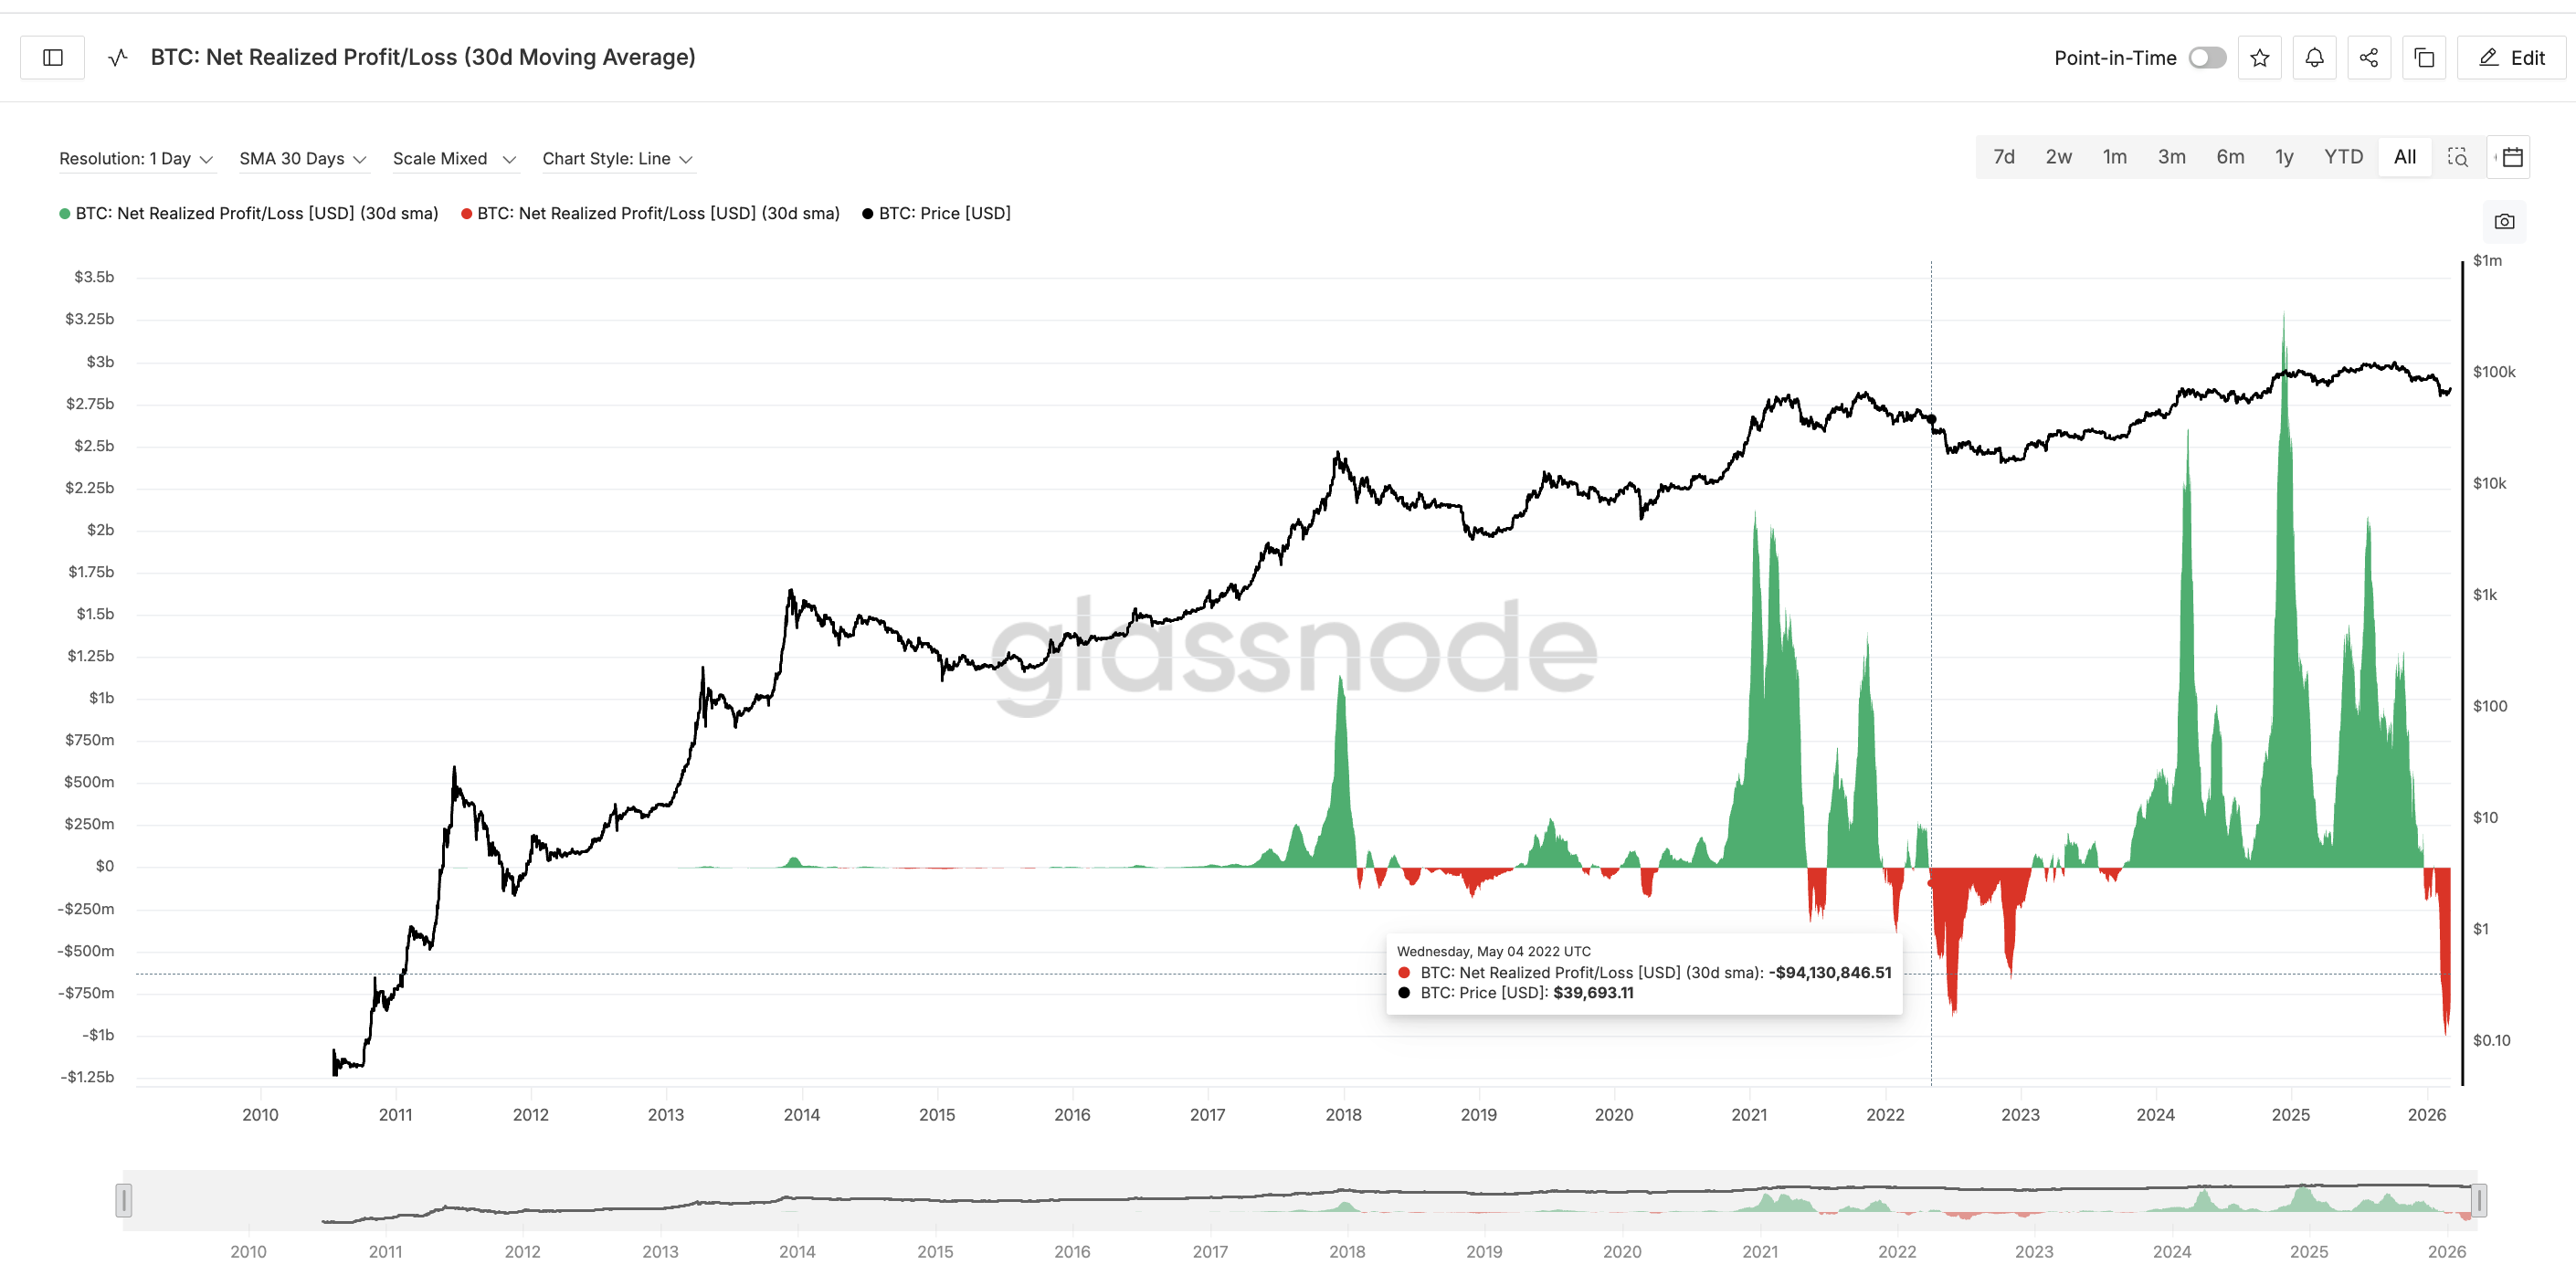
The clearest warning comes from Bitcoin’s Net Realized Profit/Loss. It is a metric that measures the difference between profits and losses locked in.
Since early January, this indicator has remained in negative territory, indicating that more value is being destroyed on-chain than created. The pattern closely mirrors two critical junctures in Bitcoin’s history. The weeks leading up to the May 2022 Bitcoin crash and the months leading up to the November 2018 collapse.
Both extended losing streaks preceded severe downside, not recoveries.
 Net BTC-Specific Profit: Glassnode
What makes this signal harder to ignore is that it’s persisting even as the price bounces. Moves without a corresponding uptick in net realized profit tend not to hold.
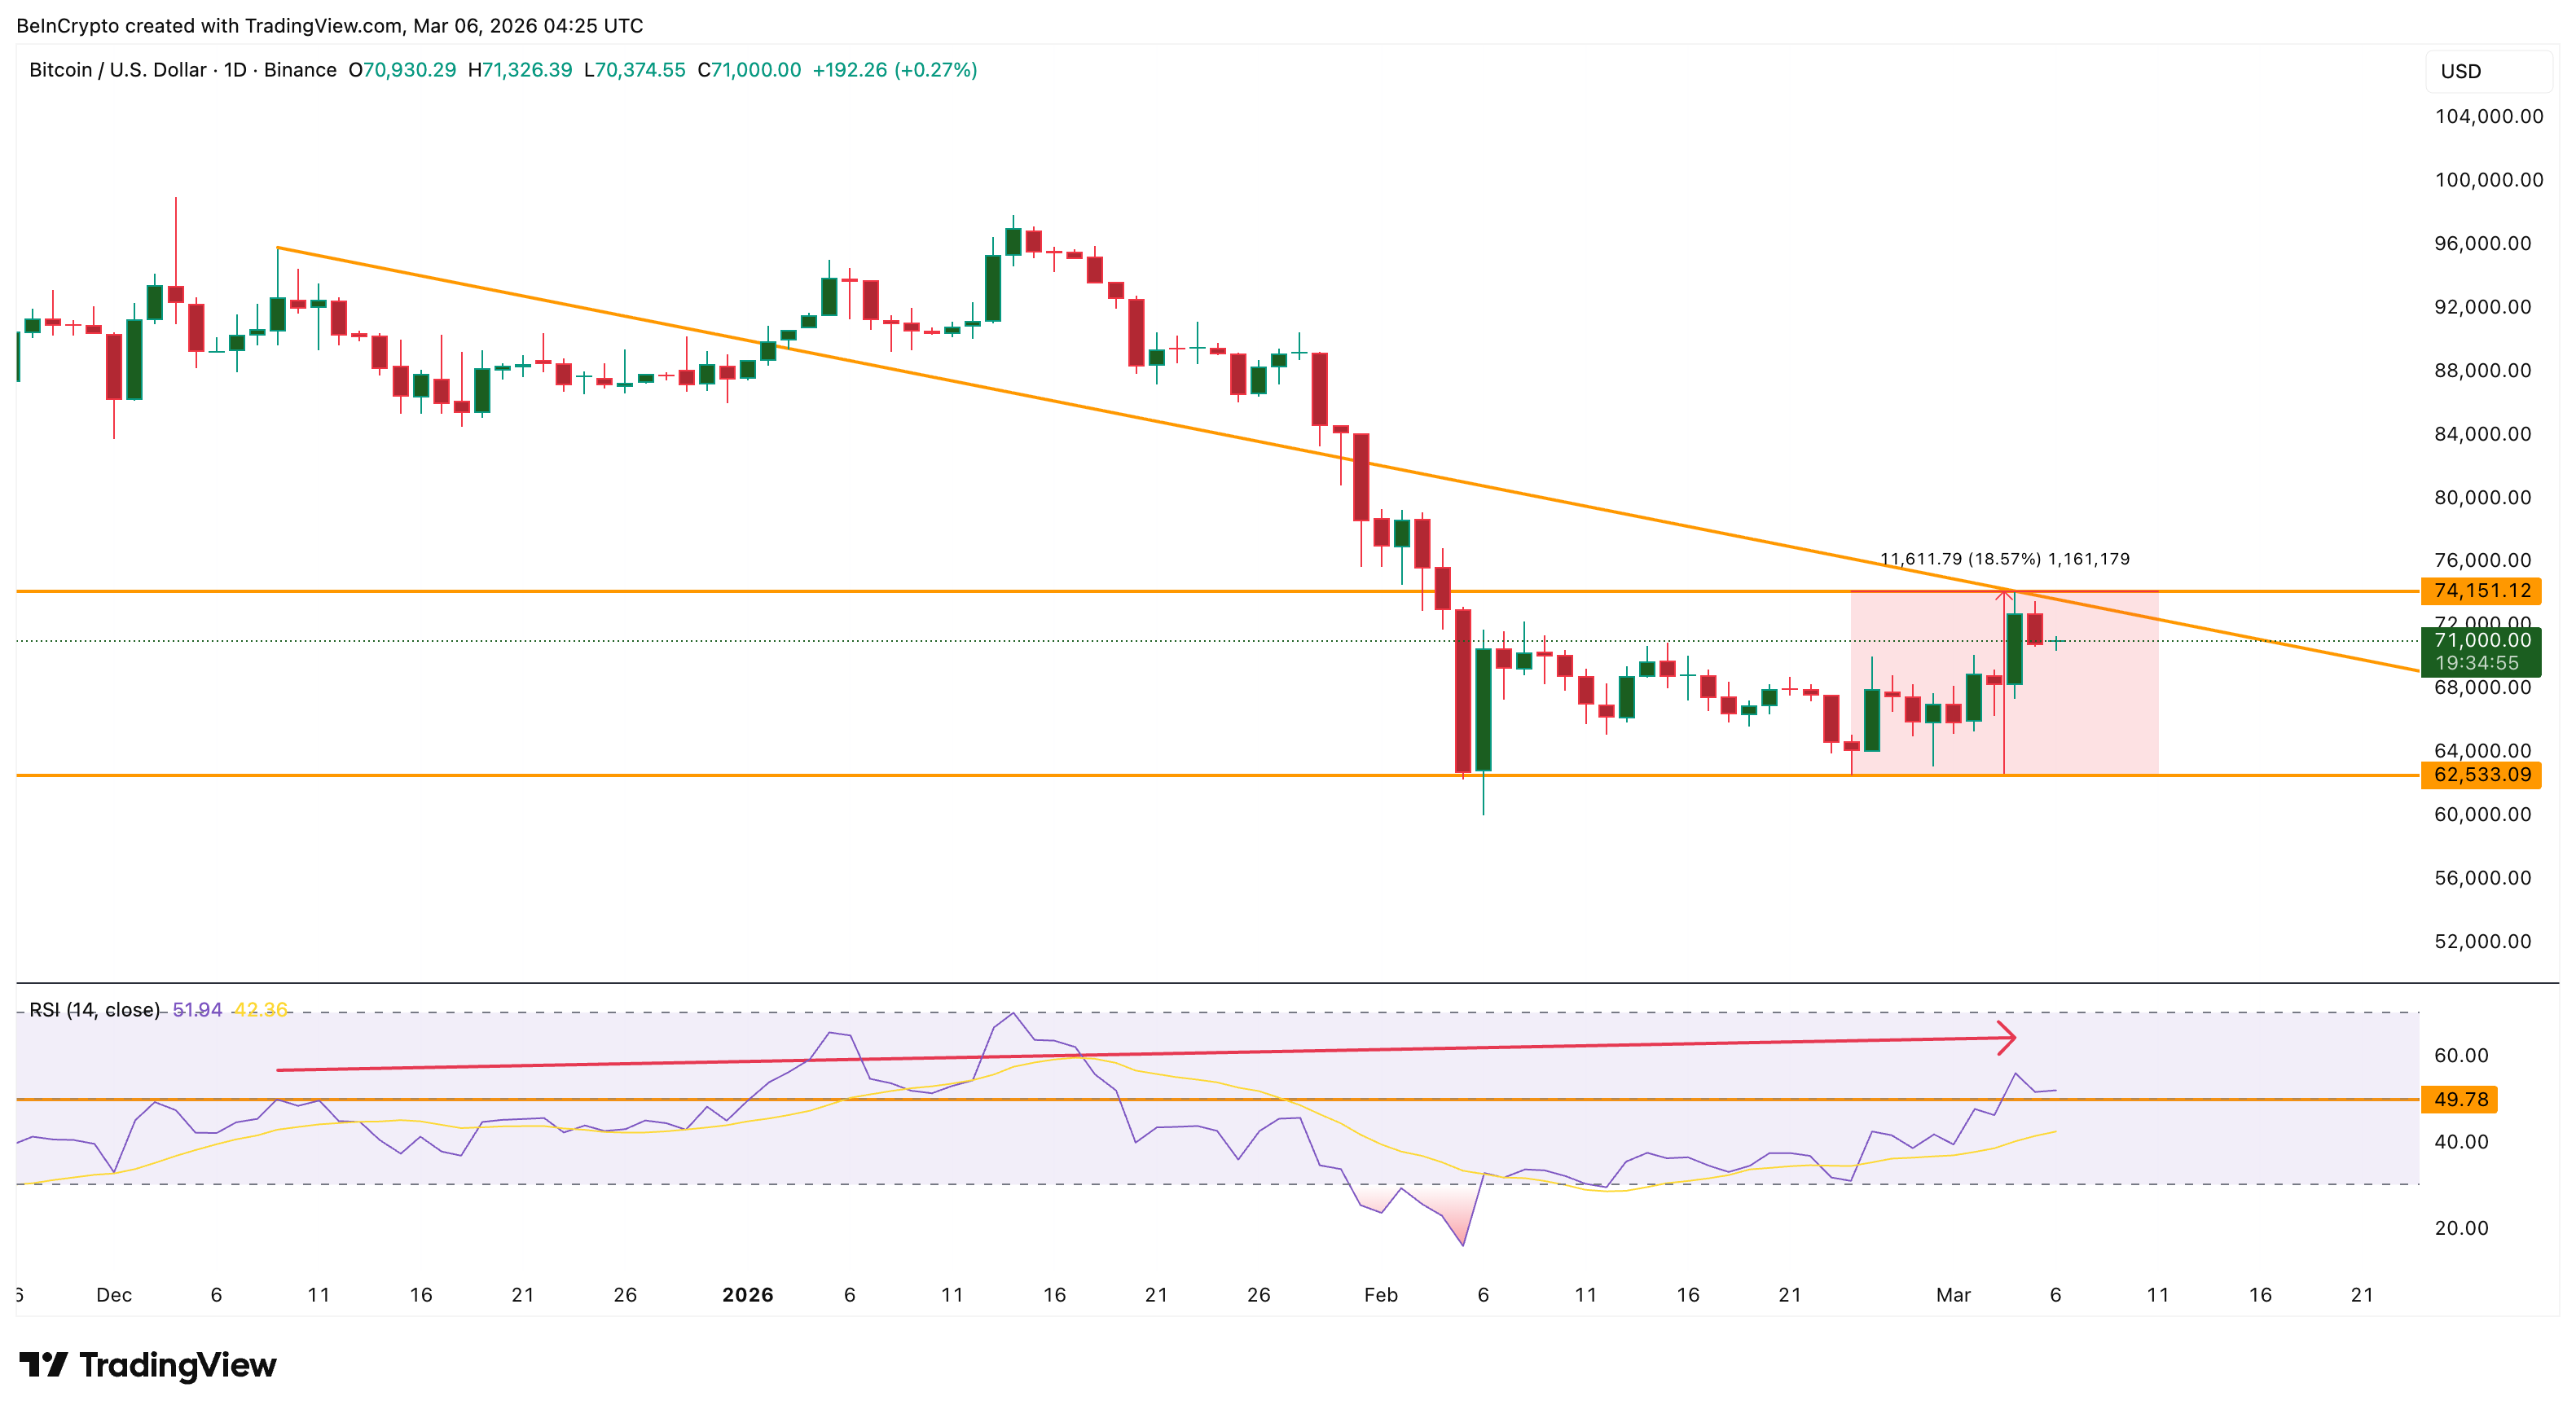
There’s a technical layer that compounds the warning. The Relative Strength Index (RSI), which measures momentum, flashed a hidden bearish divergence between December 9 and March 4. Bitcoin printed a lower high in price while RSI registered a higher high over the same period.
 Bearish Divergence: TradingView
When momentum strengthens as price weakens, it typically signals that the rally lacks structural demand — a quiet confirmation that sellers remain in control.
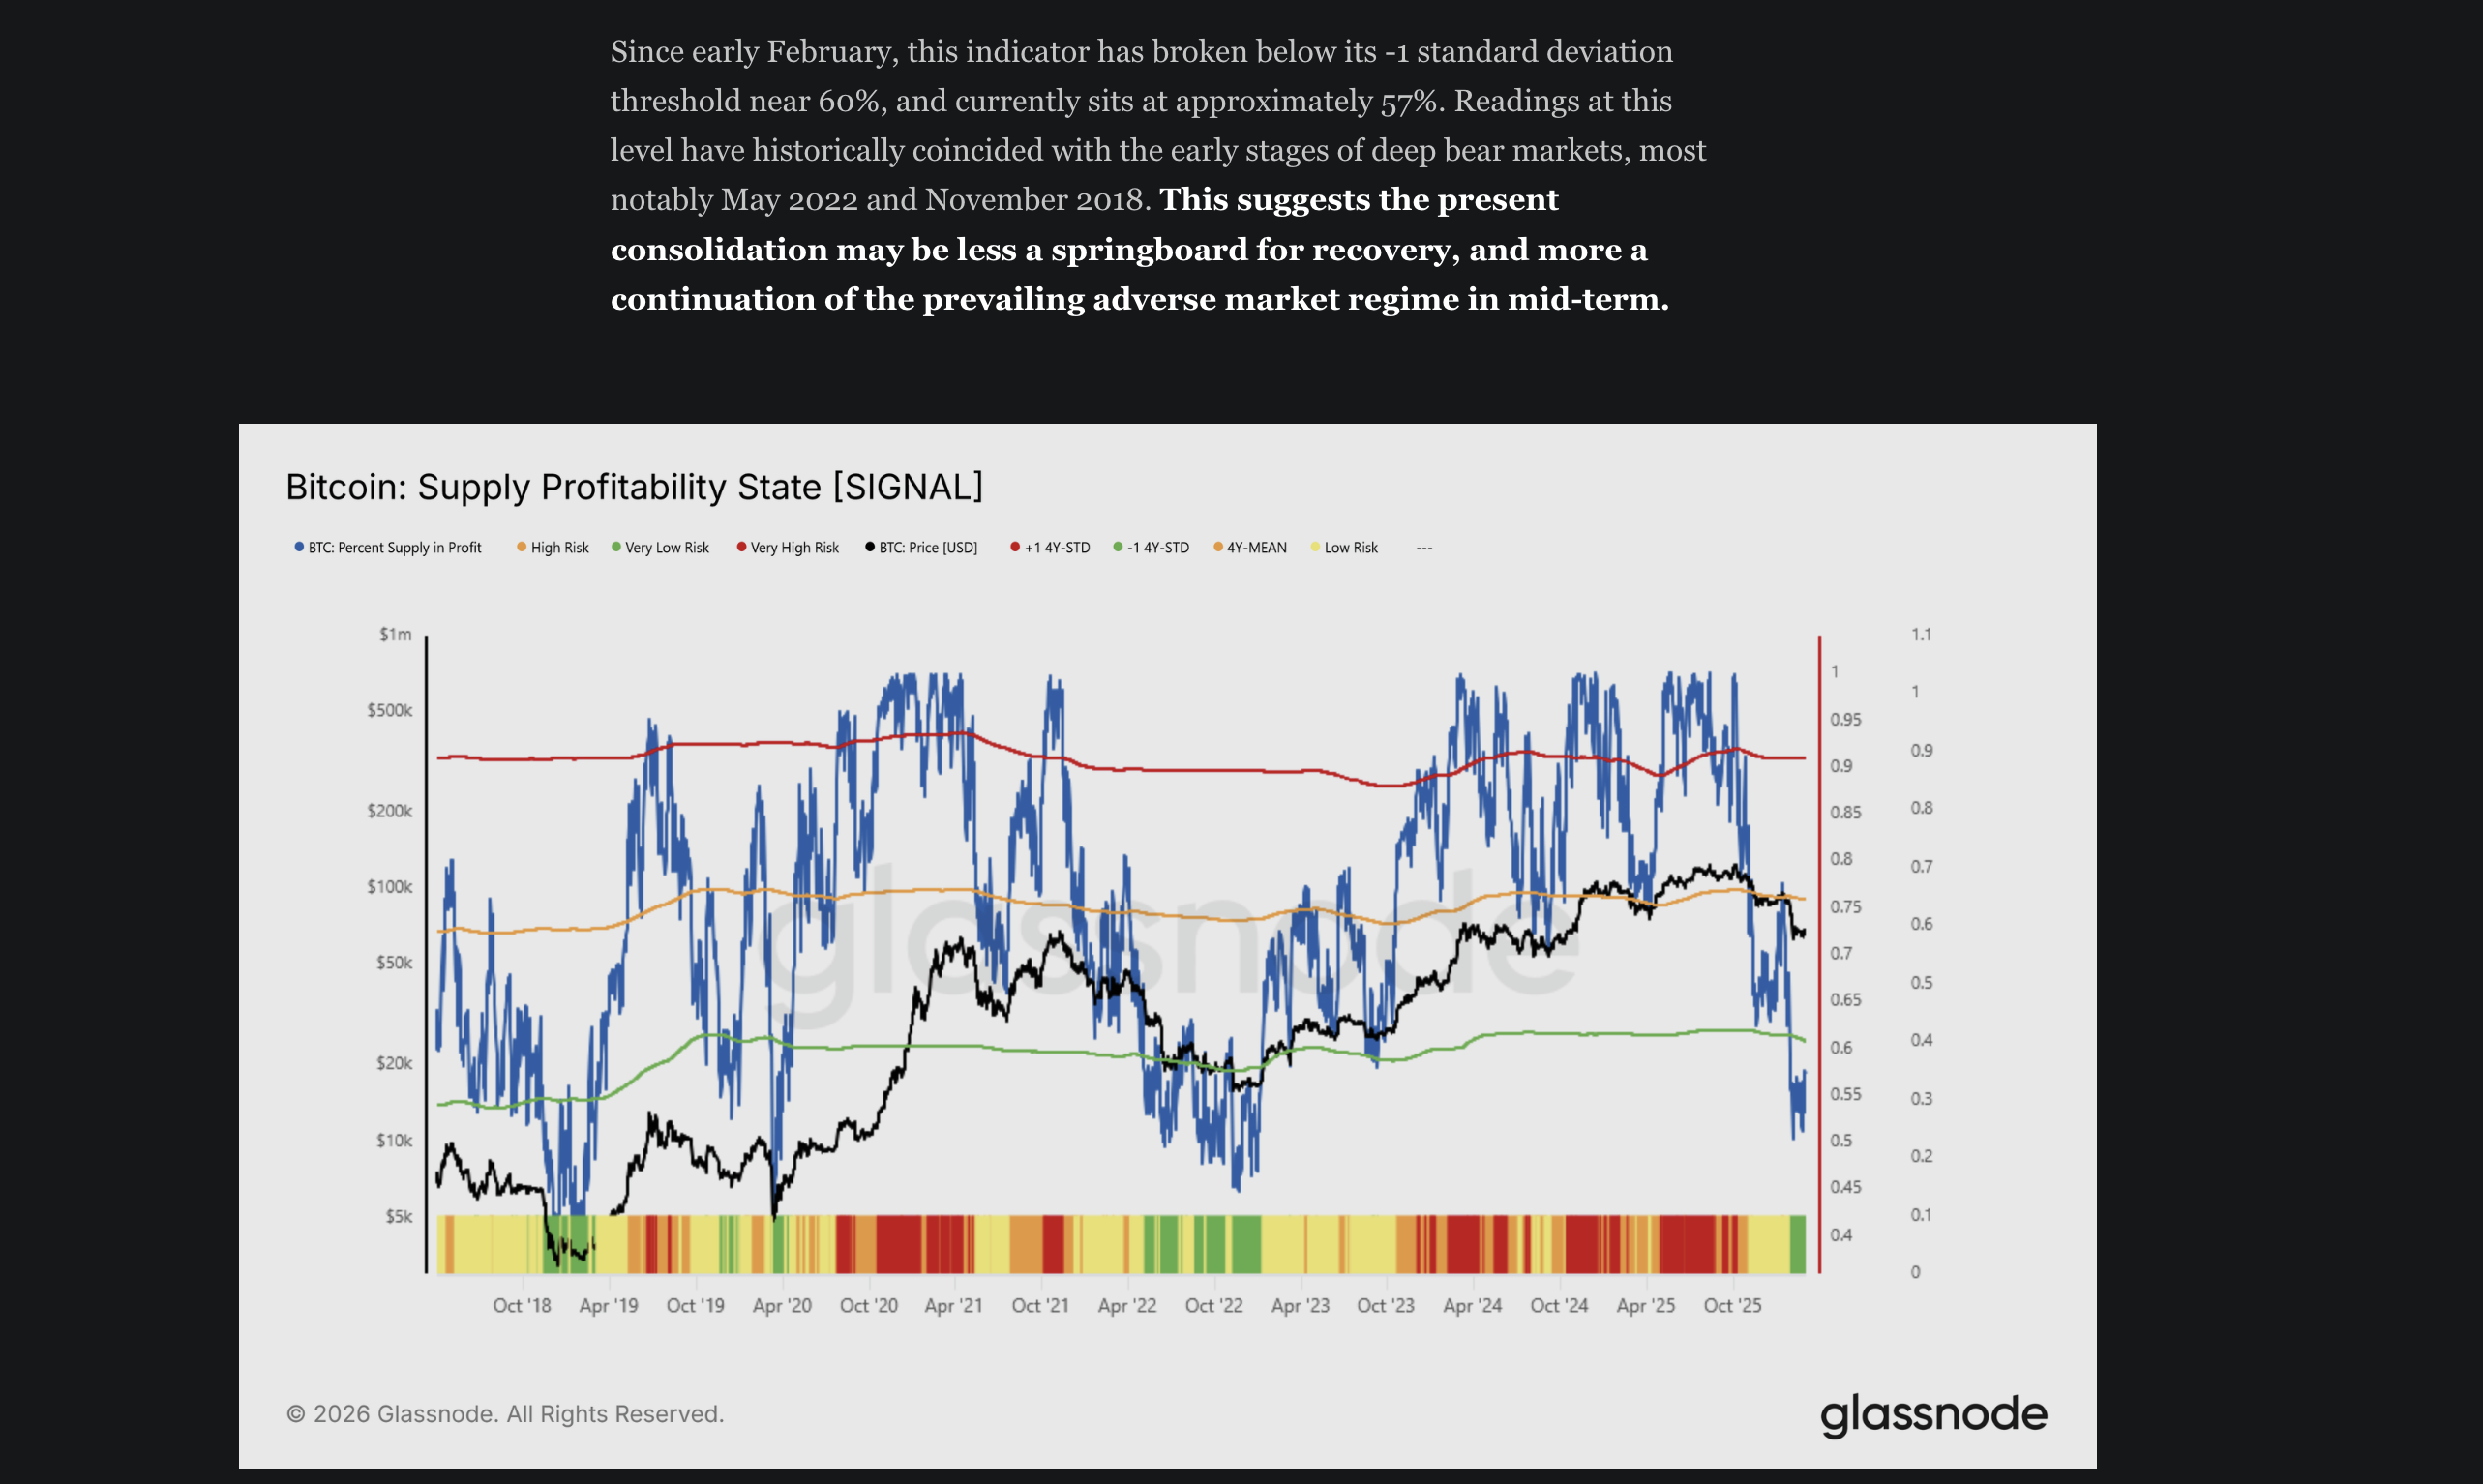
Glassnode’s Week On-Chain report adds weight to this reading. Their Supply Profitability State Signal, which tracks the percentage of Bitcoin’s circulating supply sitting at an unrealized gain, has broken below a key threshold.
 Supply Profitability Signal: Glassnode Report
At roughly 57% of supply in profit, the current reading sits within a zone that has historically appeared at the early stages of prolonged bear markets, most notably May 2022 and November 2018.
That’s the same two periods BeInCrypto’s Net Realized Profit/Loss 30-day average flags as the closest historical parallels to today’s on-chain conditions — two different metrics, two different methodologies, pointing at the same conclusion.
Short-Term Holders Are Selling Into the Rally
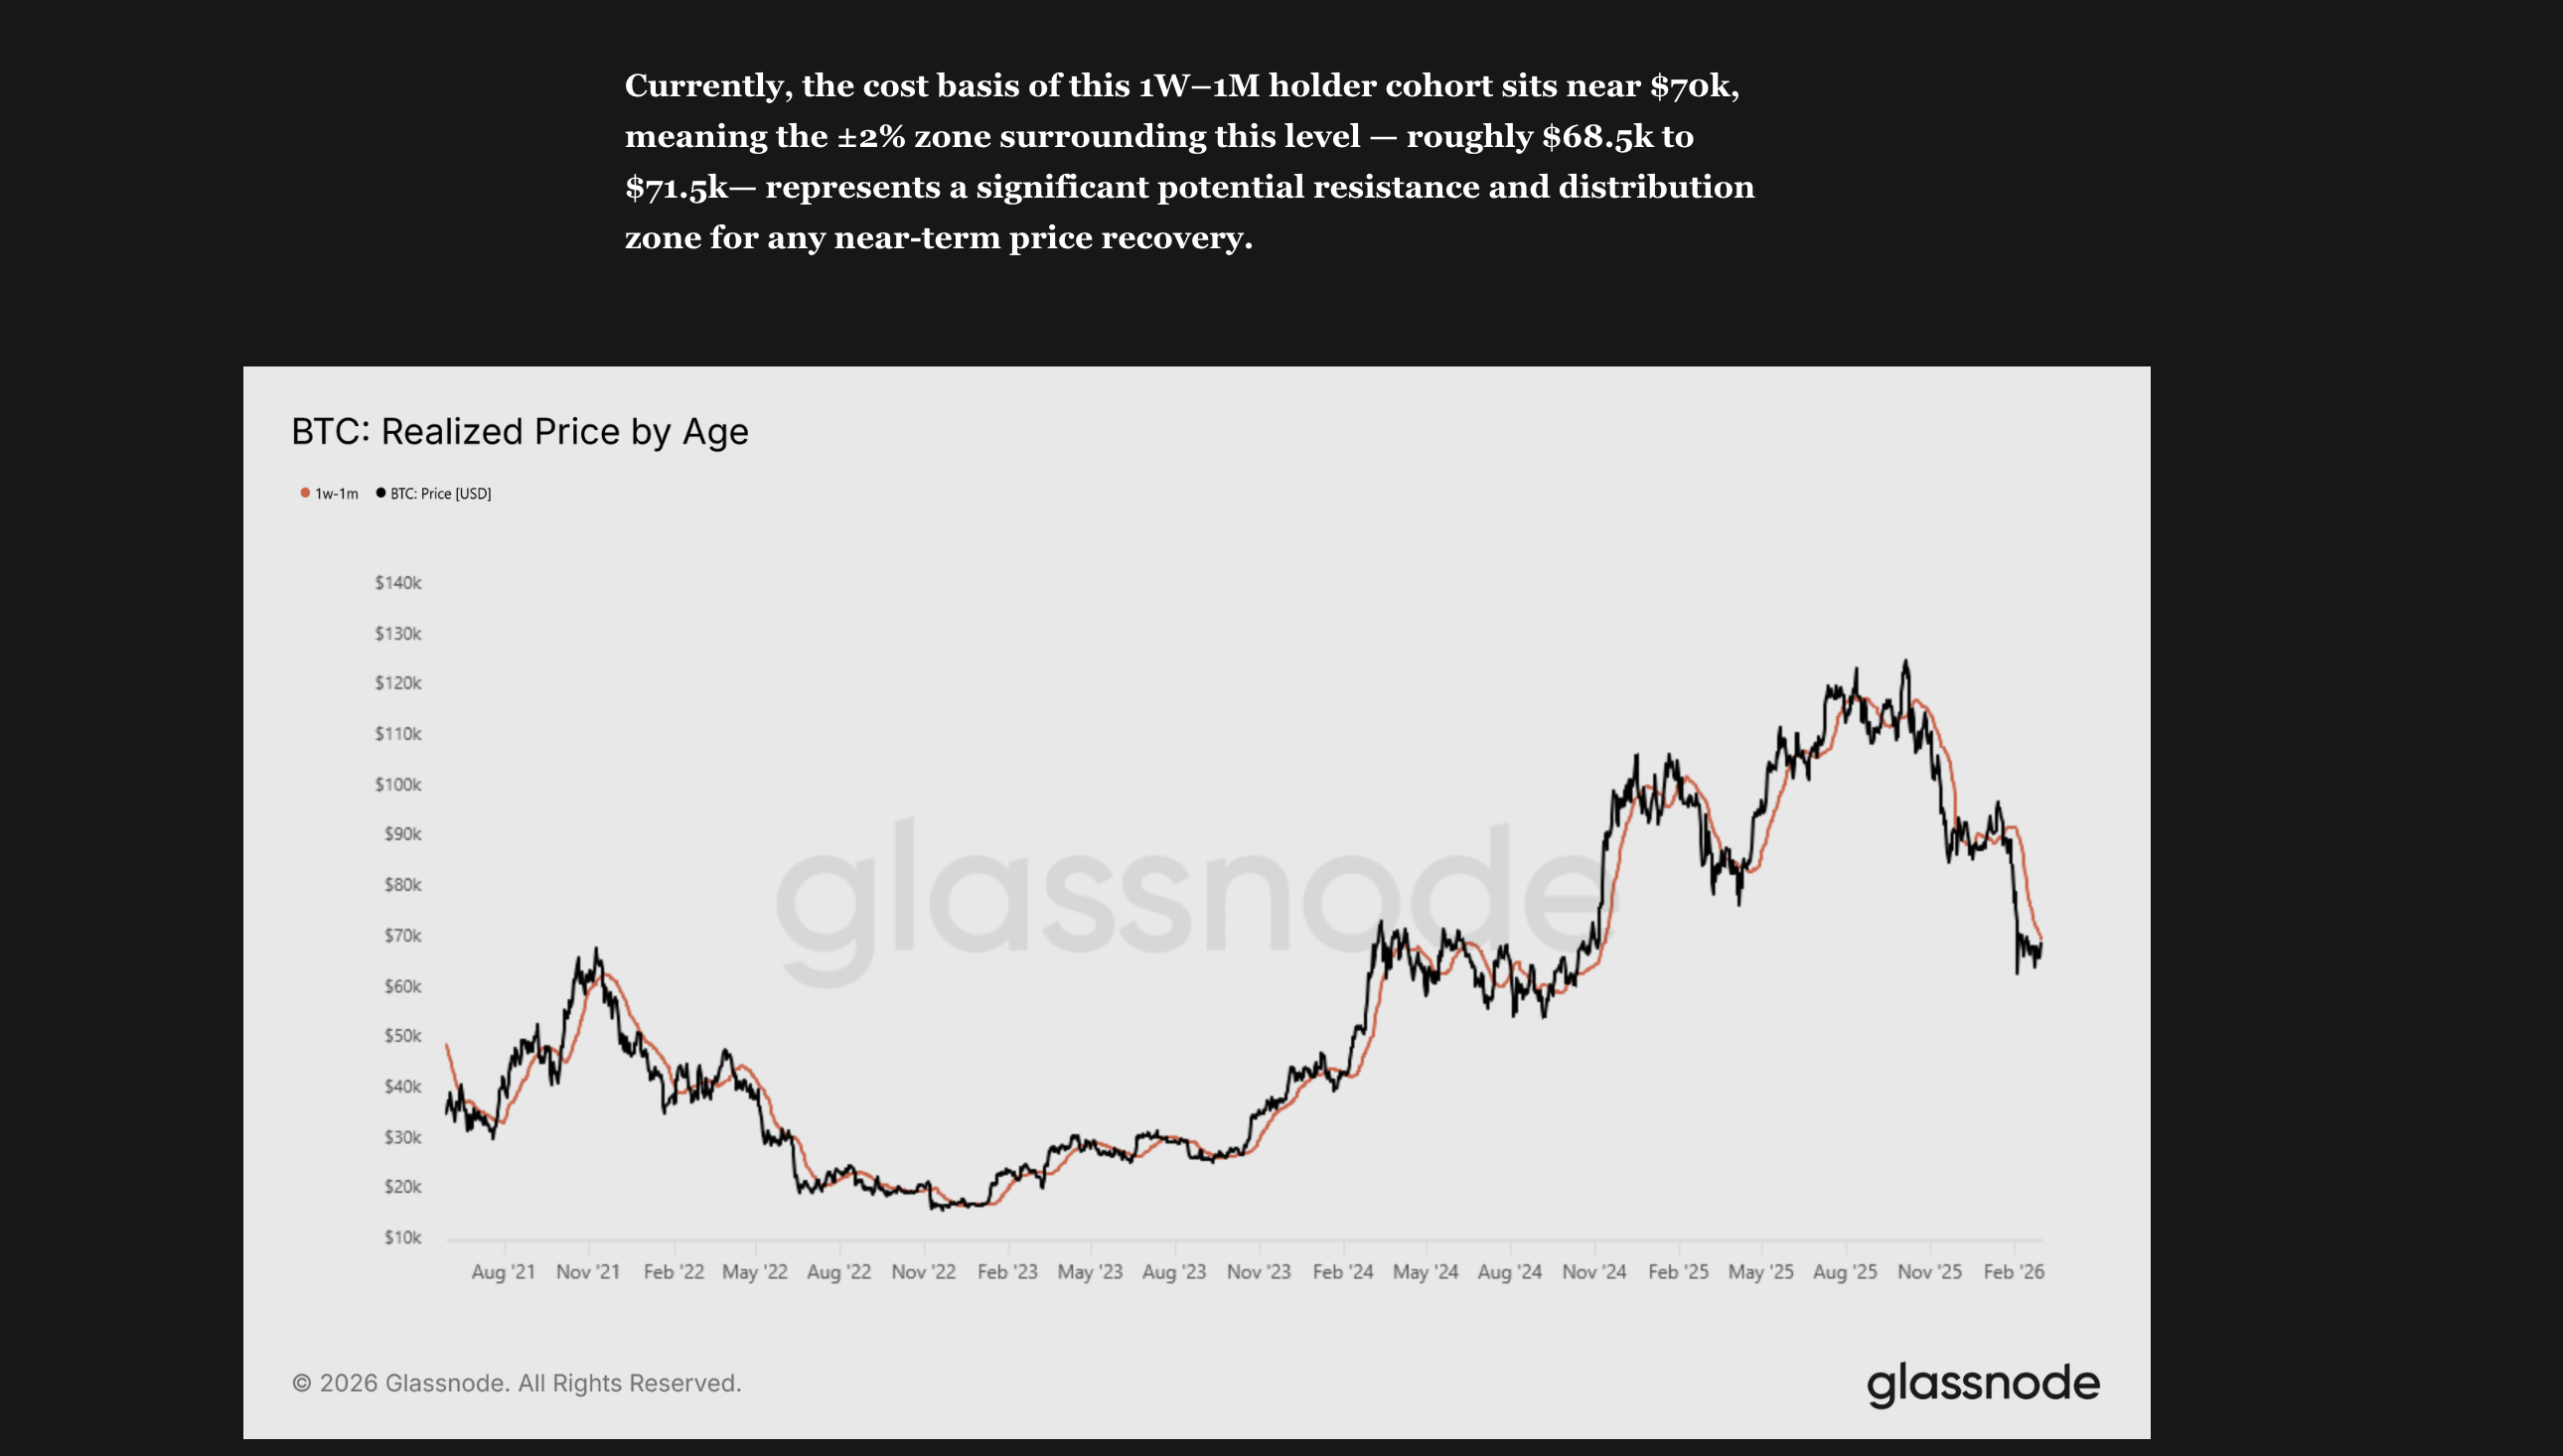
Glassnode’s Realized Price by Age metric tracks the average acquisition cost of Bitcoin grouped by how recently coins last moved on-chain.
For the cohort that bought within the past one week to one month, the cost basis currently sits near $70,000 — creating a natural distribution zone between $68,500 and $71,500 where recent buyers approach breakeven and choose to exit rather than wait for further upside.
Want more token insights like this? Sign up for Editor Harsh Notariya’s Daily Crypto Newsletter here.
 Realized Price: Glassnode Report
BeInCrypto’s HODL Wave analysis — a metric that segregates Bitcoin’s circulating supply by the age of last movement, revealing which holder cohorts are accumulating or offloading — confirms this is already happening.
On February 19, when Bitcoin was trading near $67,000, the 1-week to 1-month cohort held 6.20% of the circulating supply. By March 5, with Bitcoin near $70,880, that figure had fallen to 4.54%. Supply is leaving hands as price climbs. That’s not accumulation — it’s distribution into a bounce.
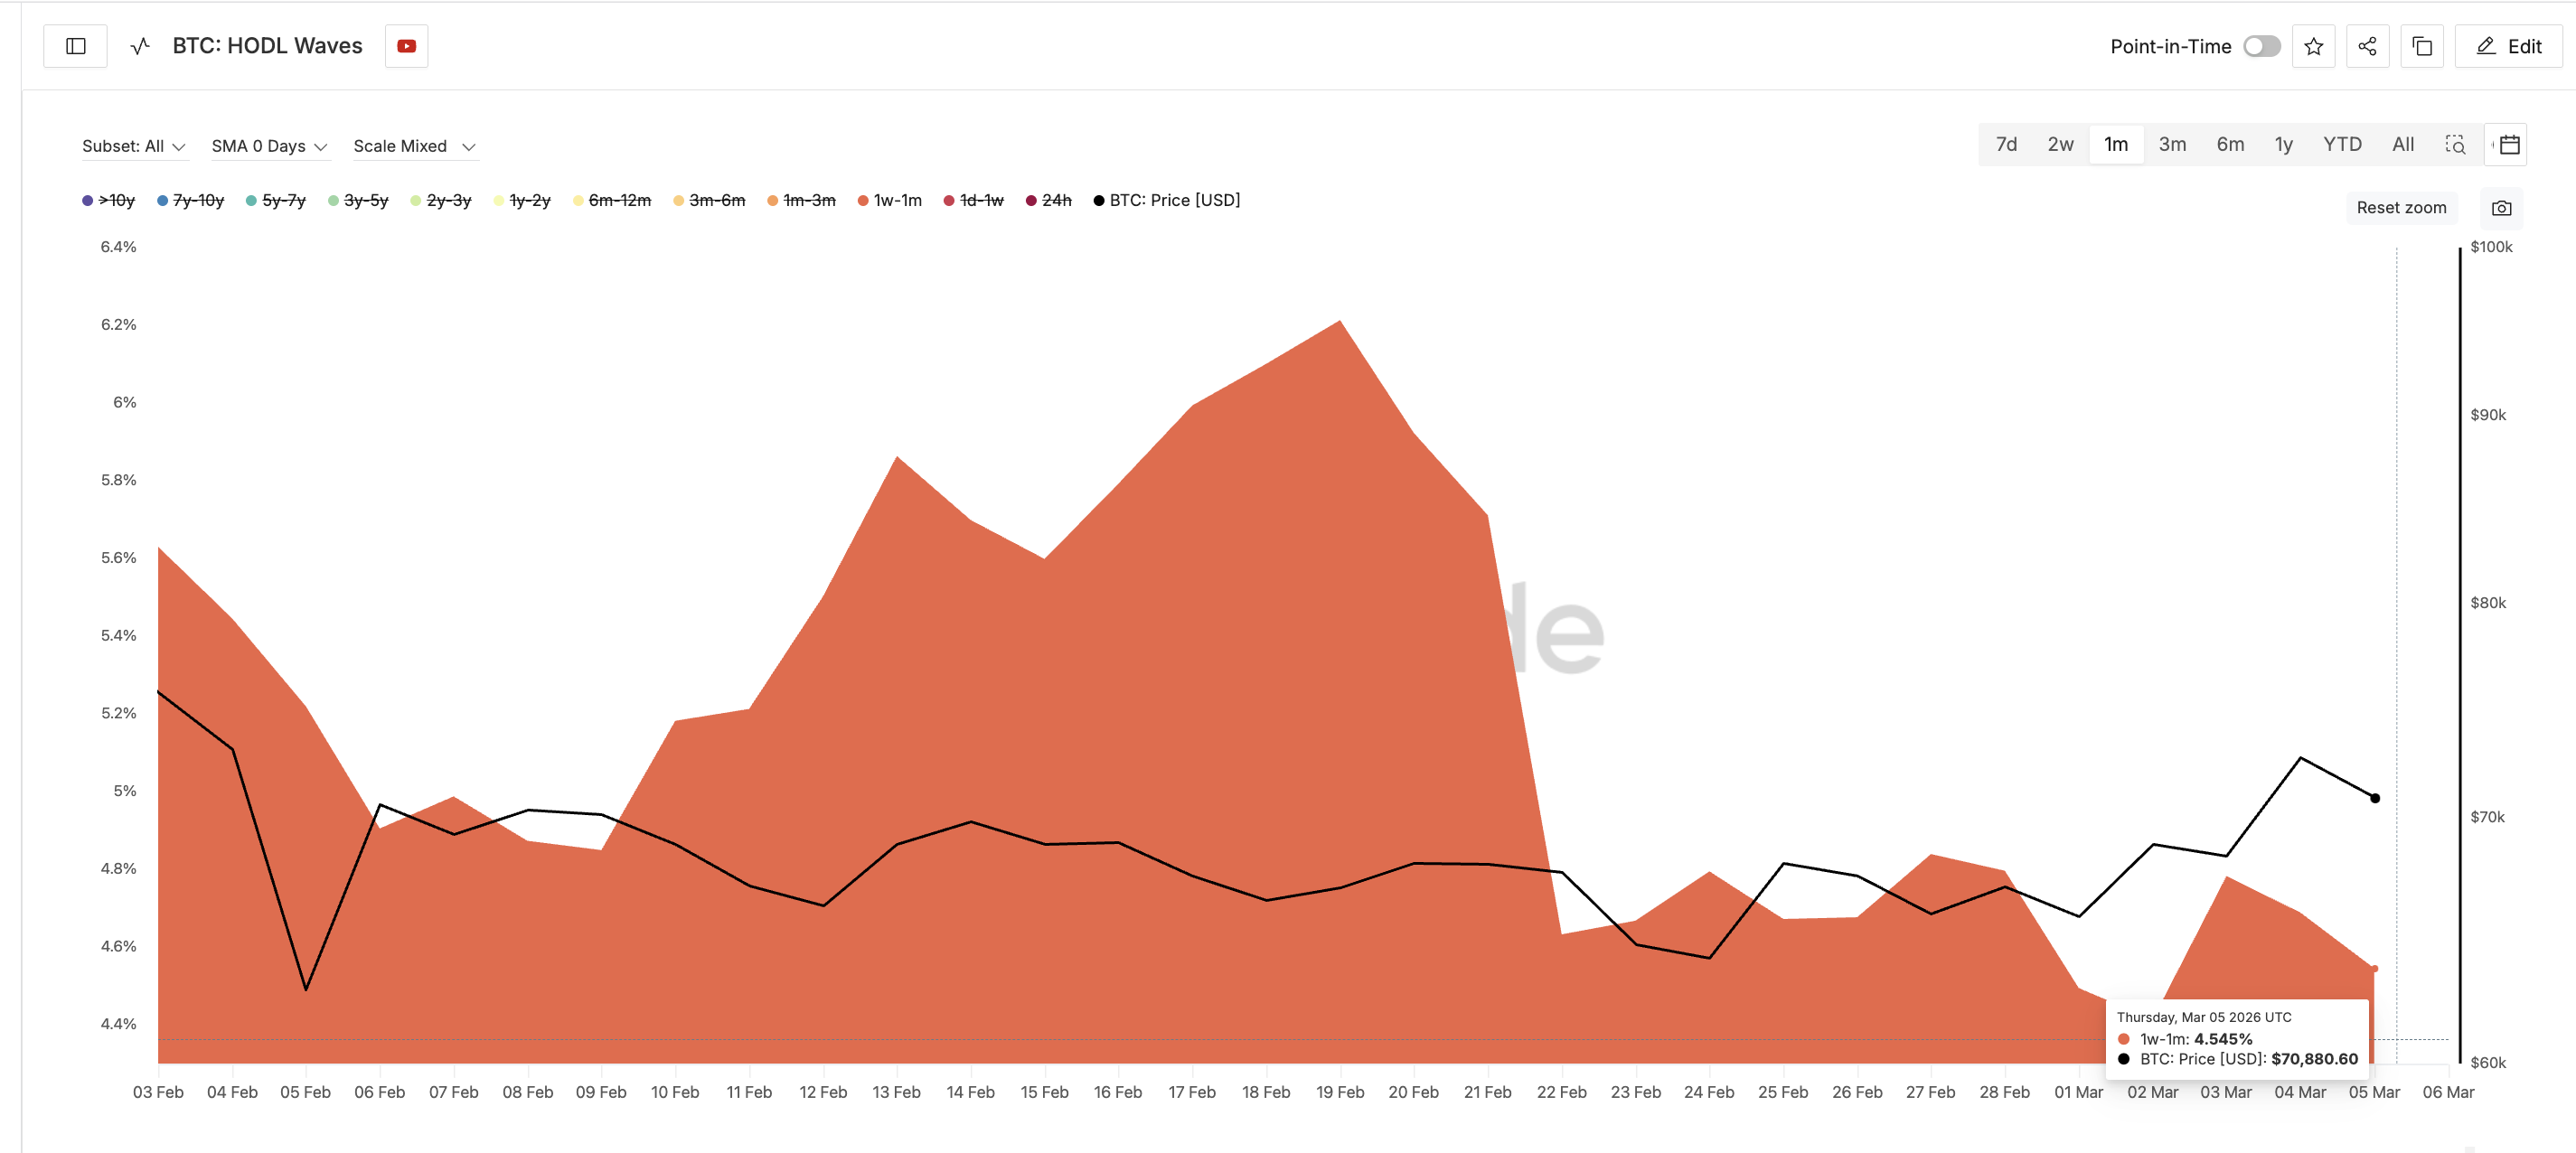 BTC HODL Waves: Glassnode
The derivatives market reinforces the same picture. Open interest — the total value of unsettled futures and perpetual contracts outstanding across exchanges, which rises when new money enters leveraged positions — currently sits at approximately $24.29 billion. That’s less than half of the $47+ billion recorded during July 2025’s run toward all-time highs.
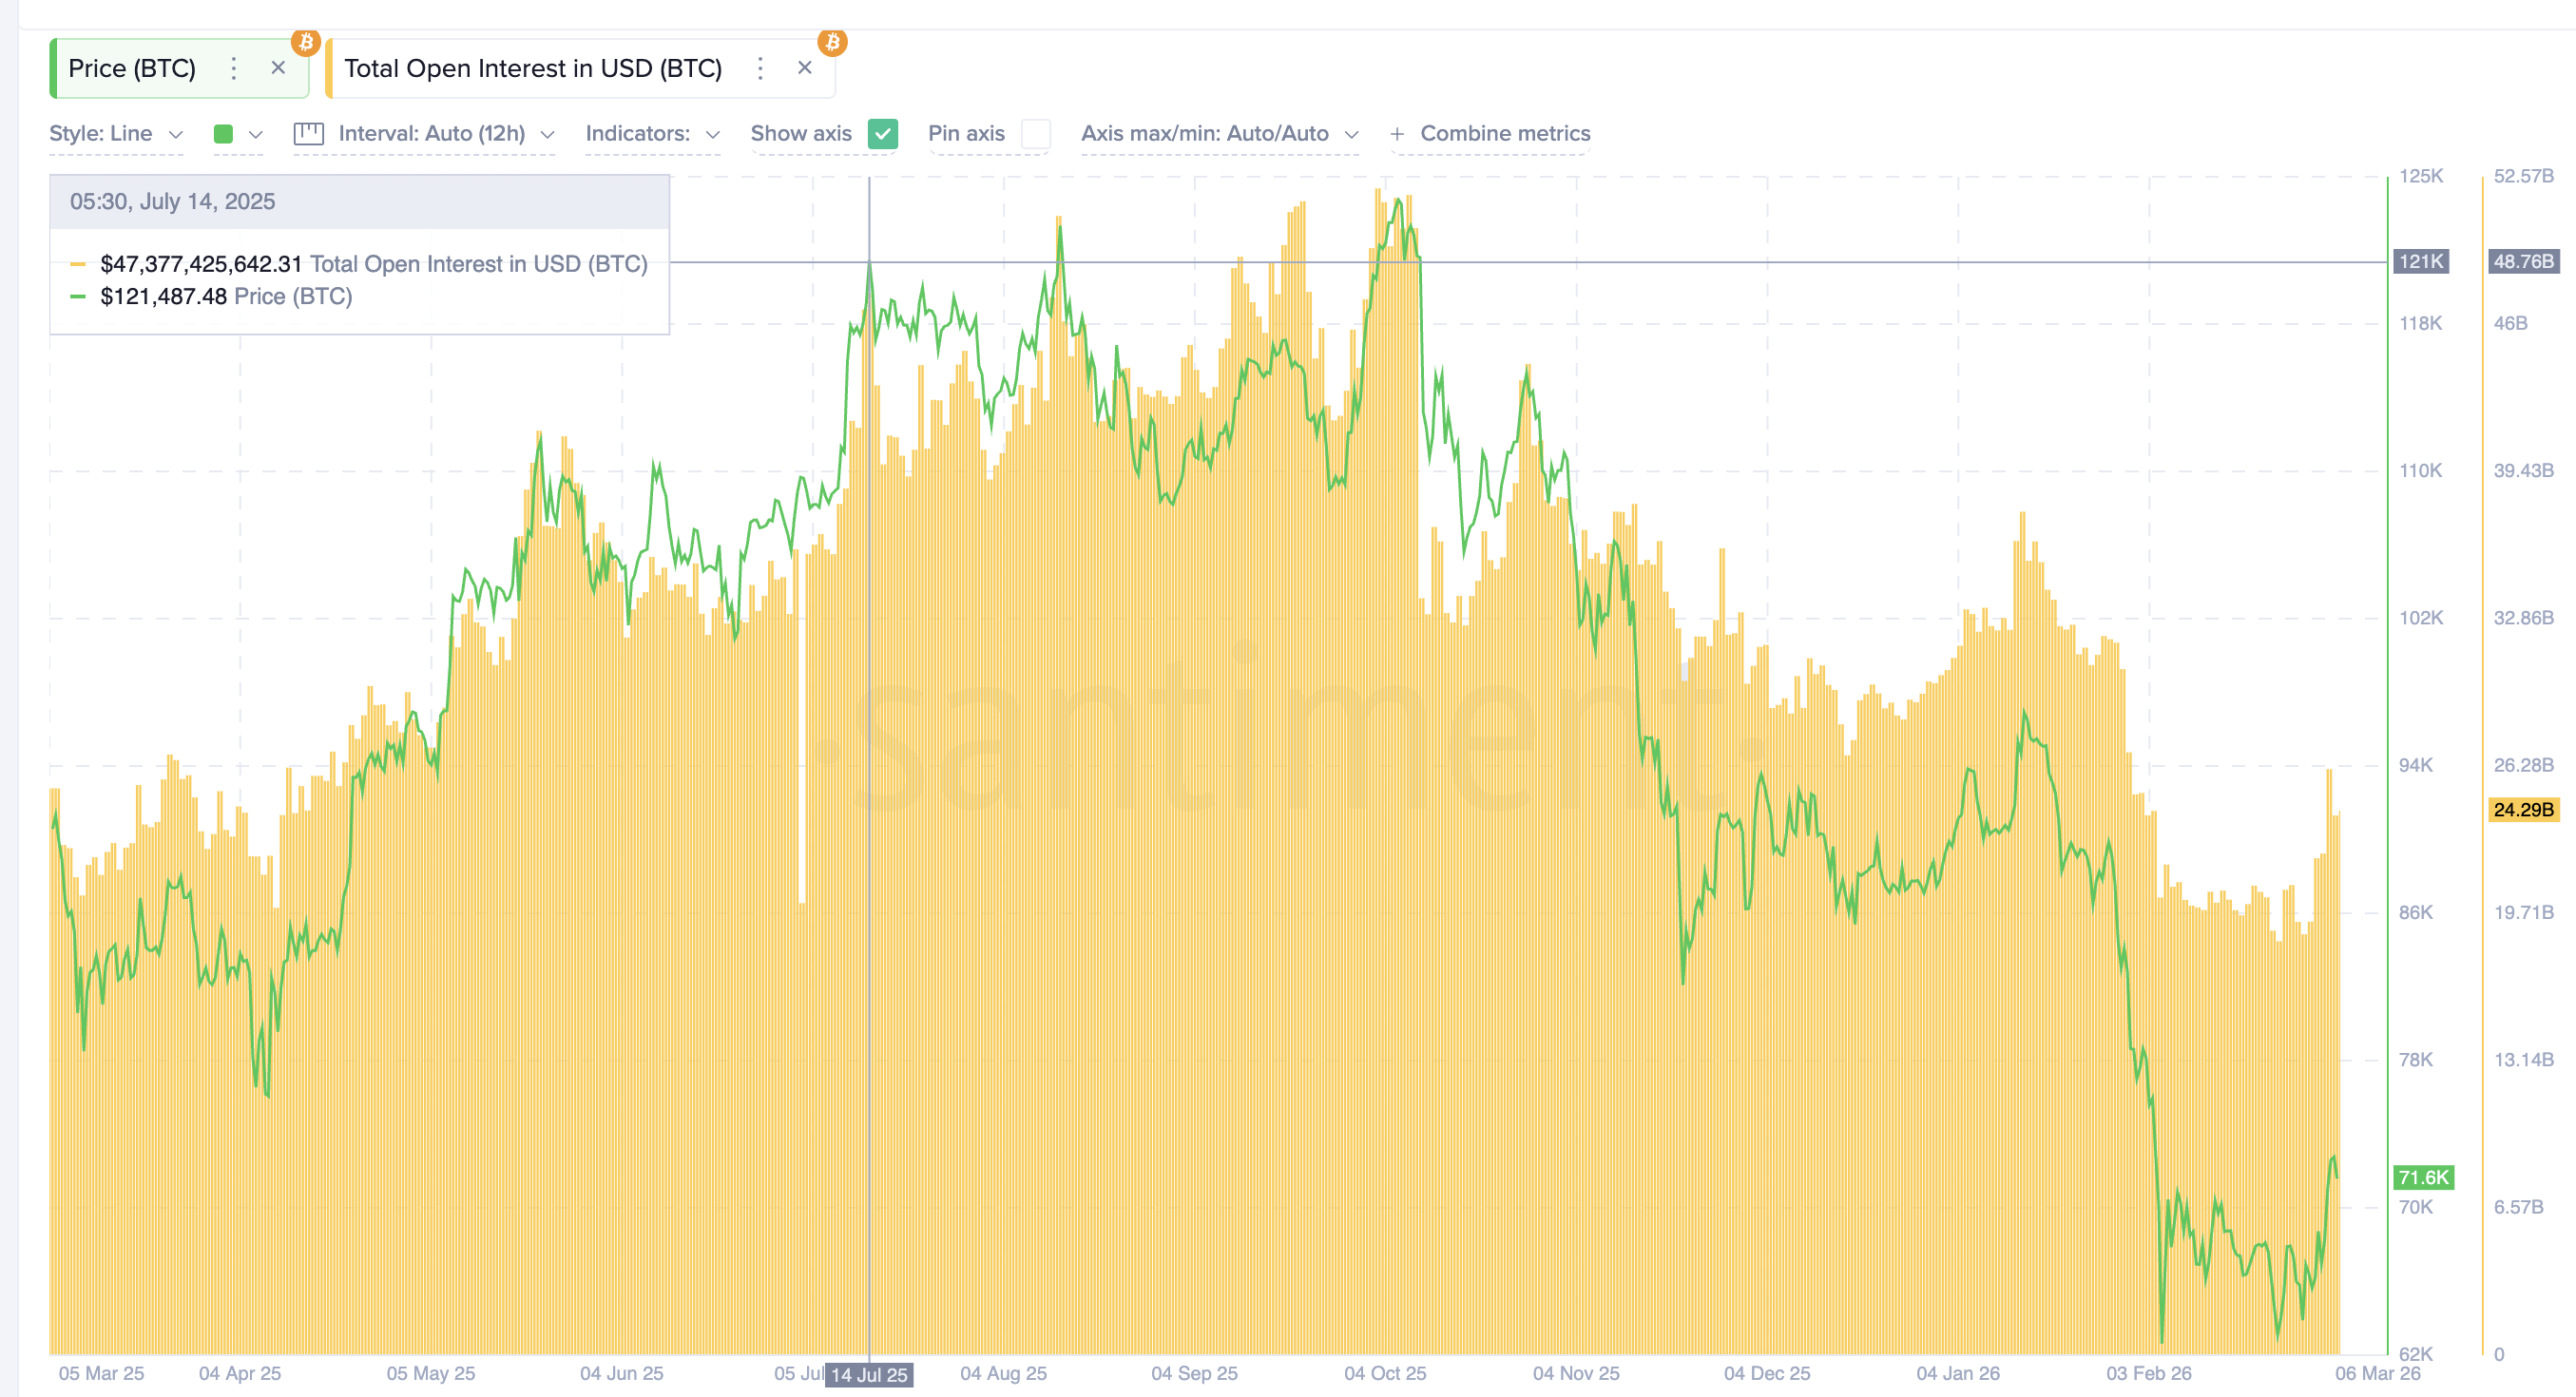 BTC Open Interest Dips: Santiment
Glassnode’s Week On-Chain report notes the same dynamic through its perpetual directional premium data, which measures the bias of funding rates across perpetual futures to gauge leveraged long or short positioning.
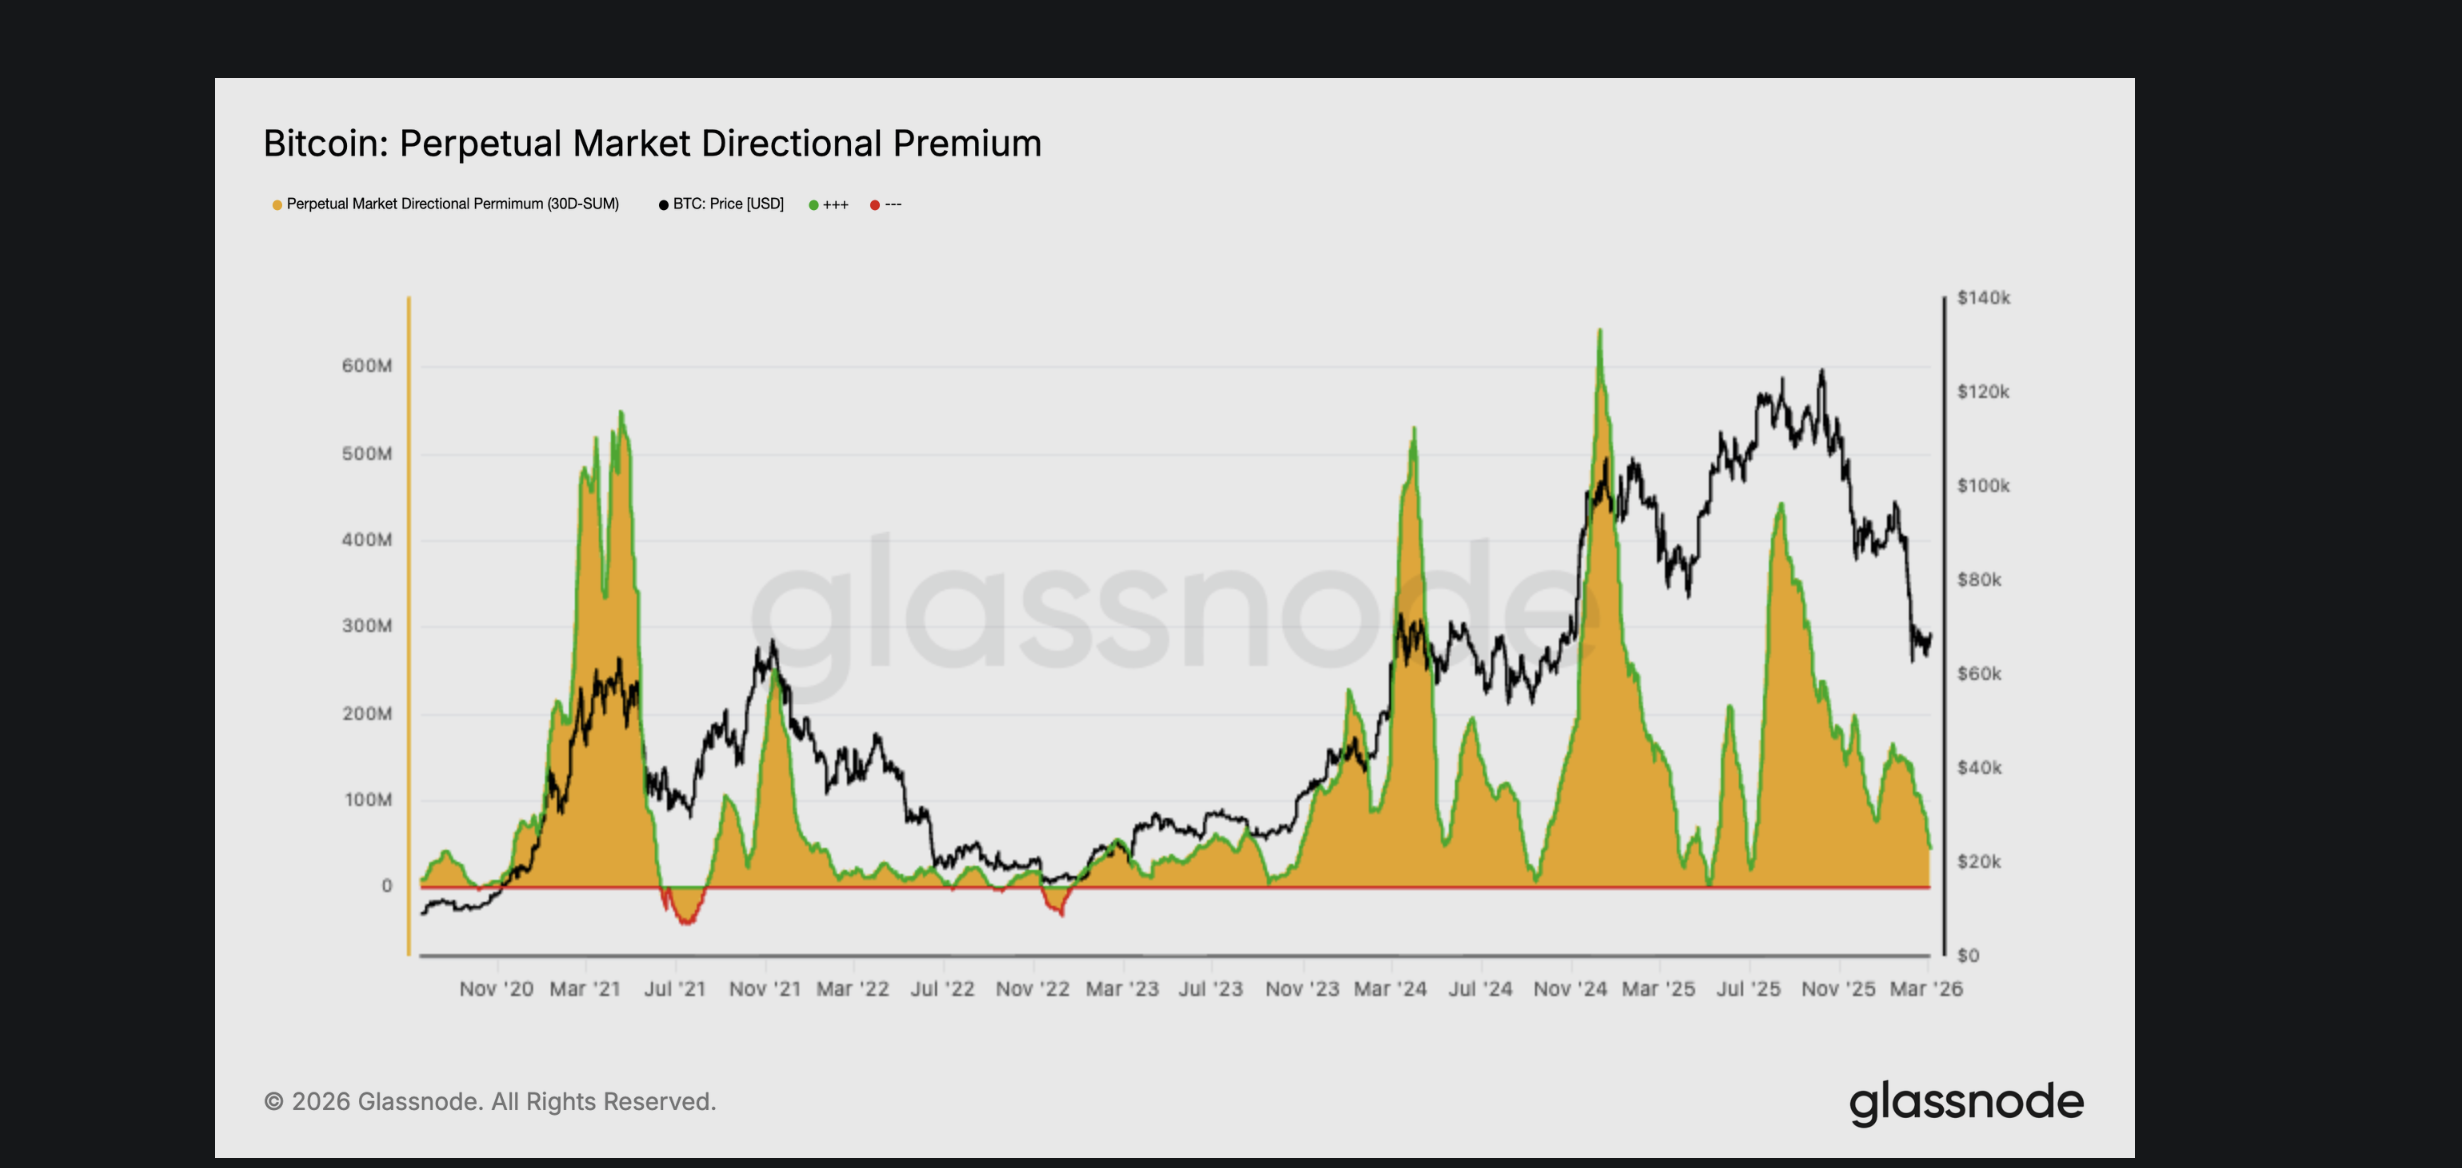 Speculative Exposure Missing: Glassnode Report
That premium remains compressed, confirming that speculative long exposure is absent. There’s simply no crowd building behind this move. While this hits bullish sentiment hard, it also raises the deleveraging hopes, as we all know how leverage has impacted previous rallies.
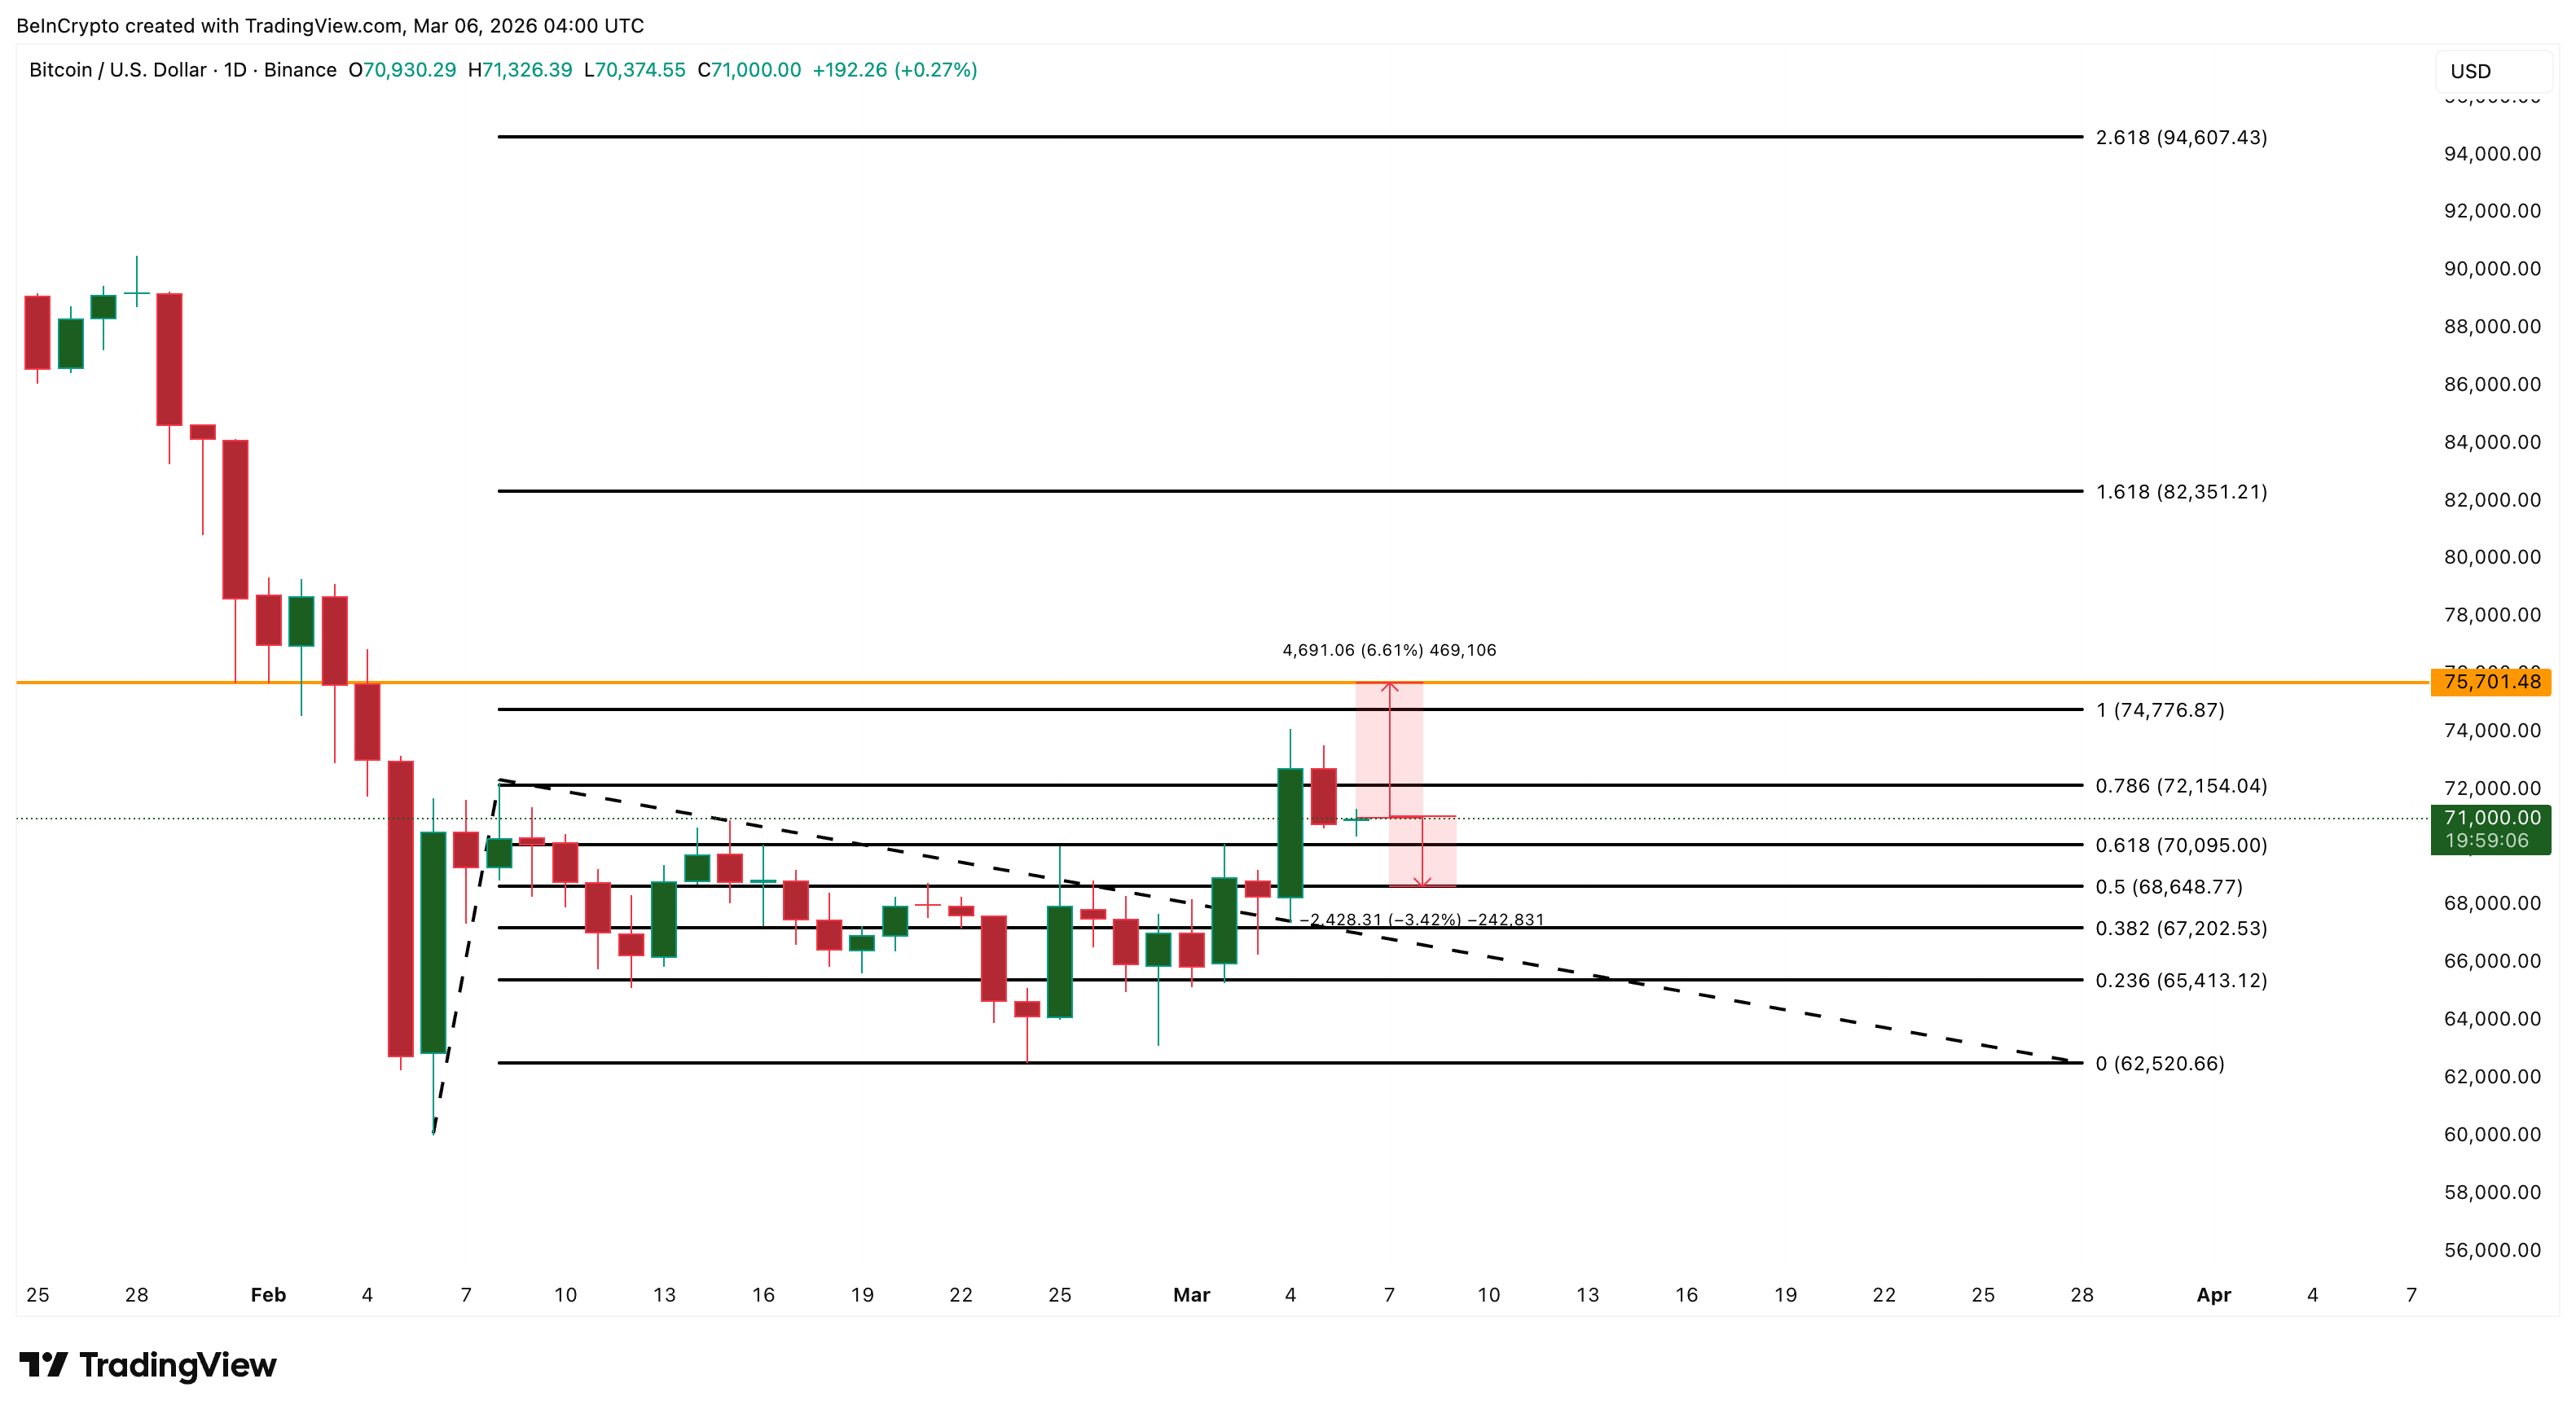
Key Bitcoin Price Levels That Define This Trade
The immediate resistance zone for the BTC price sits between $74,770 and $75,700 (more like the $75,000 zone).
The $75,000 zone is where roughly $2.3 billion in negative gamma is concentrated, with approximately $1.8 billion tied to the March 27 expiry alone.
Negative gamma is a condition where options dealers are forced to buy as the price rises and sell as it falls. Think of it as a dealer-driven short squeeze, where the buying isn’t coming from traders covering positions. It comes from dealers mechanically hedging their options exposure. The closer price gets to the strike, the more they have to buy, amplifying the move toward $75,000.
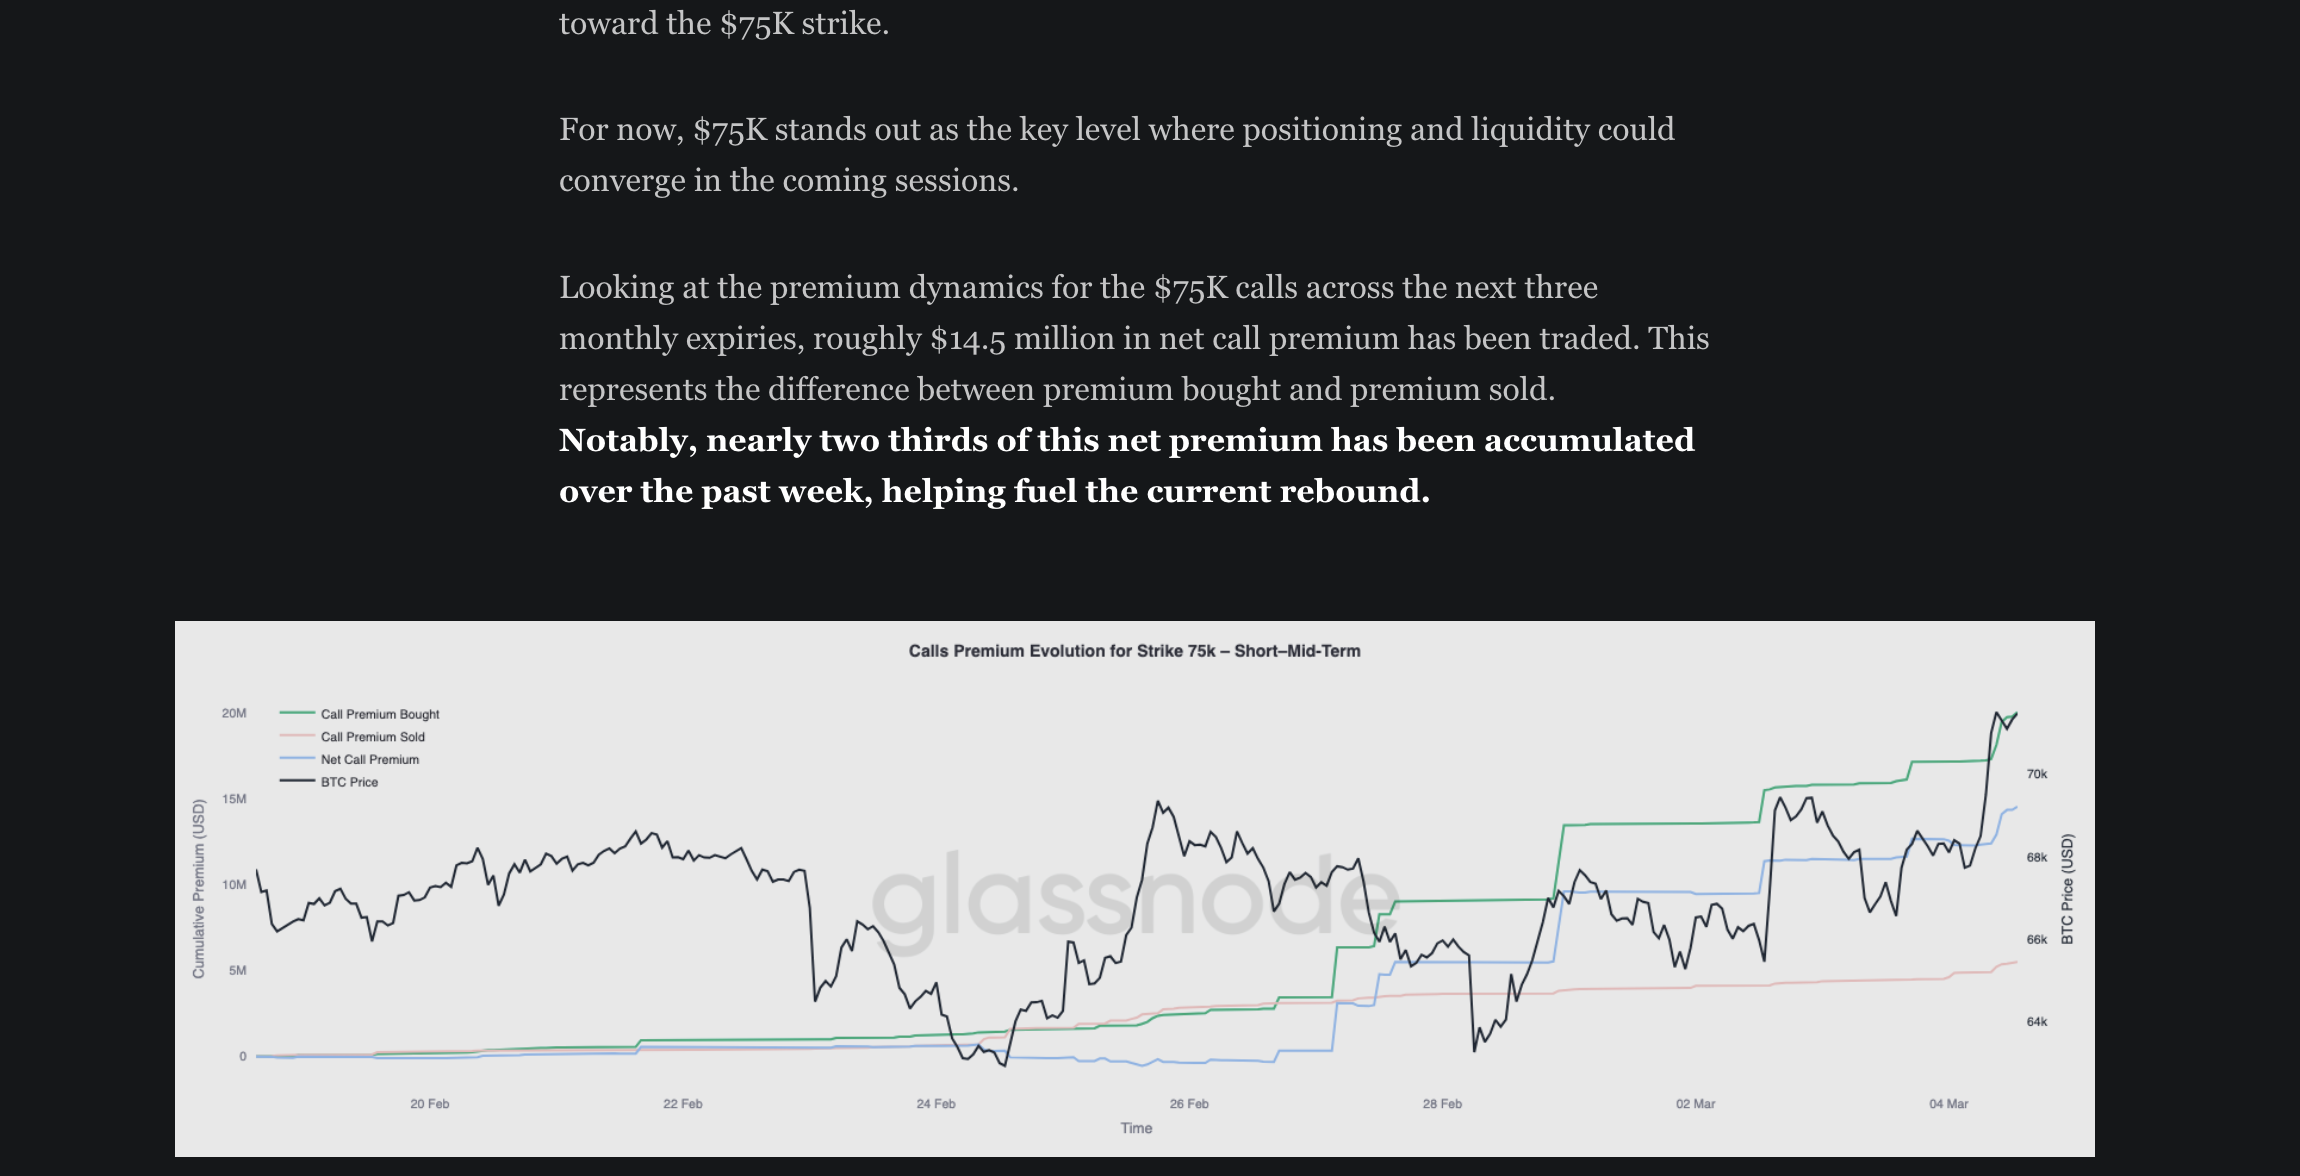 Why $75,000 Is Key: Glassnode Report
In this case, mechanically pulling the price toward $75,000. Glassnode’s report flags this as the key gamma magnet. That level is pulling the price now.
But once it arrives, those same dealers who were buying to hedge their positions have nothing left to buy. The mechanical bid disappears, and without fresh organic demand waiting above, the price tends to stall or reverse sharply from these zones. A daily close above both levels is needed to meaningfully shift the narrative.
The $72,150 level is the first resistance being tested right now.
 Bitcoin Price Analysis: TradingView
On the downside, $68,640 to $70,090 is the critical support band. This retracement range converges here with Glassnode’s short-term holder distribution floor. It is the zone where underwater recent buyers are most likely to capitulate if the price revisits. As long as Bitcoin holds daily closes above $68,640, tactical bounces remain valid.
Below that, $67,200 and $65,410 become the next logical targets. A sustained breakdown under $68,640 on a daily close opens the path toward the $62,520 swing low. That’s the worst-case level if distribution continues to accelerate.
0
0


 Manage all your crypto, NFT and DeFi from one place
Securely connect the portfolio you’re using to start.

0
0


0
0

0
0