Ethereum (ETH) Price Faces Profit-Taking Risk as 88% of Supply Turns Green

0
0

Ethereum’s recent push above $3,000 is facing pressure as profit-taking risks emerge.
On-chain signals and volume patterns hint at possible short-term Ethereum price weakness unless key levels break.
Over 88% of ETH in Profit Could Signal Local Top
According to Glassnode, 88.57% of the ETH supply was in profit as of July 14, with price hovering near $3,013. According to the one-month chart, whenever the ETH holders’ profit percentage surges, short-term corrections tend to follow.
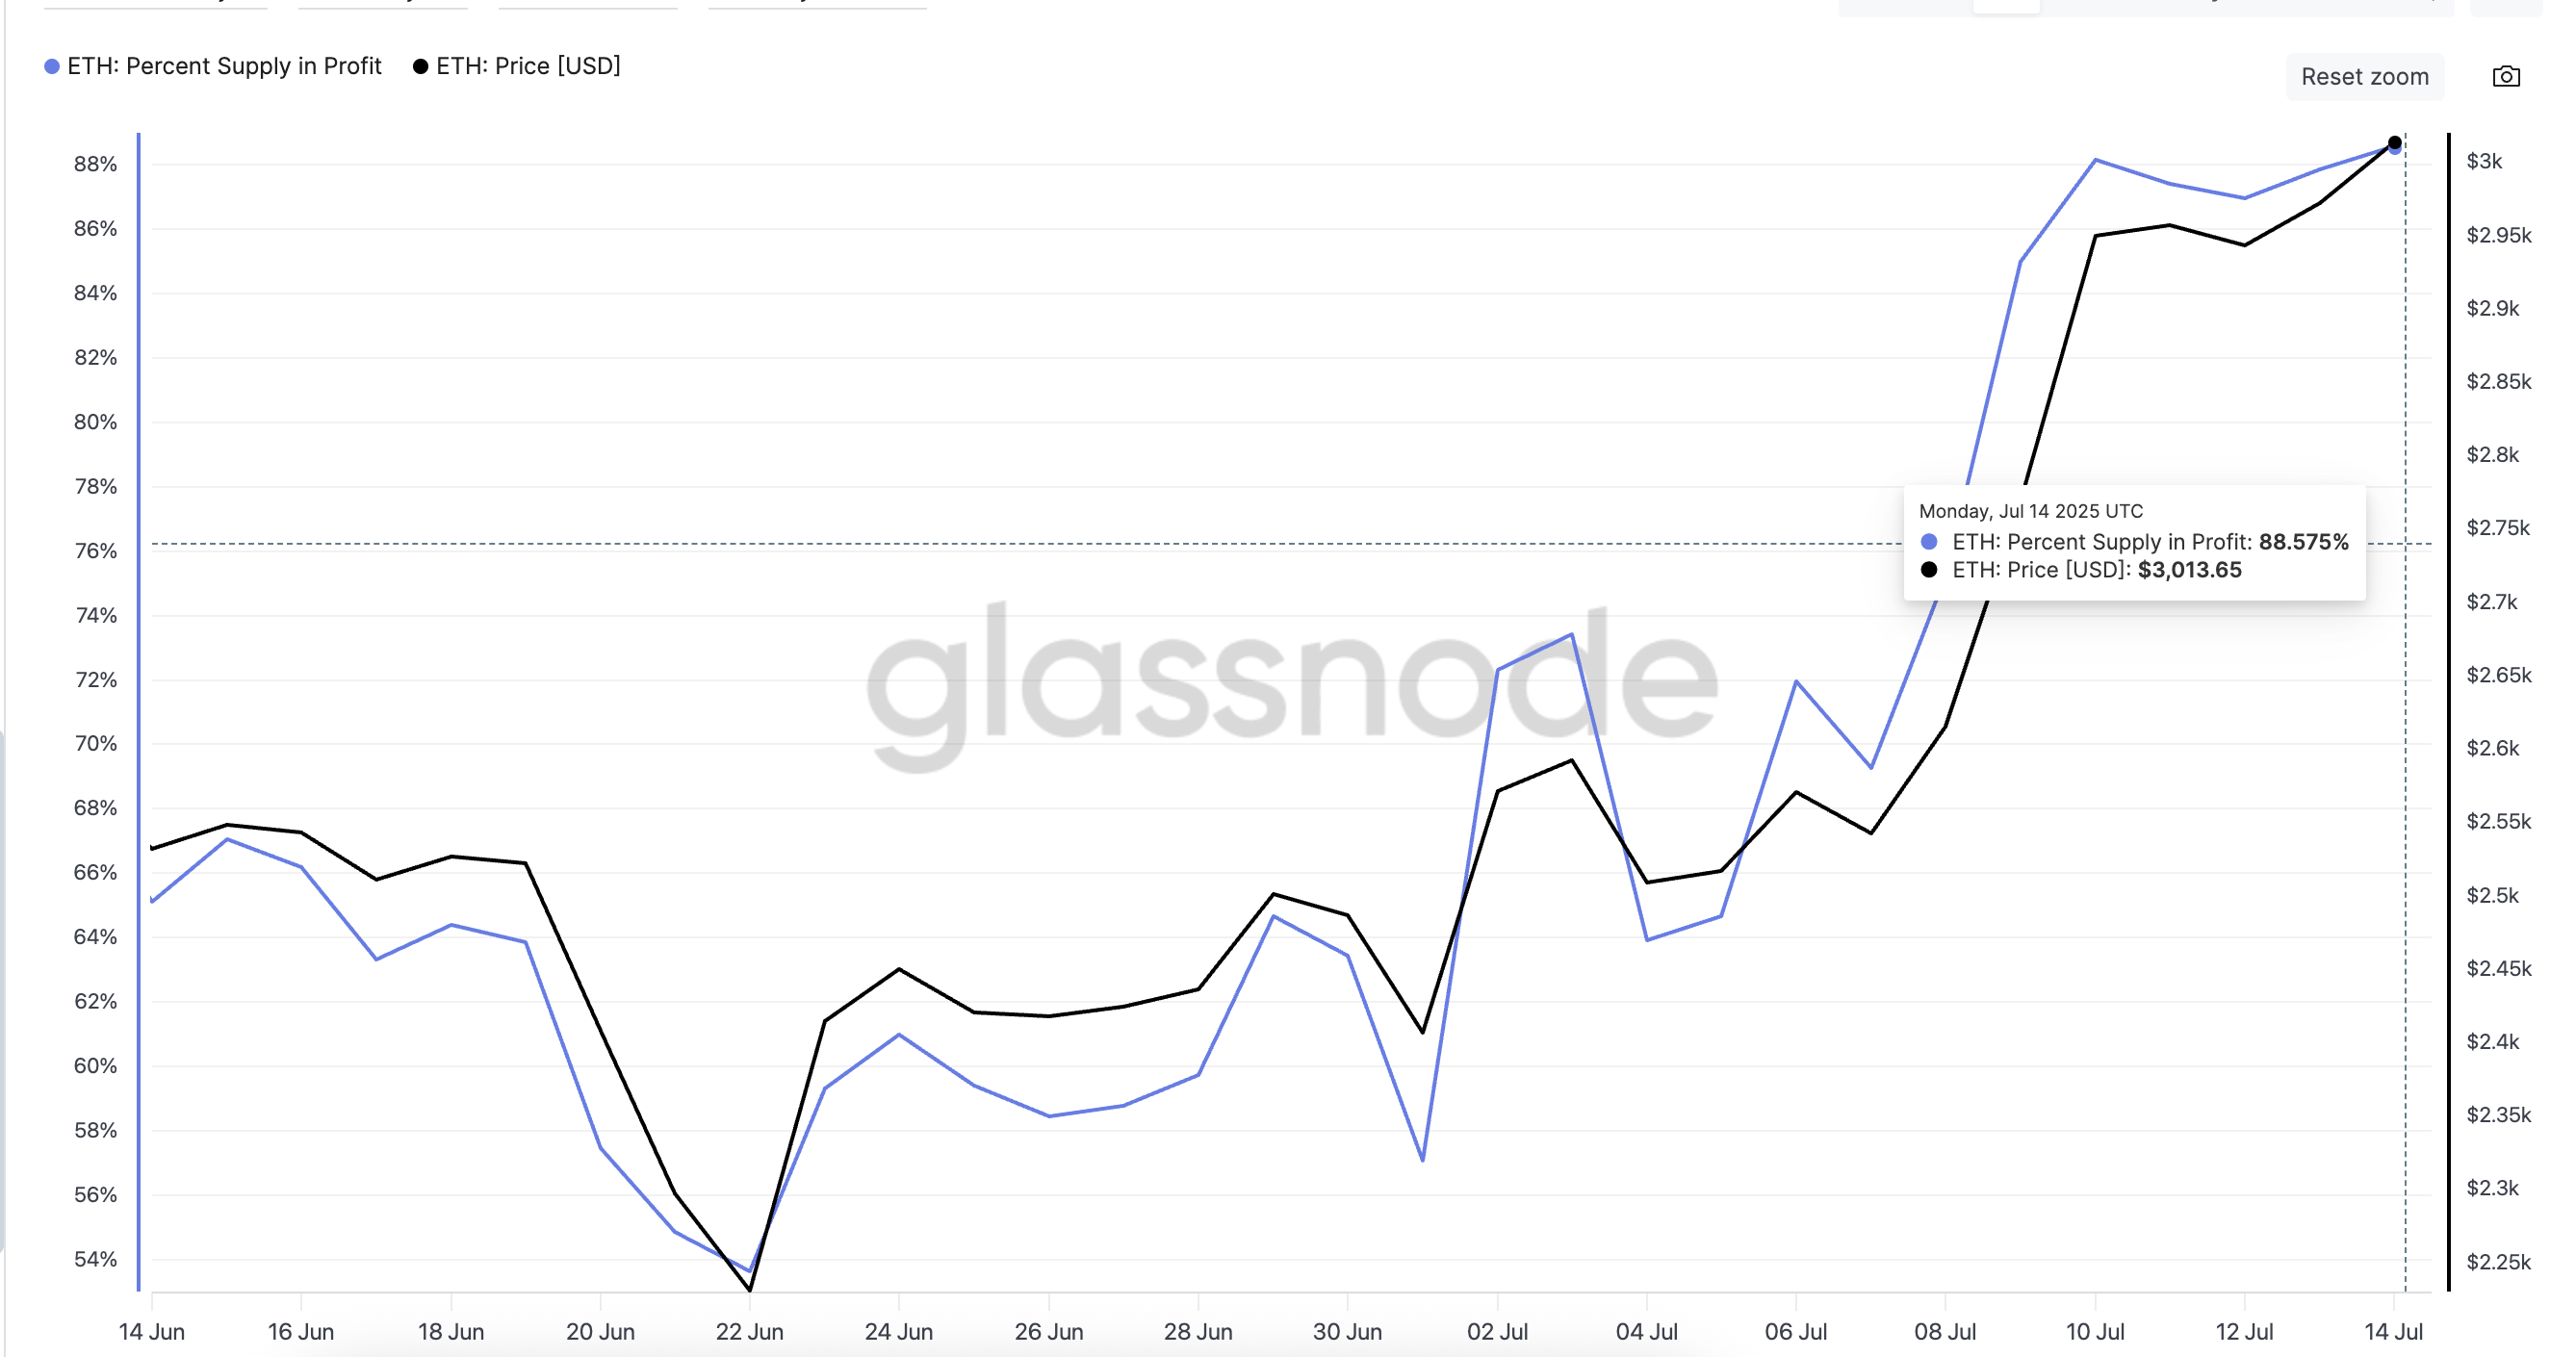 Ethereum price and supply (in profit) percentage: Glassnode
The Percent Supply in Profit metric tracks the proportion of circulating ETH whose acquisition cost is below the current market price. Spikes in this indicator often correspond to overheated rallies or post-rally exhaustion zones, something ETH is currently grappling with.
OBV Divergence Undermines Price Strength
While Ethereum price continued climbing from June 11 to July 14, On-Balance Volume (OBV) formed a lower high, confirming a bearish divergence. This means fewer traders are participating in the current leg up, a red flag for sustainability. The OBV risk was flagged here, hinting at a price correction.
Despite the correction happening, OBV hasn’t risen back and still poses another correction threat in the short term.
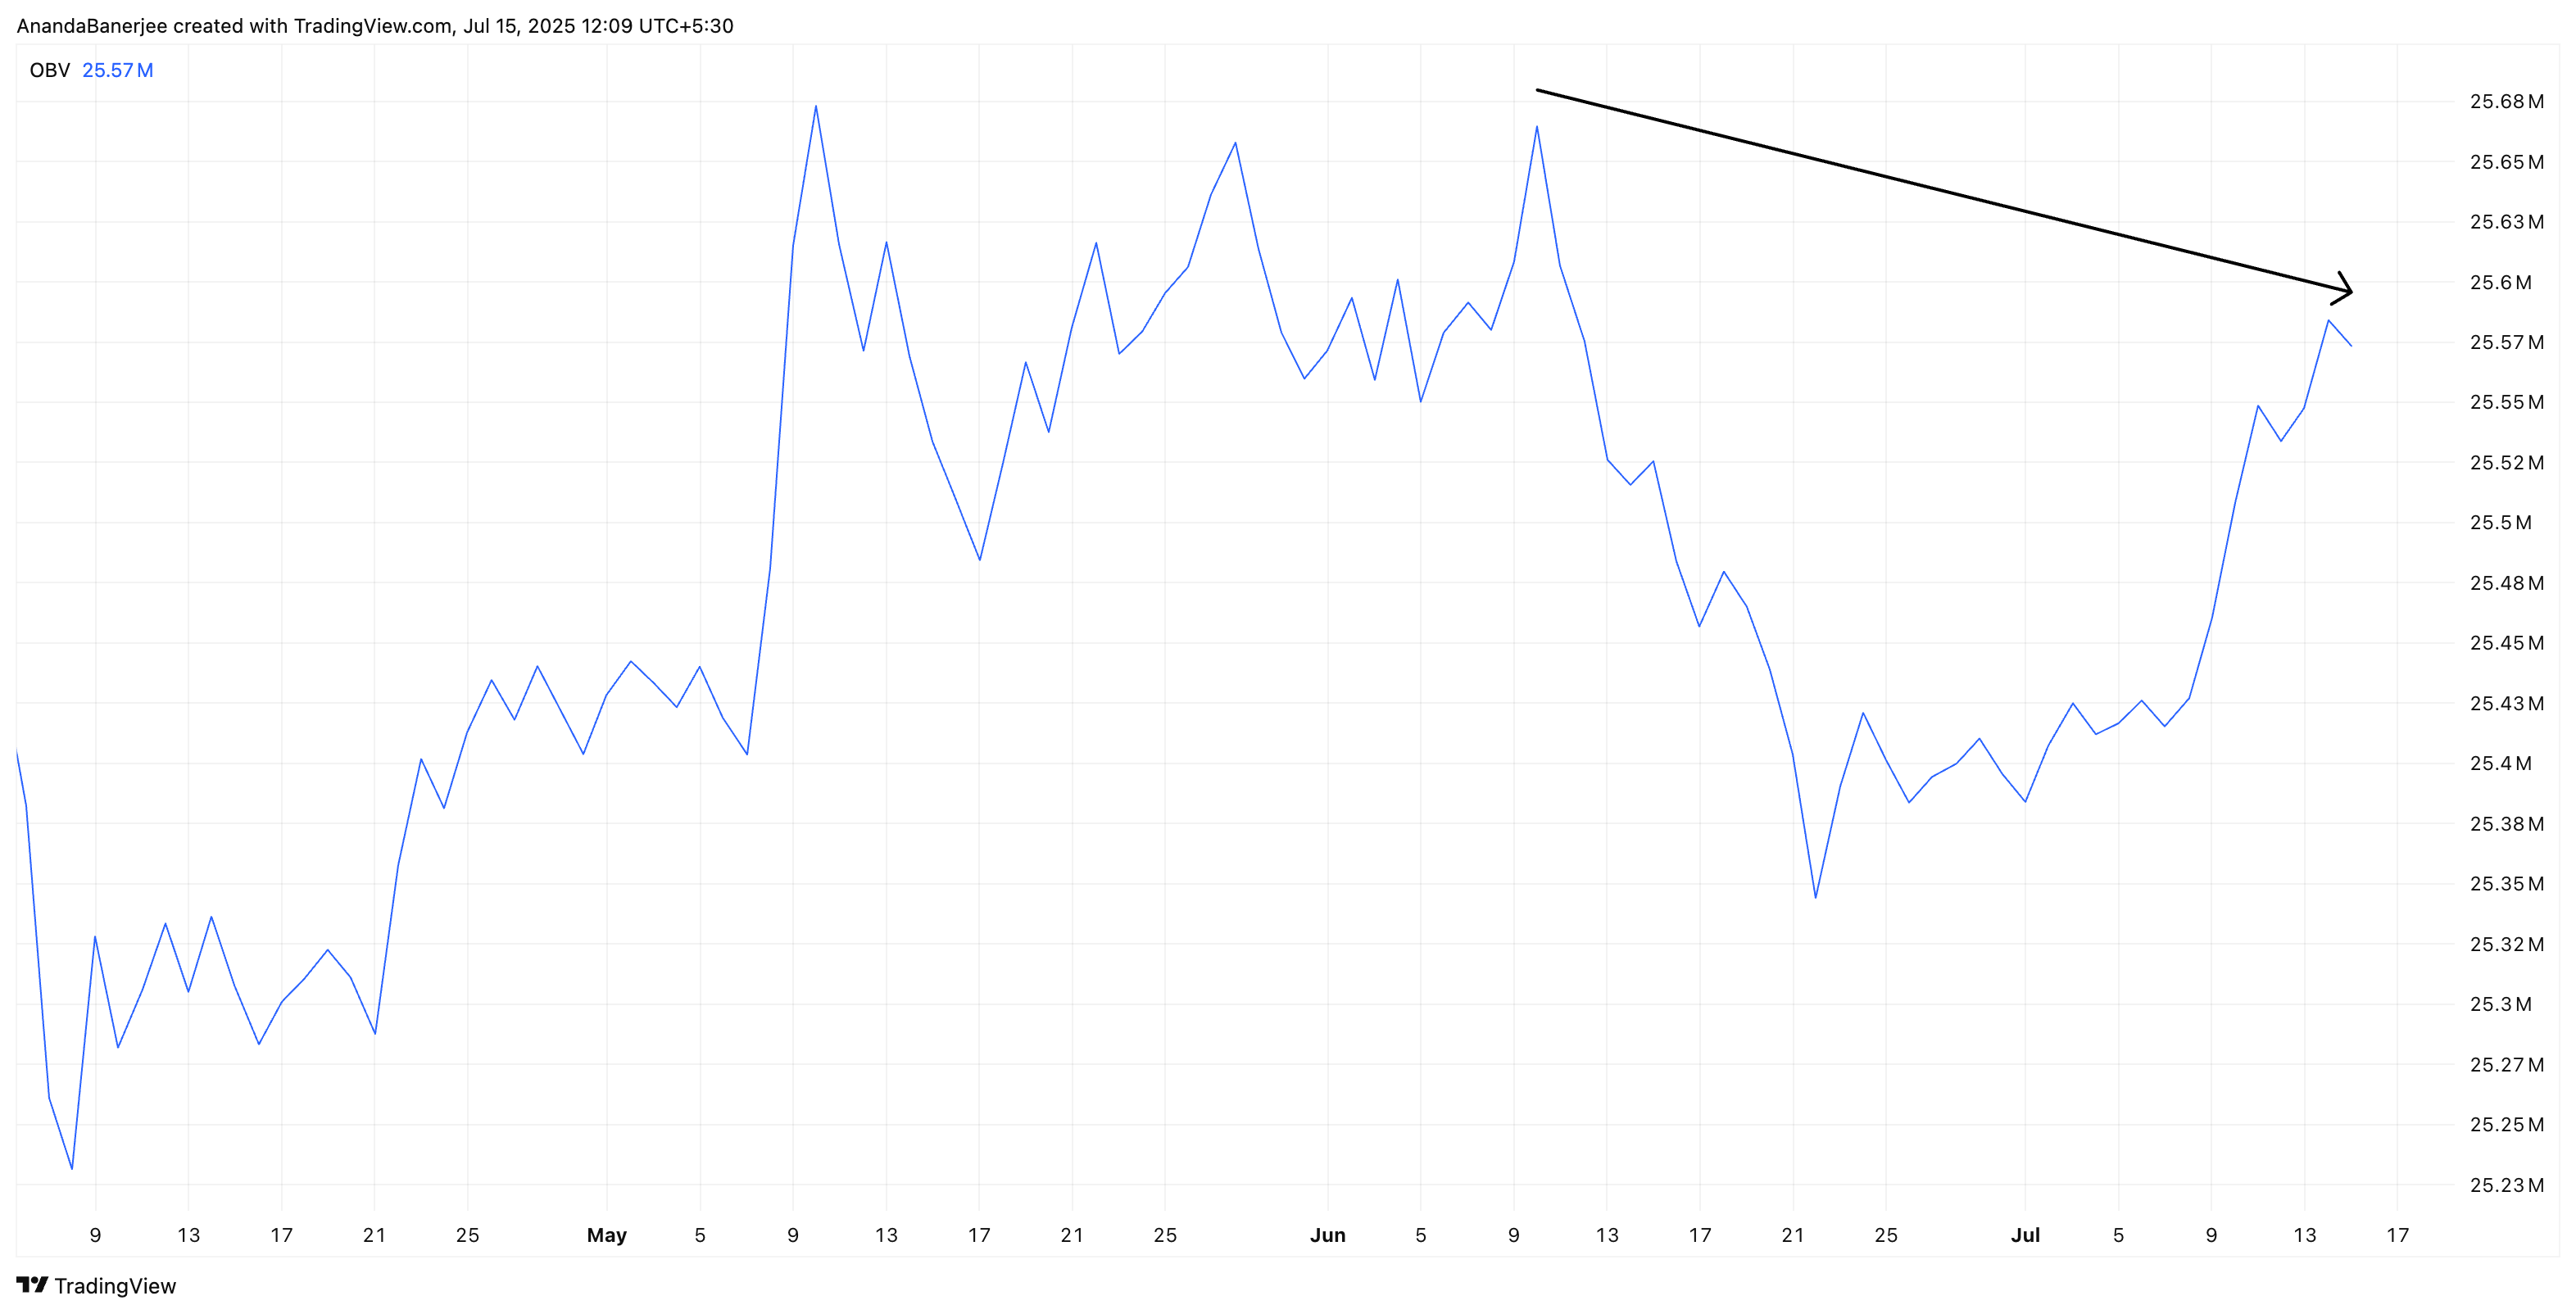 ETH OBV analysis: TradingView
OBV measures volume flow by adding volume on up days and subtracting it on down days. When OBV fails to keep up with price, it suggests weakening accumulation or growing seller strength behind the scenes.
Fibonacci Levels Offer Key ETH Price Support
ETH price hit resistance at $3,079. After being rejected at this zone, the price is now consolidating around $2,981.
Immediate retracement support for ETH lies at:
- 0.236 level: $2,853
- 0.382 level: $2,713
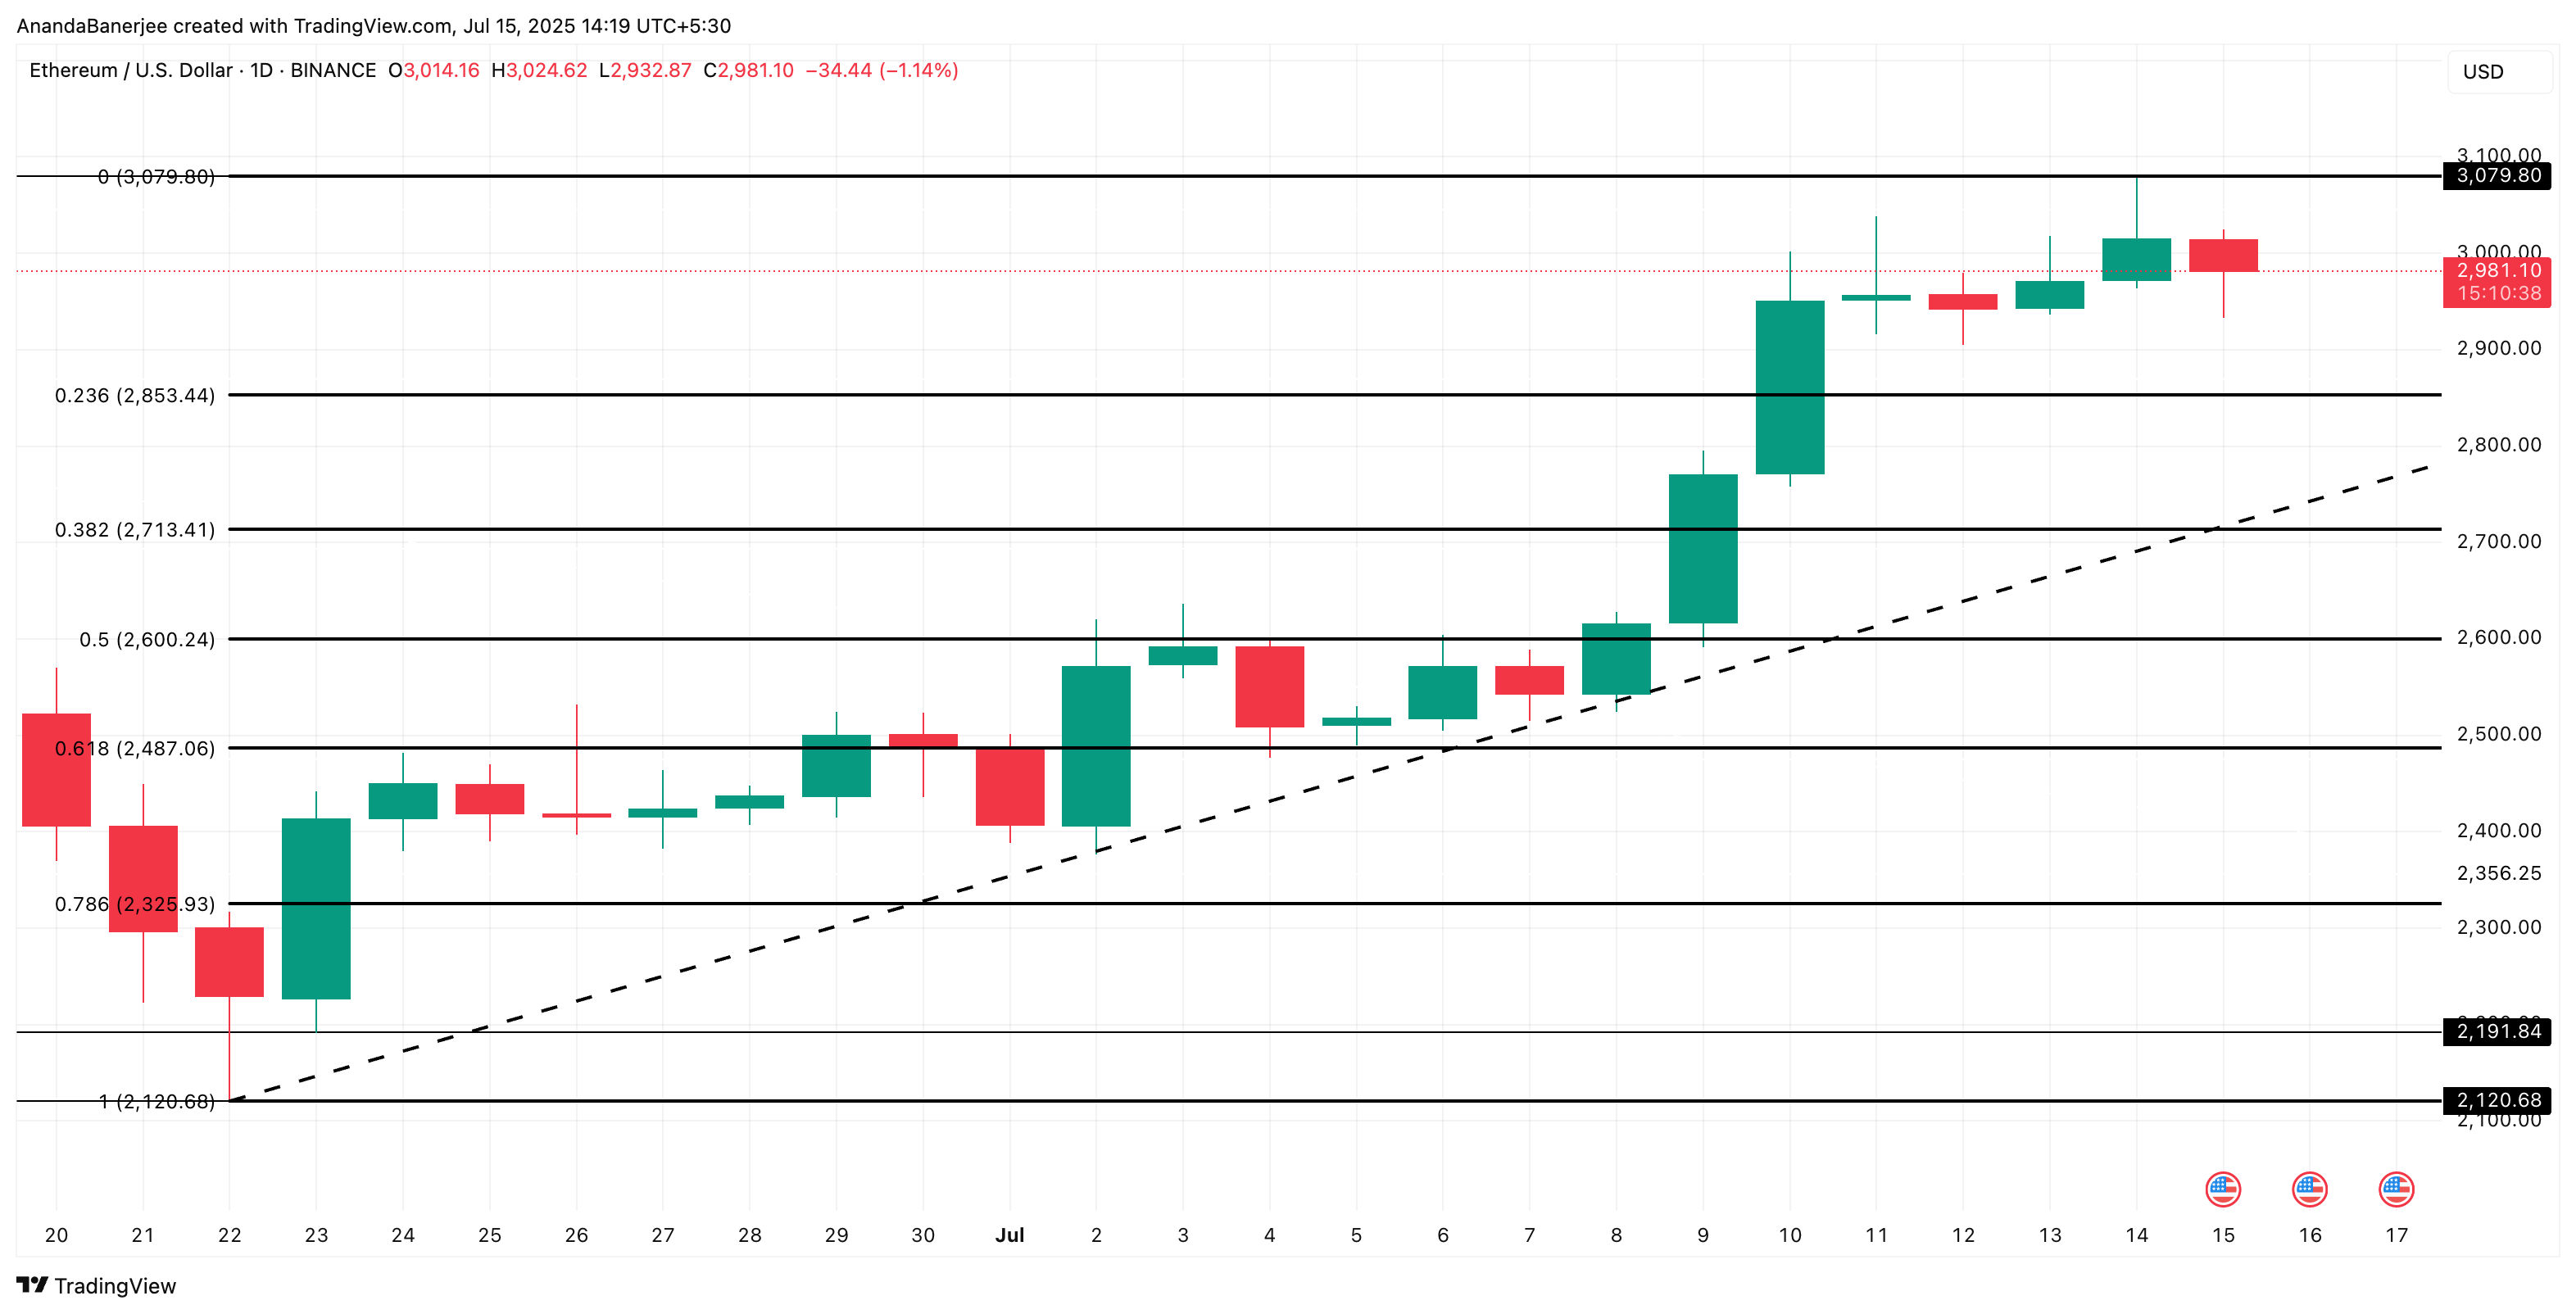 Ethereum price analysis: TradingView
However, the ETH price chart suggests that $2,600 (0.5 Fib level) and $2,487 (0.618 Fib level) are the most critical support zones. These need to be breached for the overall structure to turn bearish.
The broader bullish structure still holds as long as Ethereum stays above $2,713, as it coincides with a key breakout candle.
If Ethereum breaks and closes above $3,079 (its recent swing high), and OBV begins trending upward, the short-term bearish hypothesis will be invalidated. This would signal renewed buying conviction and potentially open the path to higher levels.
Until then, profit-taking and volume divergence suggest caution, especially as ETH hovers at a historically saturated profit level.
0
0


 Manage all your crypto, NFT and DeFi from one place
Securely connect the portfolio you’re using to start.


0
0