Whales Go Long on Solana Despite the 40% Price Crash — What Are They Seeing?

0
0

Solana price has fallen sharply in recent weeks, losing nearly 40% in a month and more than 54% since its January peak. The trend still looks weak, and most traders continue betting on further downside. Yet some whales are doing the opposite. They are opening aggressive long positions even as the market remains bearish.
This creates a clear divide. The trend still points down, but certain signals suggest early reversal conditions may be forming. The key question now is simple. What exactly are these whales seeing?
Whale Long Bets Appear Even As Solana Tests Critical Reversal Conditions
Solana’s broader trend remains bearish, but early reversal signals are beginning to appear. The first signal comes from the relationship between price and the Relative Strength Index (RSI). RSI is a momentum indicator that measures whether selling pressure is strengthening or weakening.
Since November 21, the Solana price has continued making lower lows. However, RSI has started forming a higher low. This creates a bullish divergence, which often signals that sellers are losing strength. However, this reversal signal is not confirmed yet. For confirmation, two conditions must hold.
First, Solana’s next daily candle must form above $77, which is the current low of the latest candle. If the next candle closes above this level, it will confirm that sellers failed to push the SOL price lower.
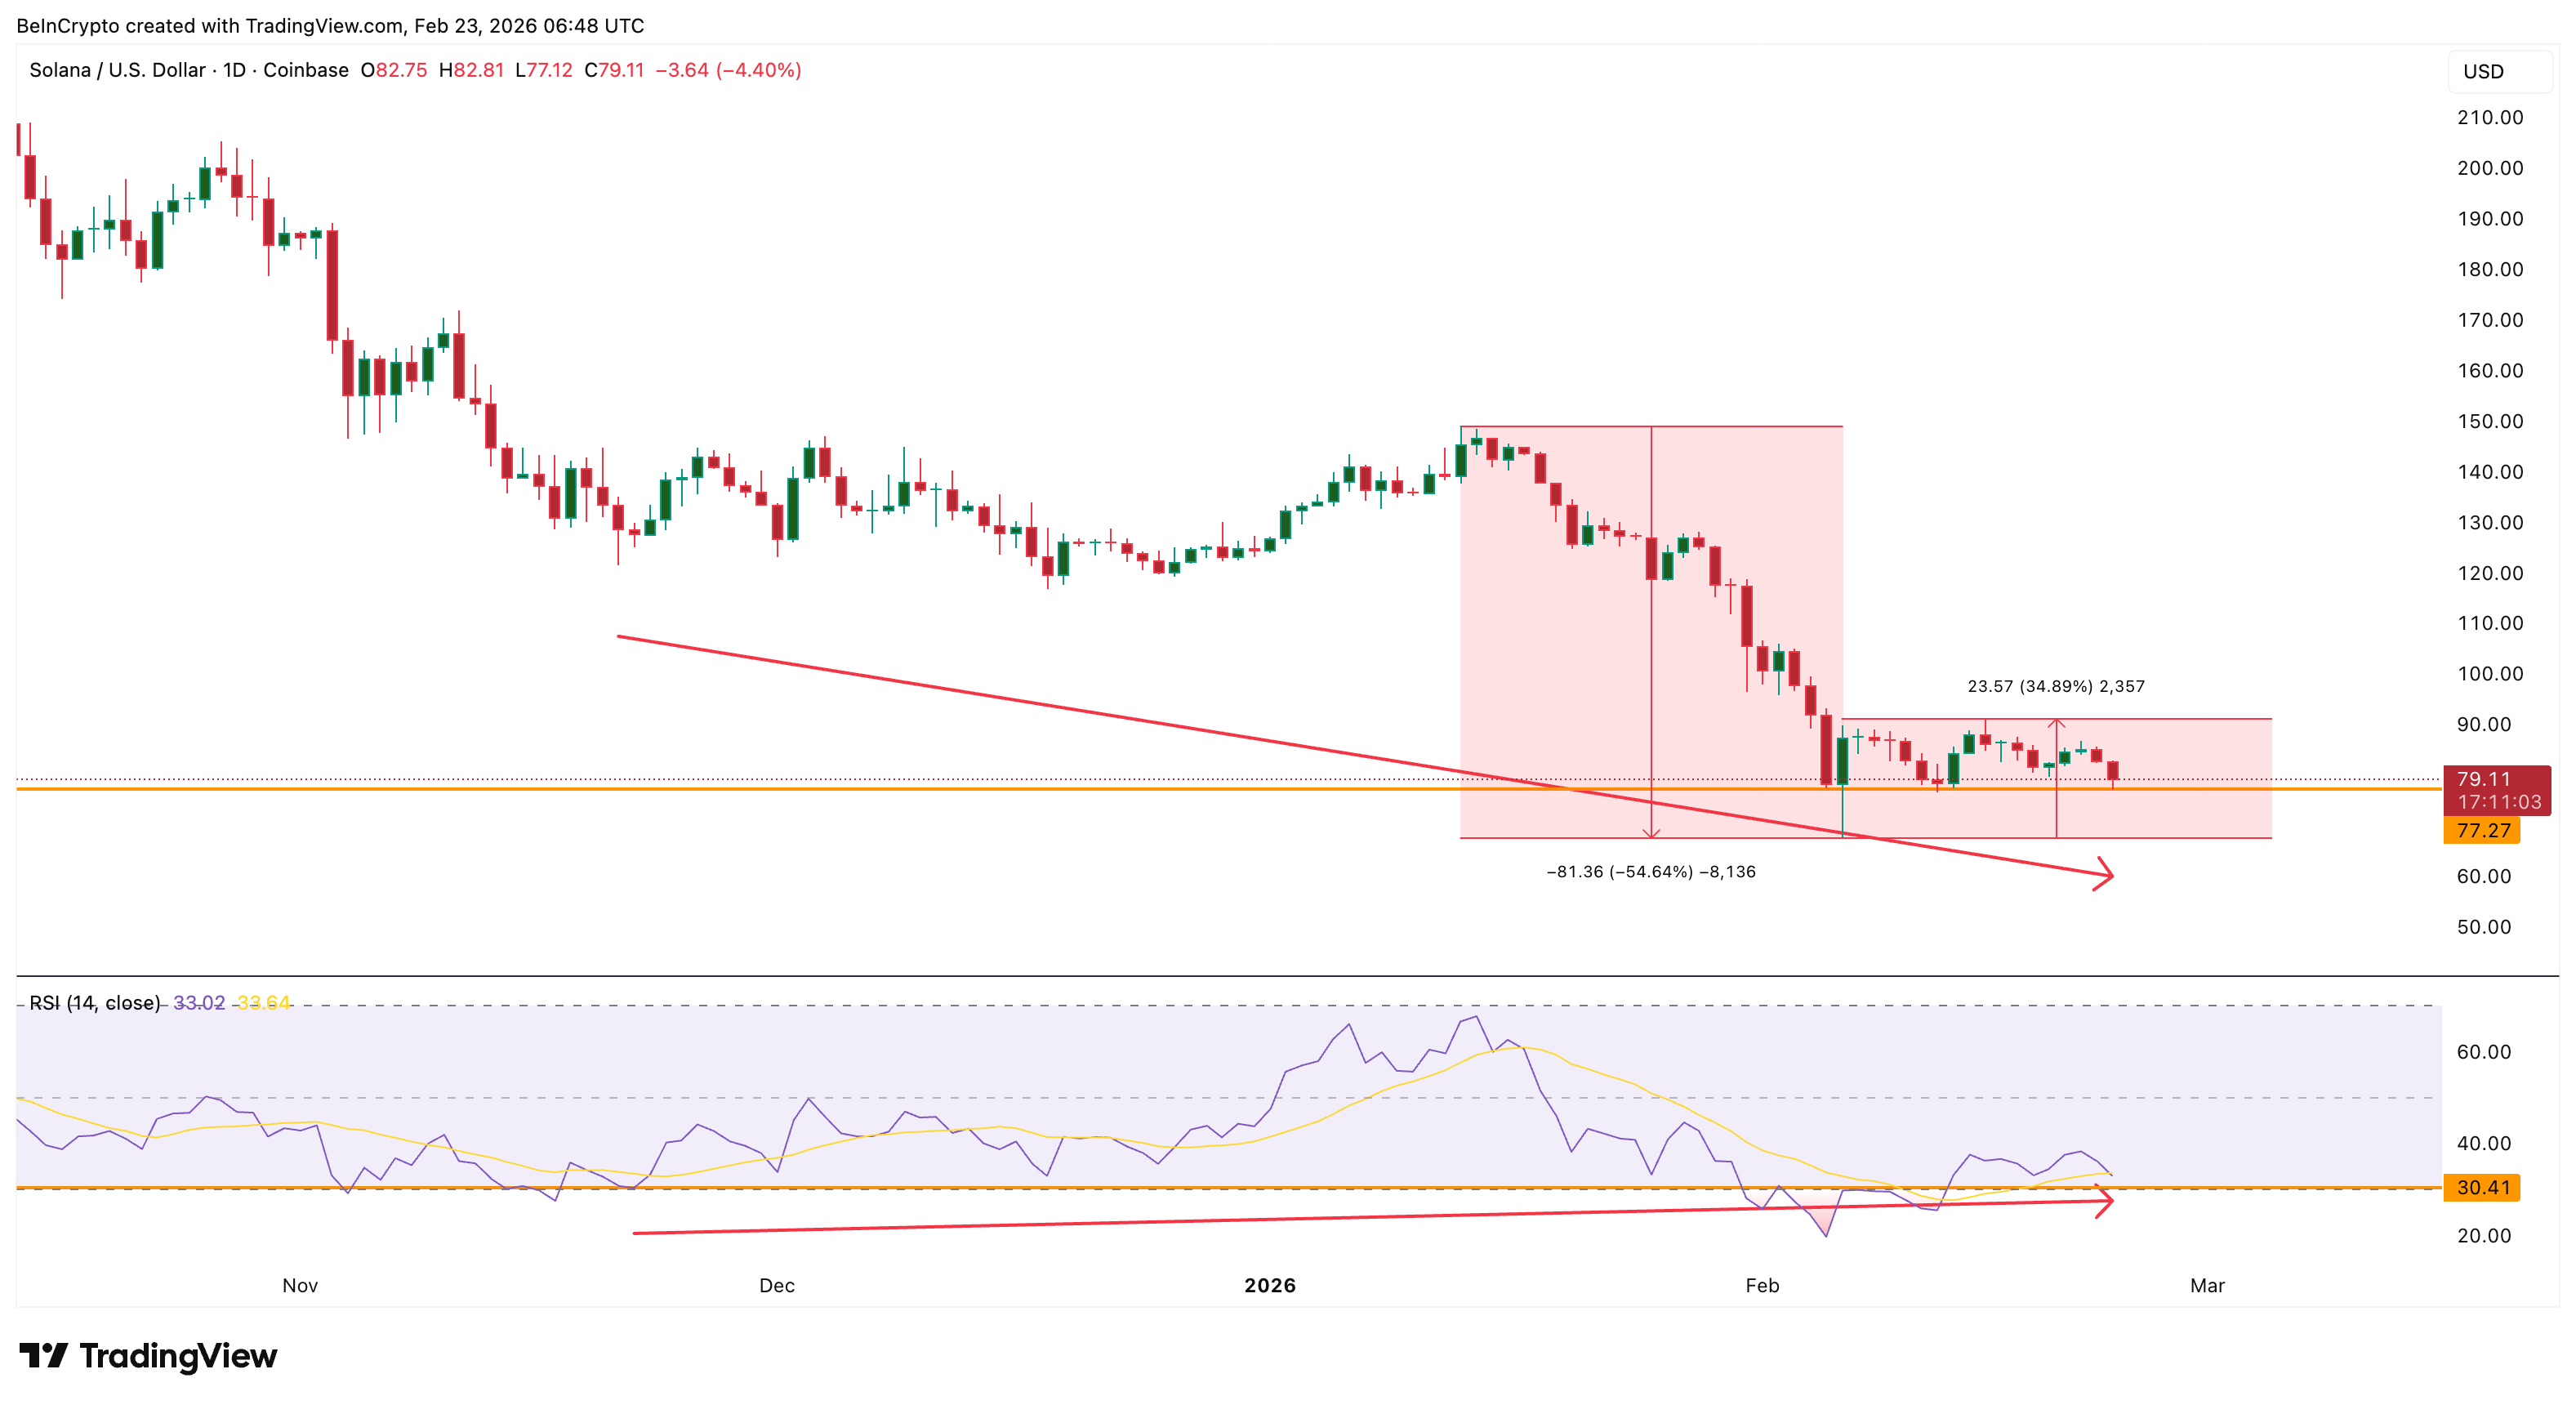 Solana Reversal Building: TradingView
Second, the RSI must remain above 30, the previous low hit on November 21. If RSI drops under 30, it would invalidate the bullish divergence and confirm continued weakness. As long as $77 holds and RSI stays above 30 (the second confirmation is more important), the early reversal structure remains intact.
This explains why some whales are positioning early.
One whale recently deposited $2 million in USDC and opened a 20× leveraged long position on Solana, despite the ongoing downtrend.
However, the broader derivatives market still disagrees with this bullish view. Open interest increased from $1.93 billion to $1.98 billion, a 2.6% rise. At the same time, funding rates dropped sharply from -0.005% to -0.032%, a 540% deeper move into negative territory.
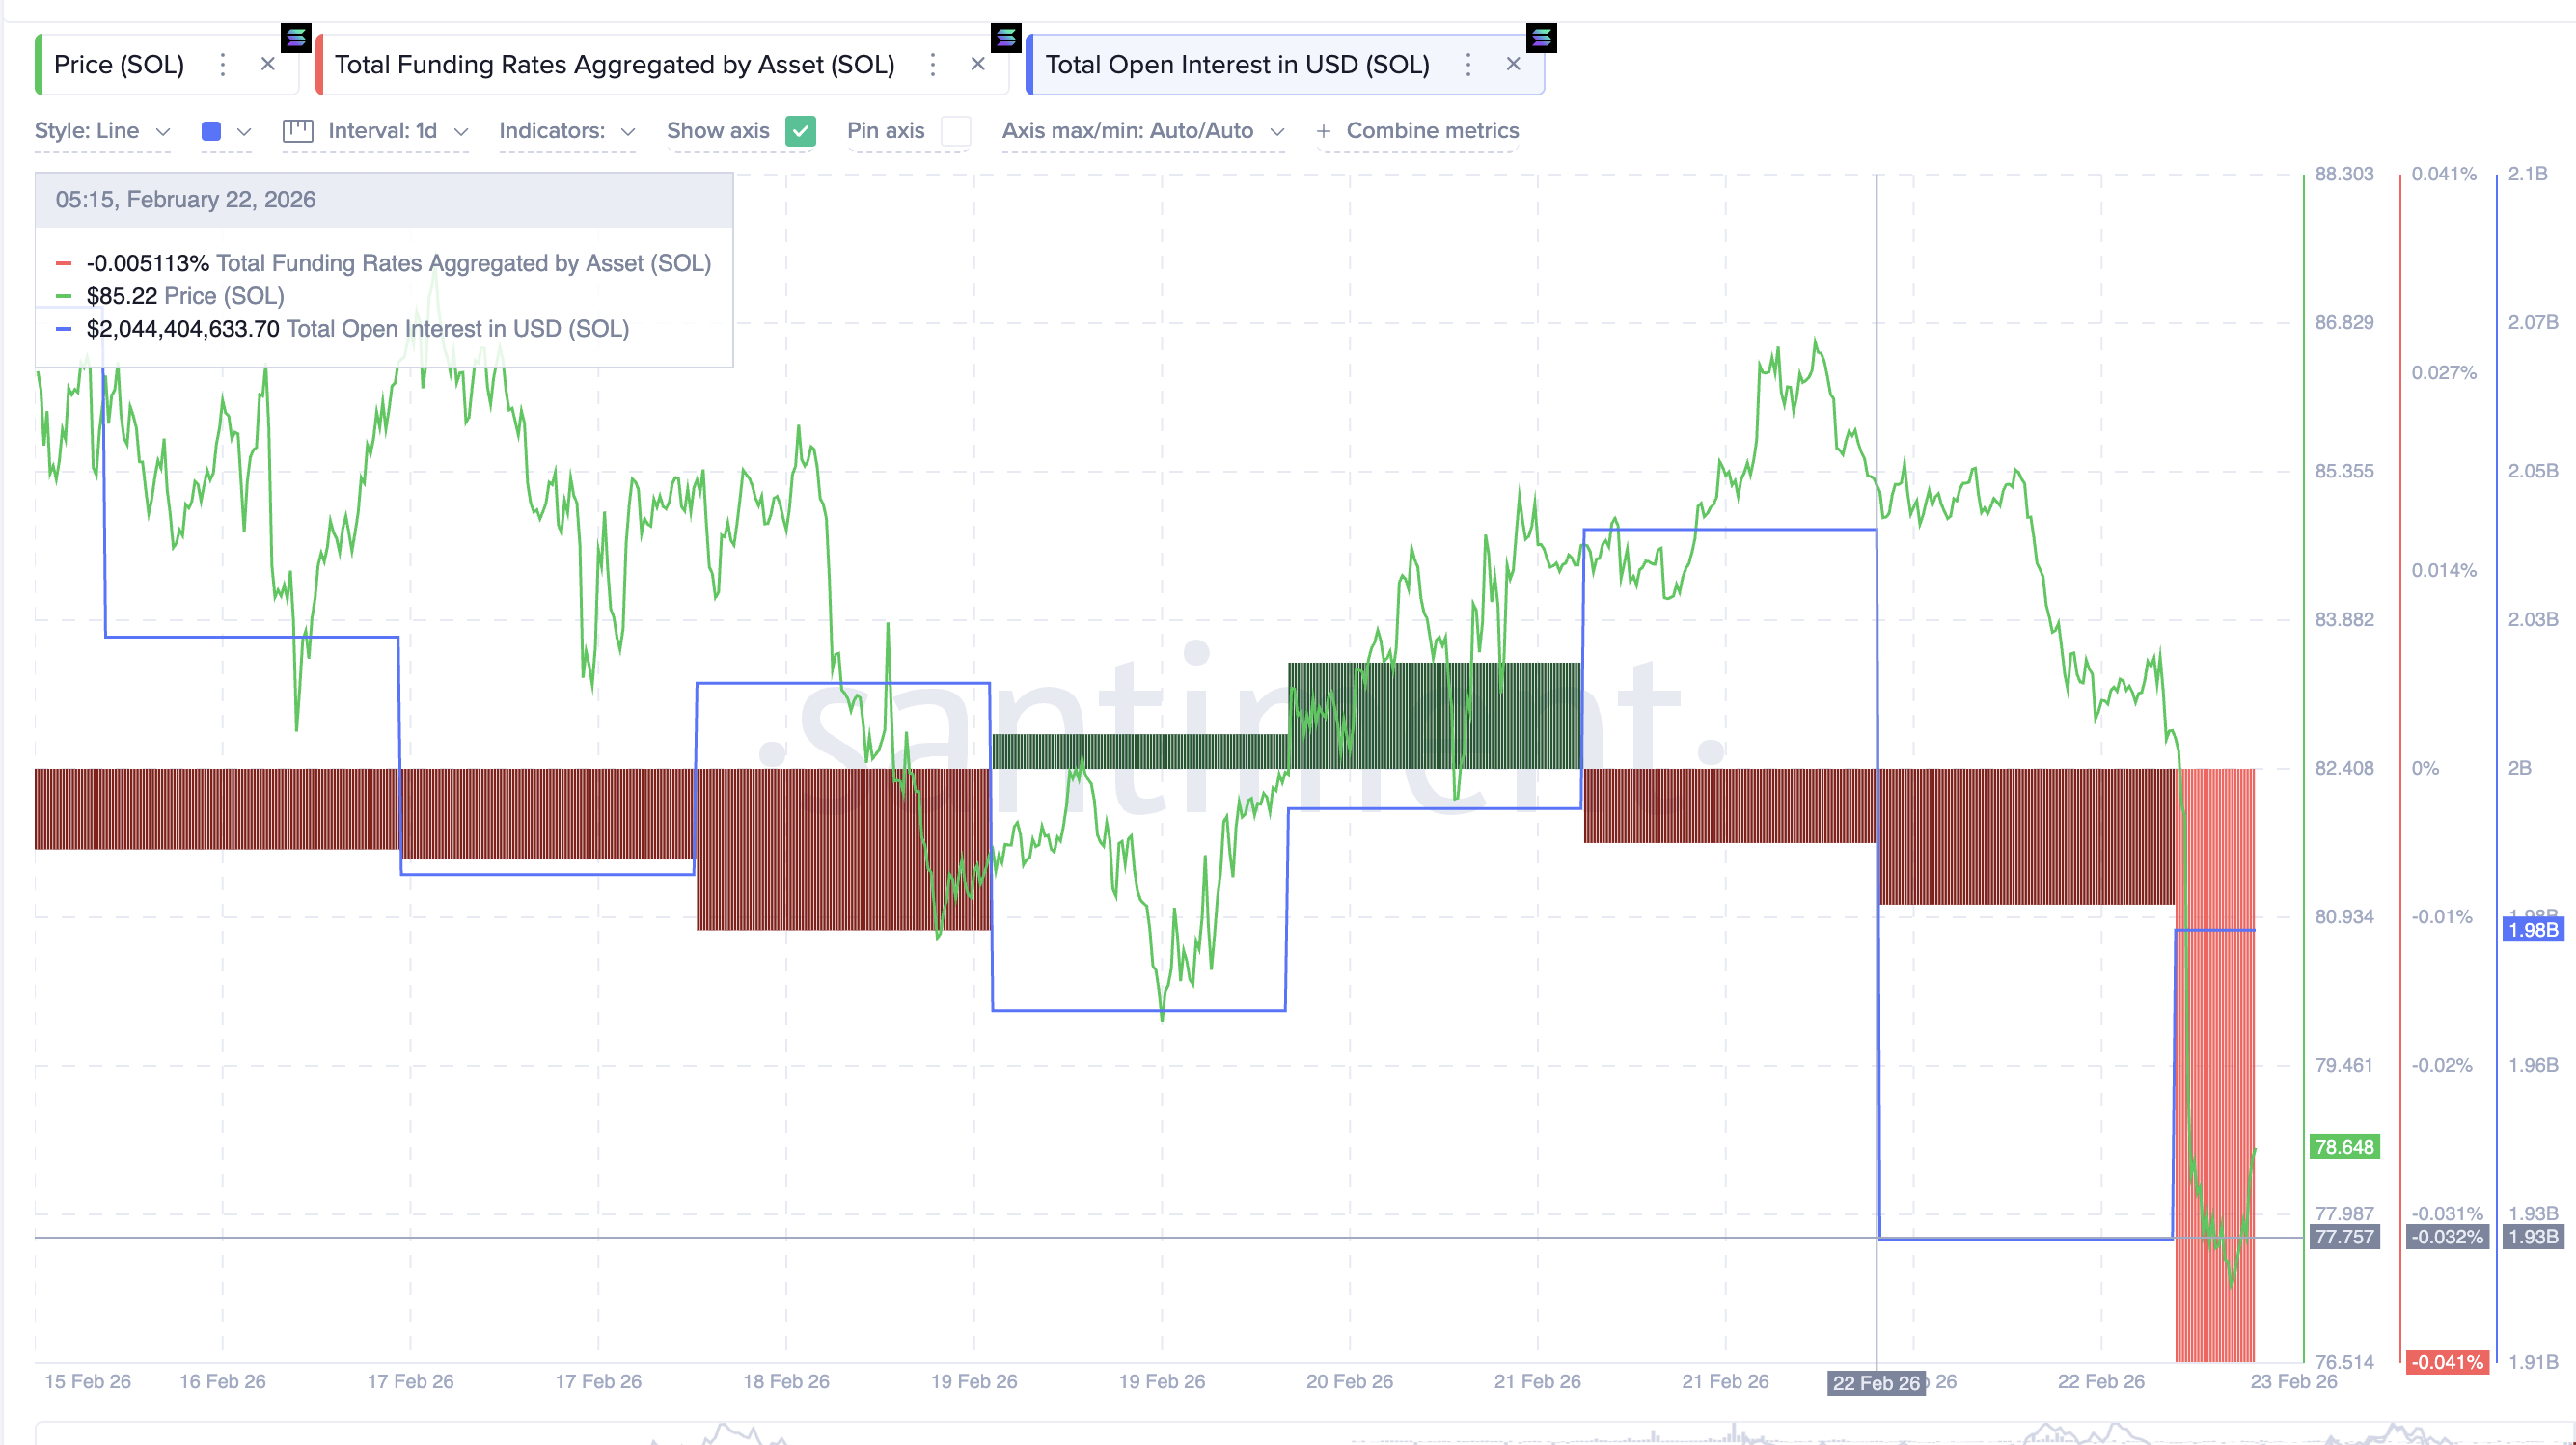 SOL Open Interest: Santiment
This shows the market is heavily betting on further downside. So why are experienced holders accumulating while most traders remain bearish? There has to be something more than the unconfirmed reversal setup.
Long-Term Holder Accumulation And Institutional Activity Suggest Hidden Strength
Long-term holder behavior provides important clues. The Hodler Net Position Change, which tracks whether long-term investors are buying or selling, shows a sharp increase in accumulation. Long-term holders increased their net buying from 786,539 SOL to 972,417 SOL in one day, a 23.6% rise.
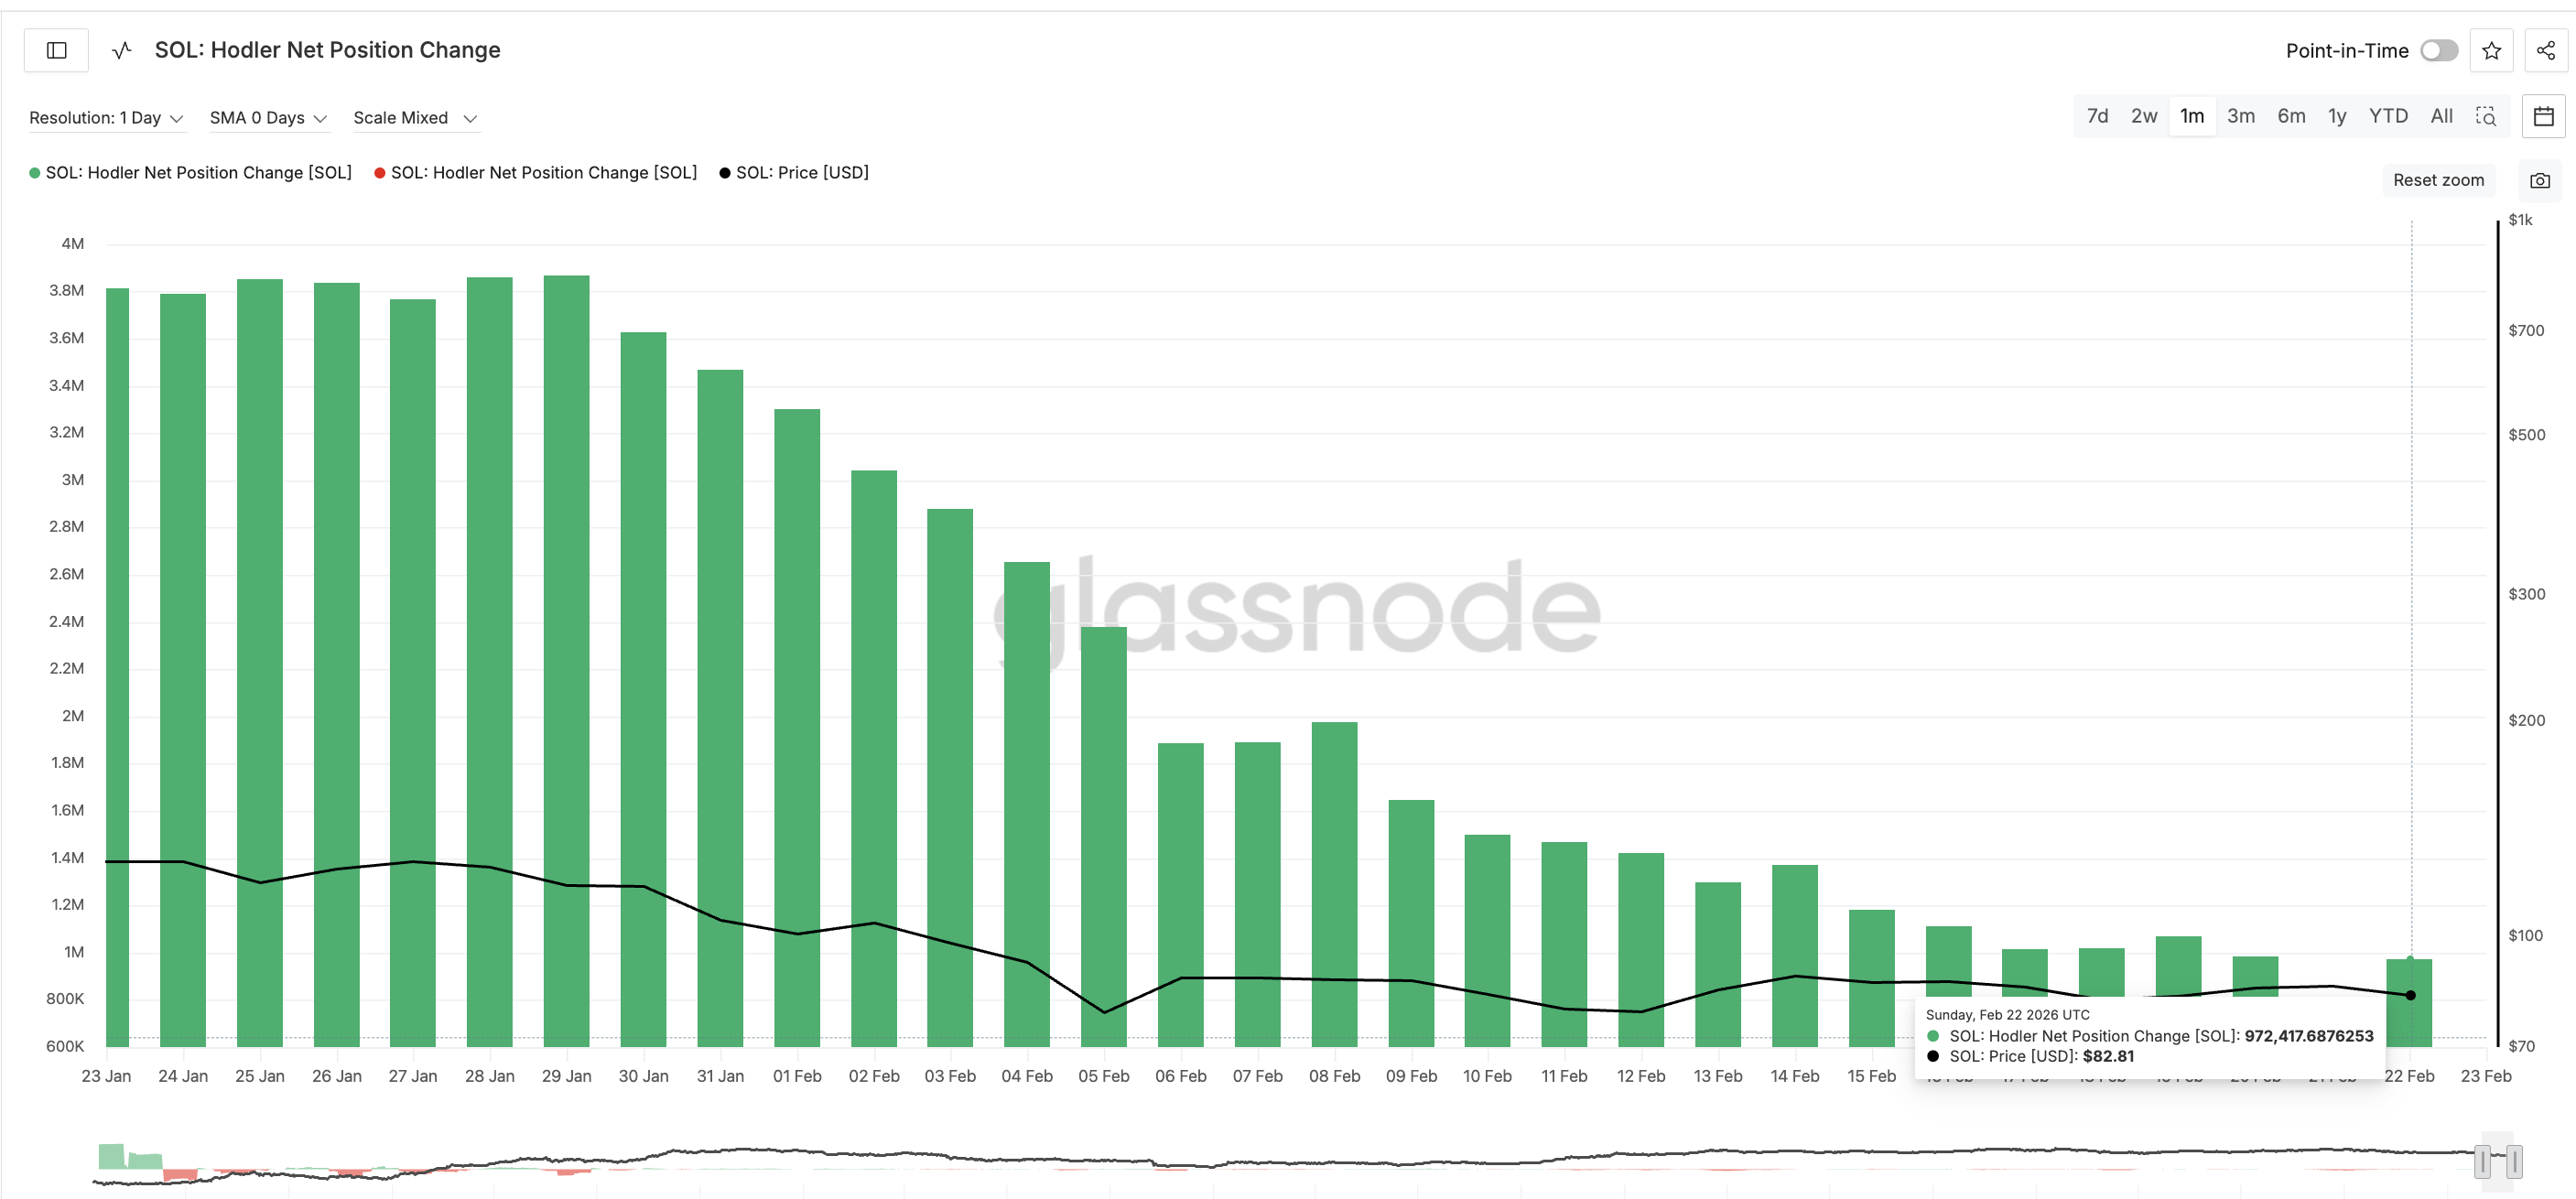 Solana Holders: Glassnode
Want more token insights like this? Sign up for Editor Harsh Notariya’s Daily Crypto Newsletter here.
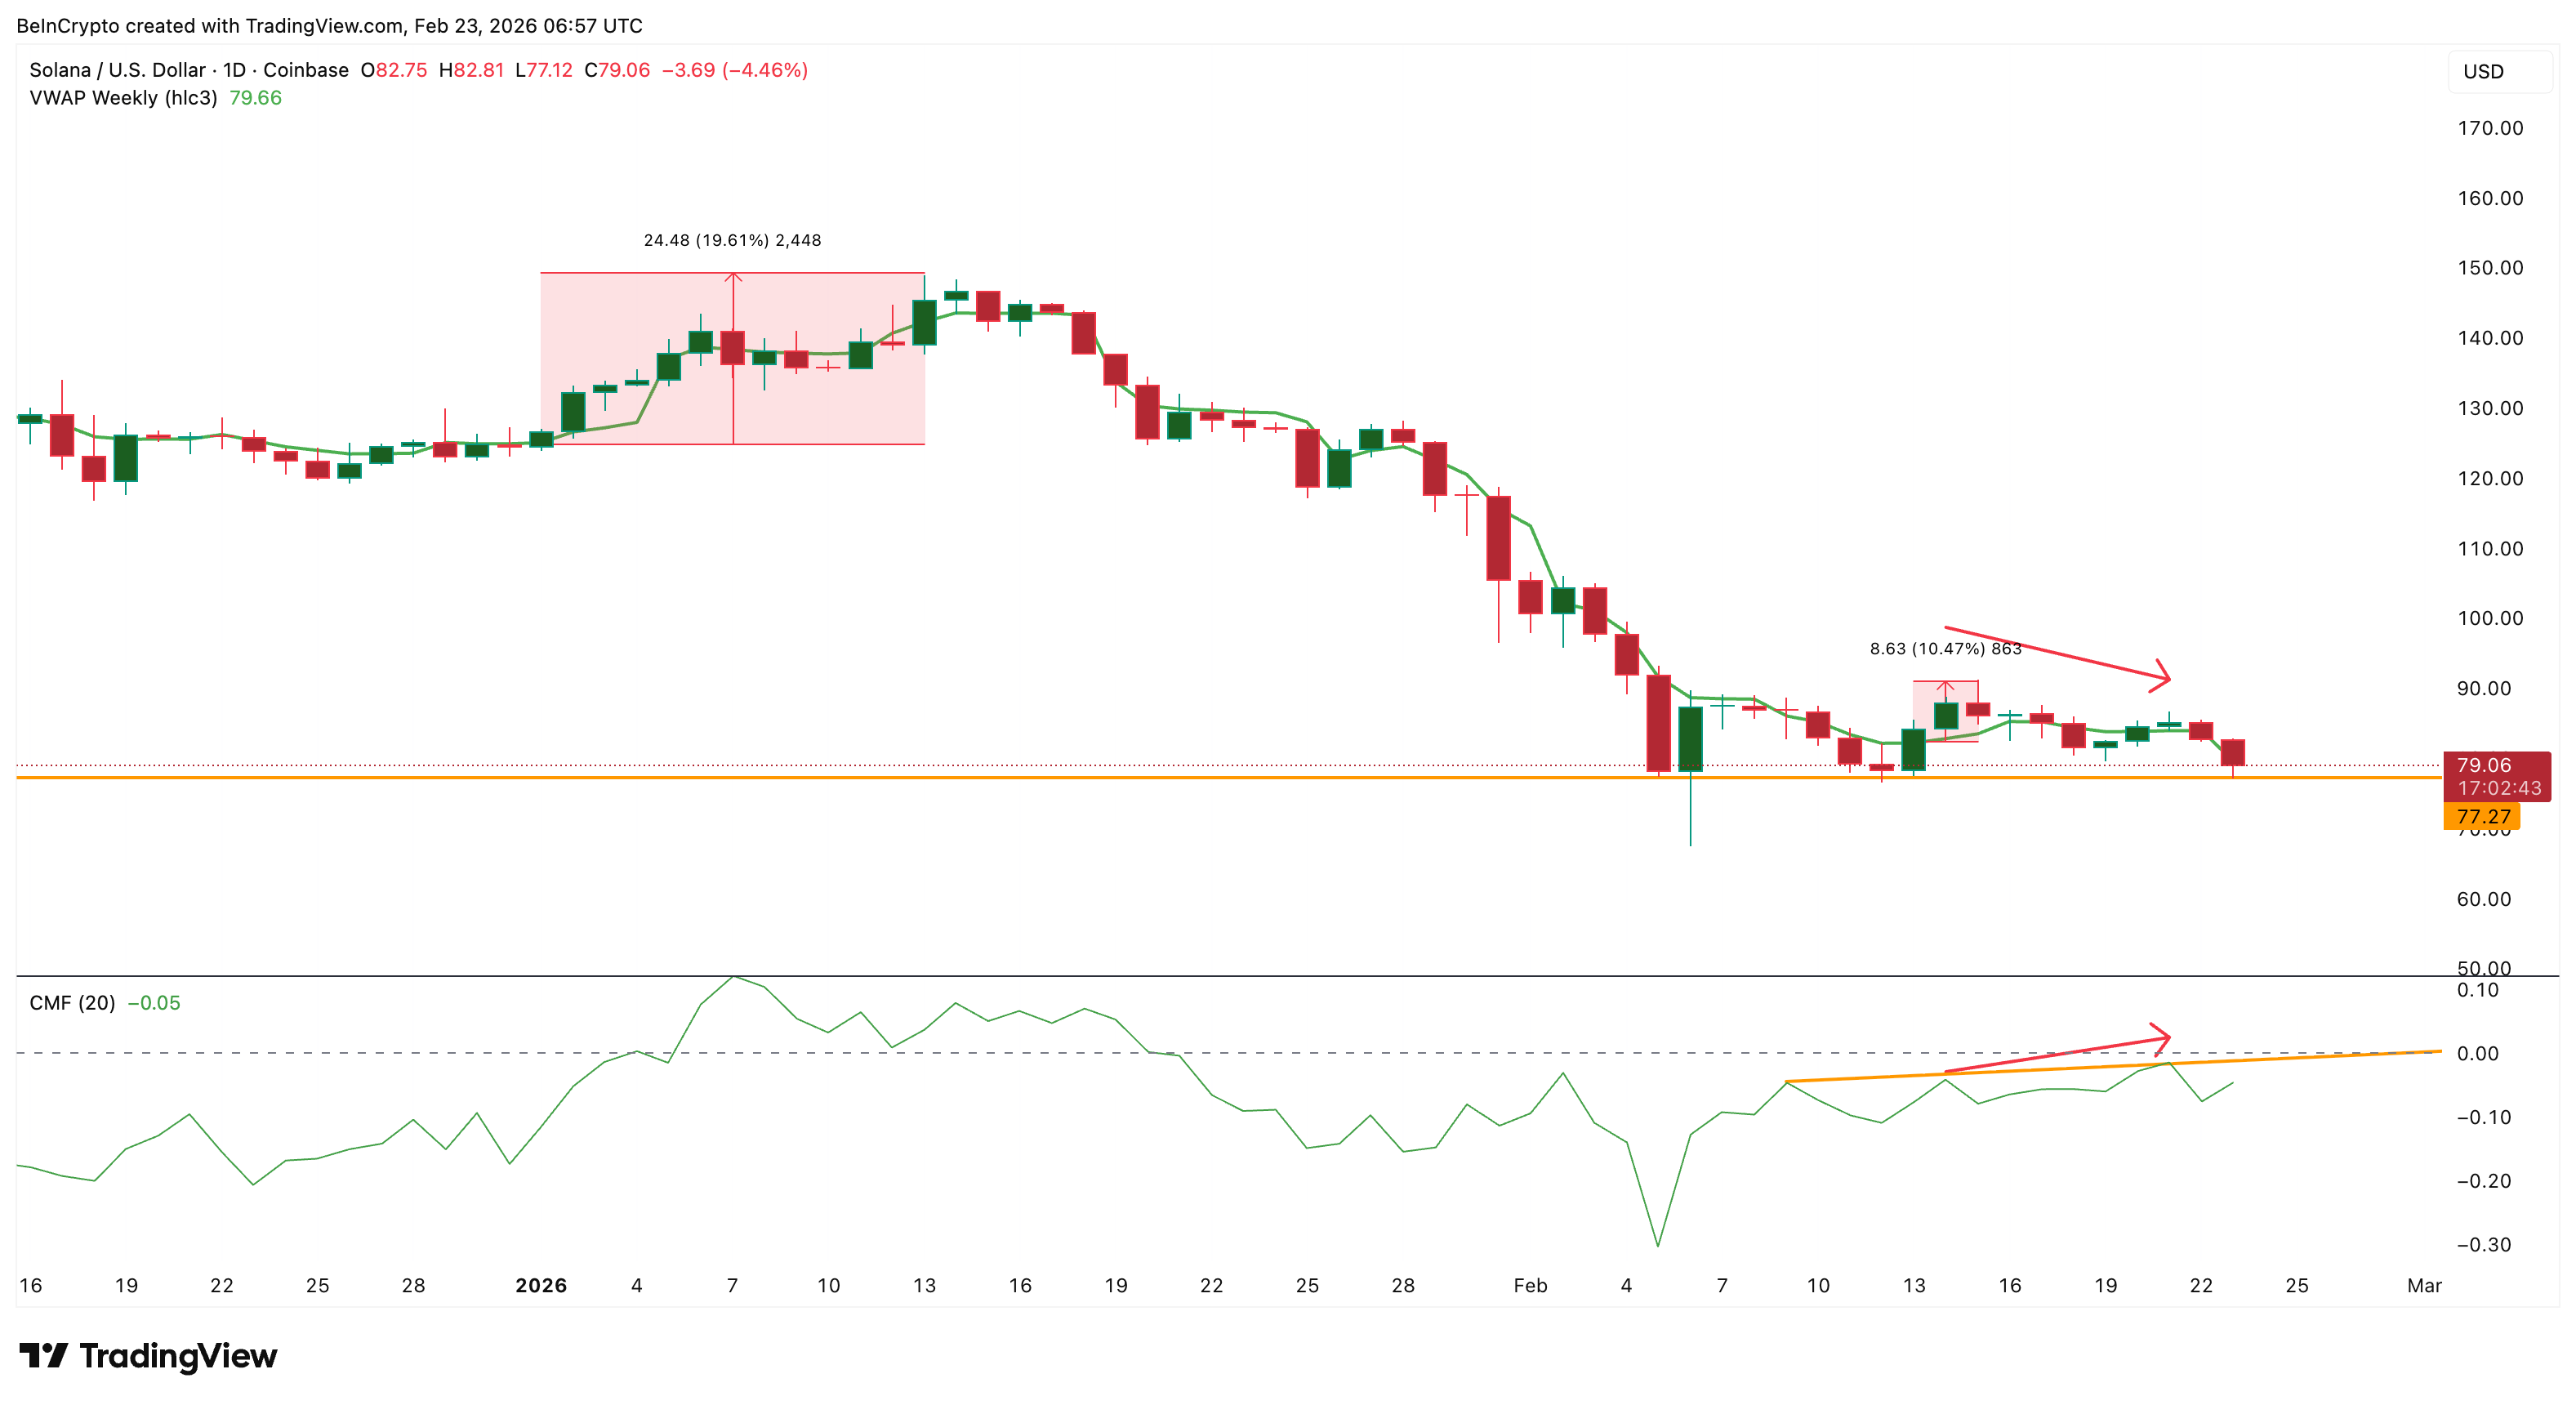
This indicates experienced investors are accumulating during weakness. Another signal comes from the Chaikin Money Flow (CMF) indicator. CMF measures whether large capital is flowing into or out of an asset using price and volume.
Even as the Solana price remained weak, CMF started rising. This shows money is quietly starting to flow into Solana. However, for large capital to positively impact the SOL price, it must first break above the ascending trendline and then the zero line.
 Institutional Money Flow Improves: TradingView
This accumulation becomes more important when combined with the weekly VWAP, or Volume Weighted Average Price. VWAP reflects the average price weighted by volume and is widely used as a proxy for institutional positioning. Solana recently reclaimed this level briefly, with a 10% upside. The same reclaim also happened in early January, and the price rallied nearly 20%. Currently, the VWAP line is over $79, closer to the current trading price.
The VWAP reclaim previously led the CMF, moving above the zero line. And the current pattern suggests that institutional-style accumulation may be beginning again. This belief could also explain the whale’s early long positioning. But the optimism doesn’t come without risks.
Short-Term Holders And Key Price Levels Now Decide Solana’s Next Major Move
Short-term holders now represent the biggest risk to recovery. This can be seen in HODL Waves, which measure how long investors hold their coins by grouping supply into time bands.
The 1-week to 1-month holder group increased its supply share from 5.10% to 7.18%, a 40% rise. These short-term holders are more likely to sell quickly during volatility. This creates resistance during recovery attempts.
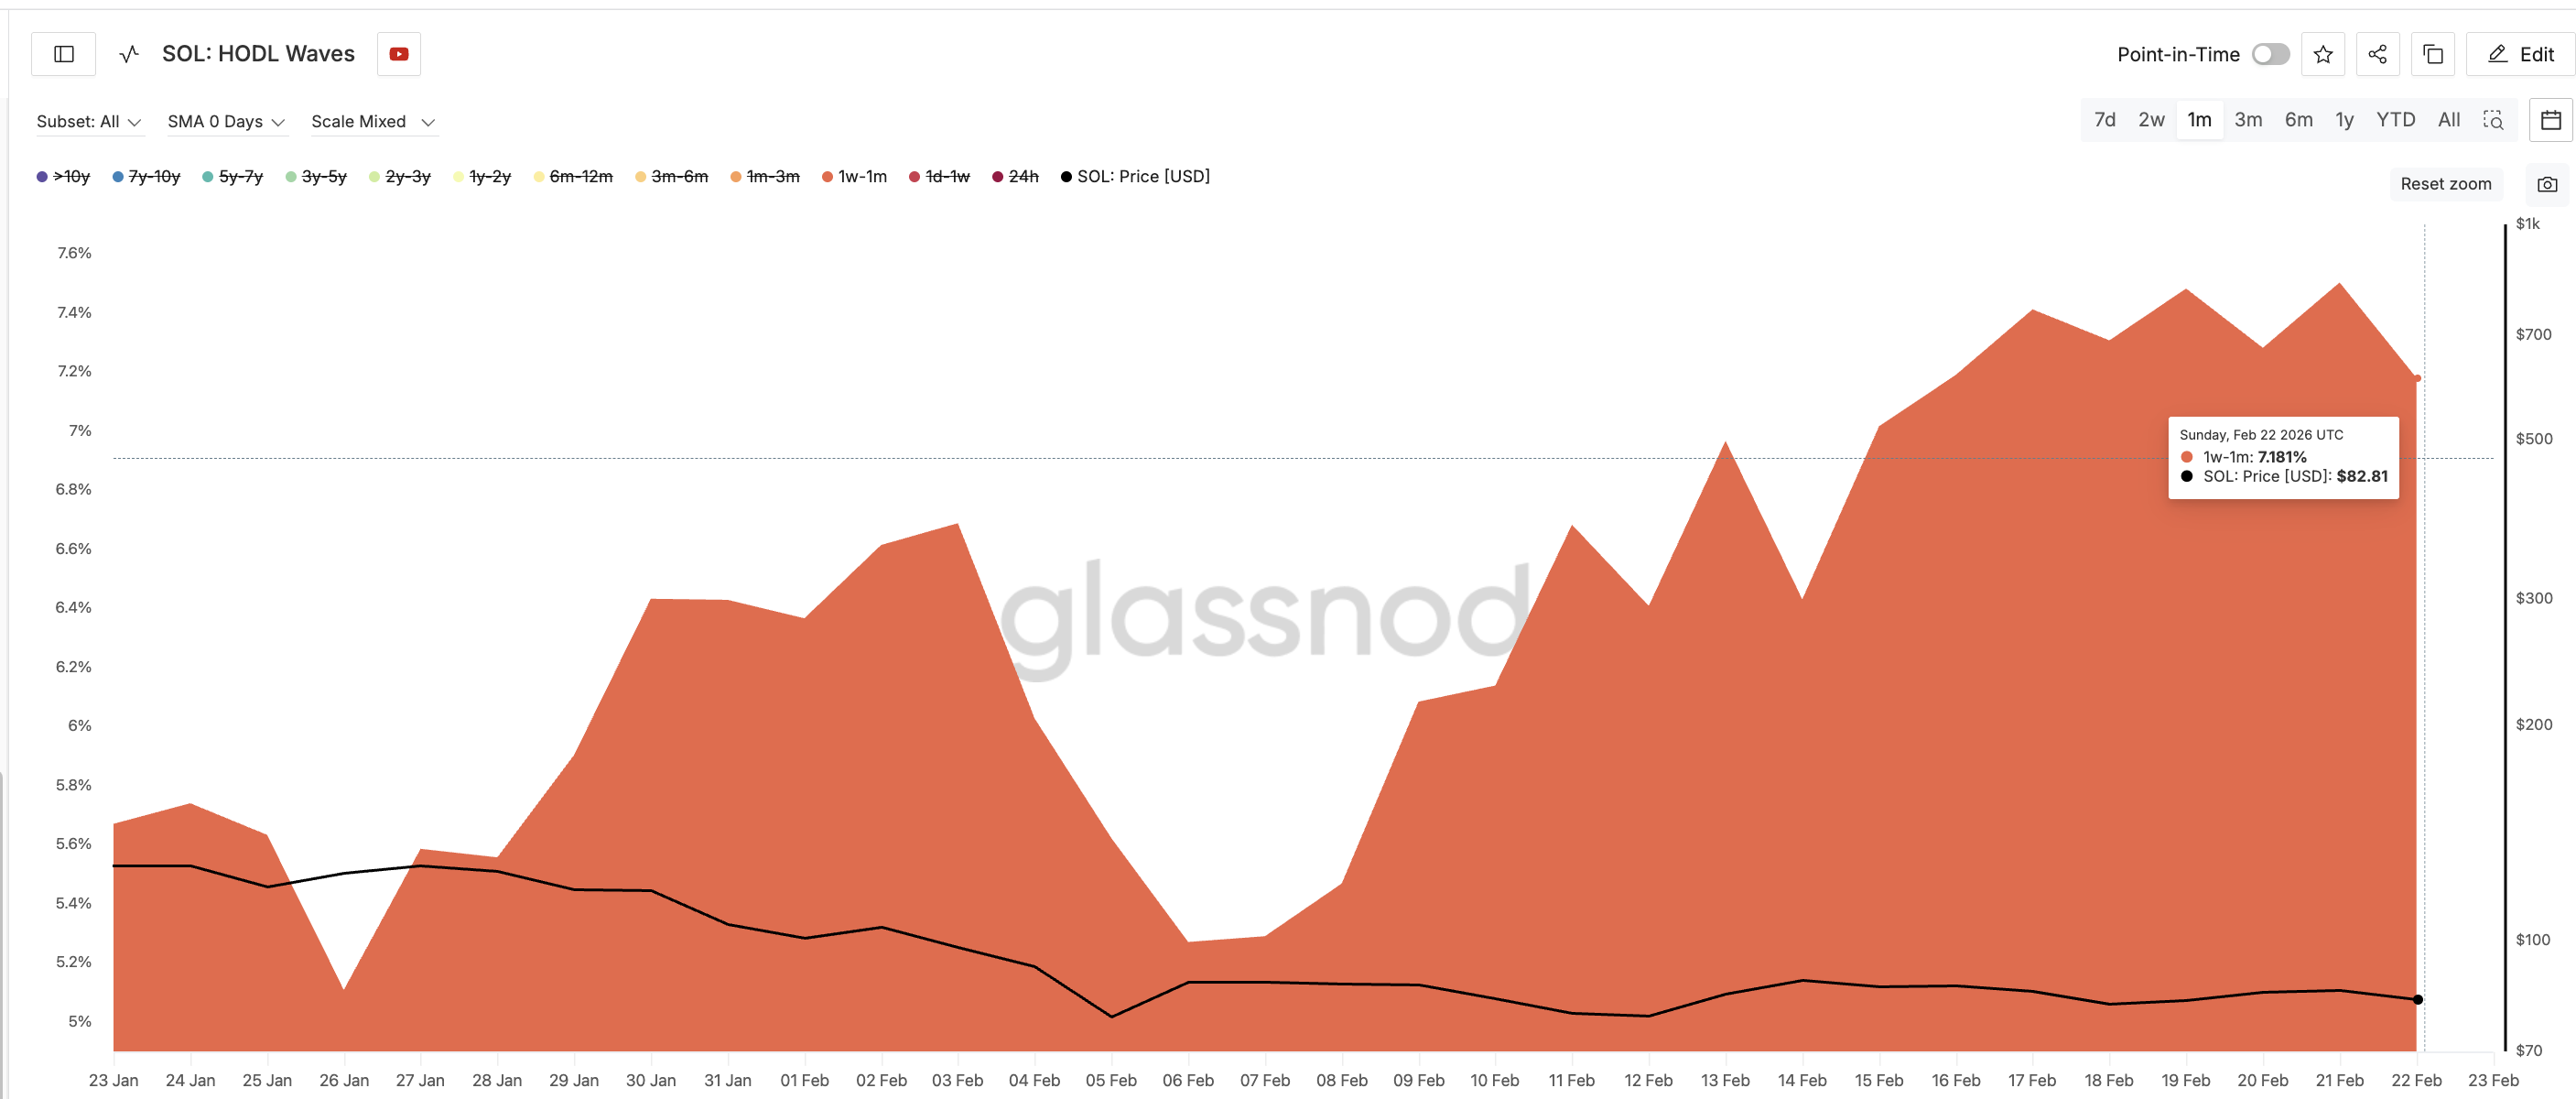 Speculative Holders: Glassnode
Solana price now sits at a critical decision point. If Solana holds above $77 and RSI stays above 30 (from earlier), the bullish divergence remains valid. This could allow recovery toward $91, which represents a potential 15% upside.
However, if $77 breaks and RSI falls below 30, the bullish setup fails. In that case, Solana could drop toward $68 first and potentially $54, which would represent more than 30% downside from current levels.
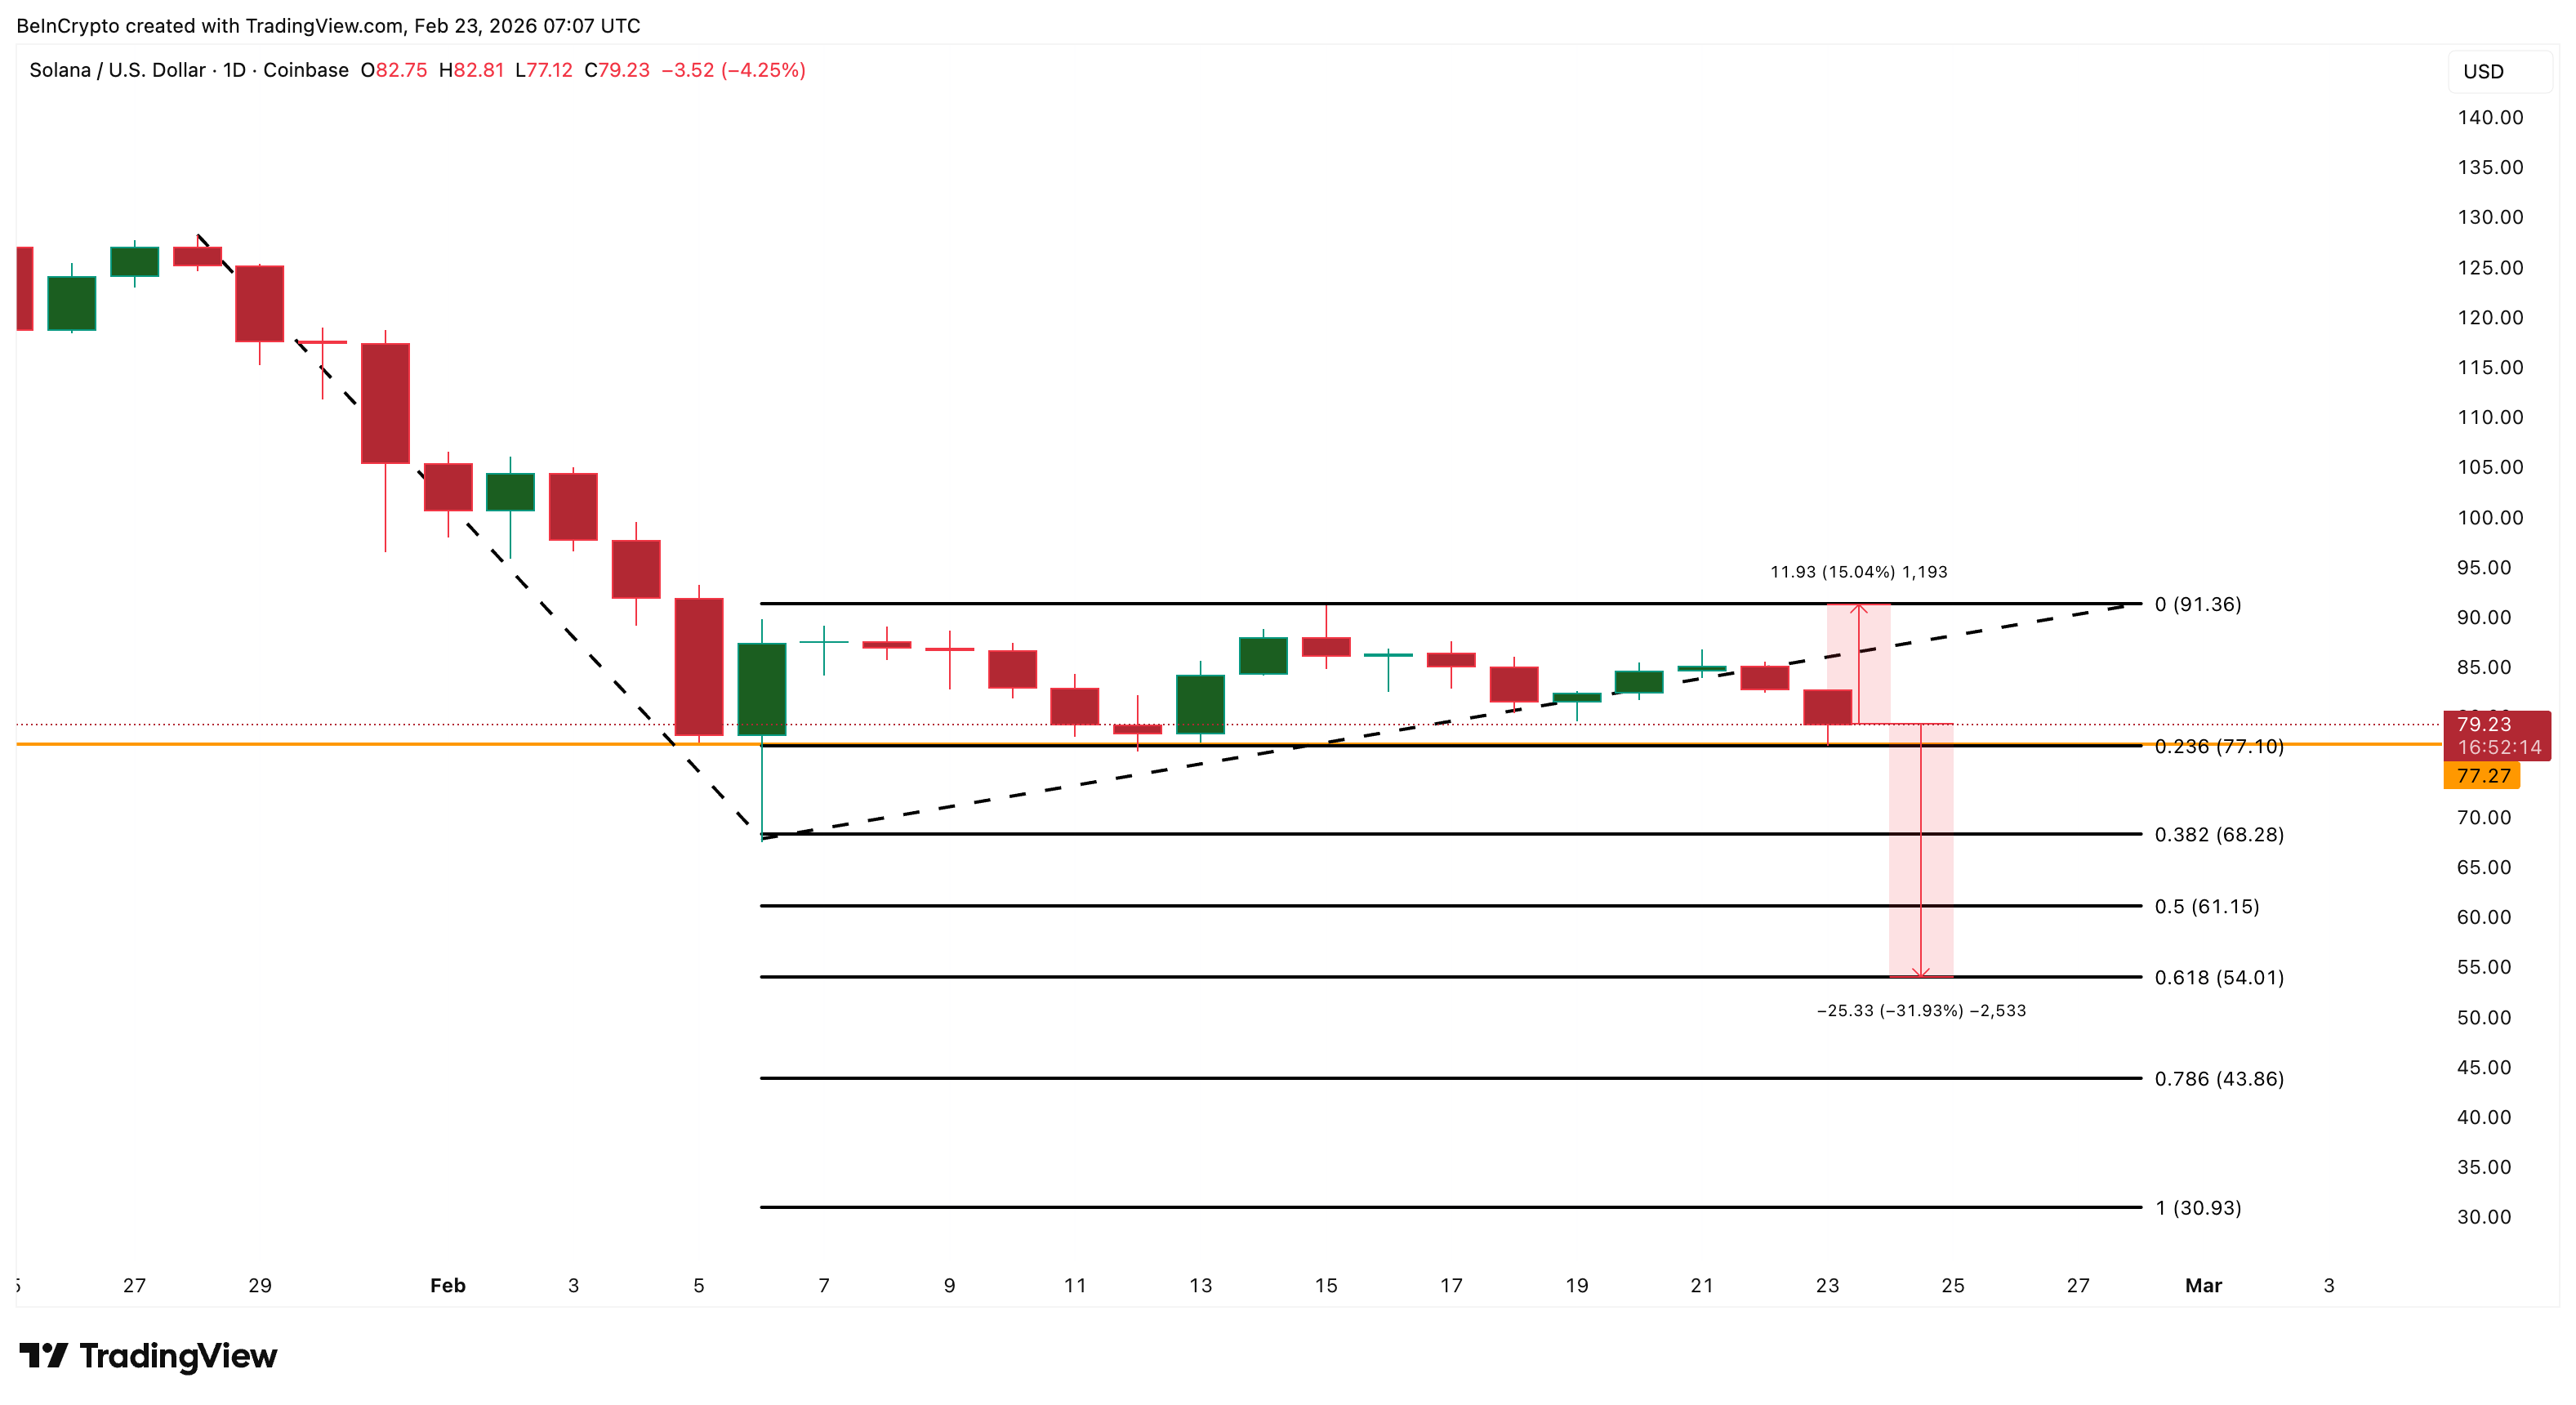 Solana Price Analysis: TradingView
This is why the current level is so important. The broader market is still betting against the Solana price, as shown by rising short positions and deeply negative funding rates. But whales and long-term holders are positioning early for a different outcome. The next few candles and the RSI 30 hold — will determine who is right.
0
0


 Manage all your crypto, NFT and DeFi from one place
Securely connect the portfolio you’re using to start.


