PEPE Price Prediction: Is Pepe Headed for a Deeper Crash as It Slides Faster Than Every Meme Coin in 2025?

0
0
Pepe’s price outlook has taken a sharp hit, with the token falling faster than any other major meme coin this year.
As per Coingecko data, PEPE is now down -75% in 2025 and has lost another -19% over the past week.
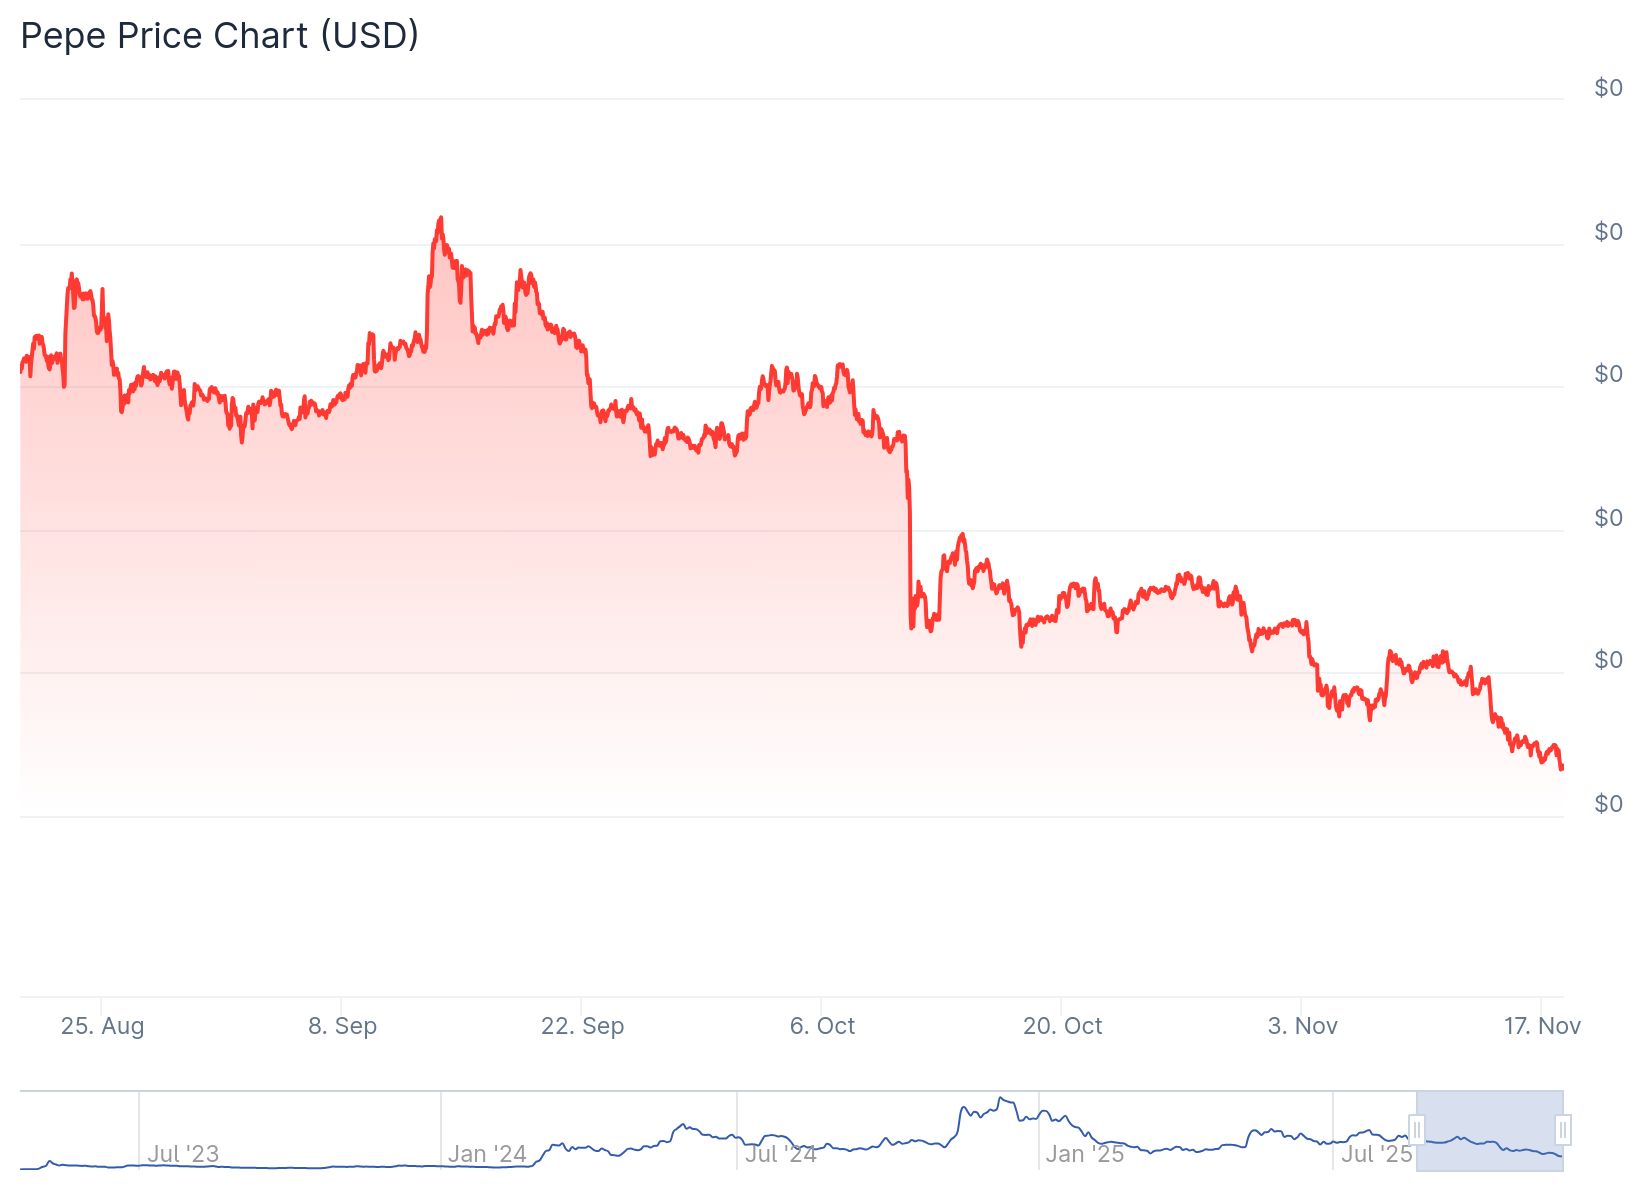
The token has struggled to hold any strength while rivals like Dogecoin and Shiba Inu remain comparatively steady.
Sentiment has weakened even more after the Federal Reserve signaled uncertainty about a possible rate cut in December.
DISCOVER: Top 20 Crypto to Buy in 2025
What Do On-Chain and Perp Data Reveal About PEPE’s Weak Liquidity?
That shift has weighed on risk assets across the board, and PEPE seems to be taking the hardest blow.
New data from the CME Group’s FedWatch tool shows how quickly expectations have changed heading into the next FOMC meeting.
The odds of a December rate cut have dropped from -91% to about -45%, reflecting a clear reset in market thinking
The sharp shift in the market’s expectations has added to the sell-off. Meme coins, including Pepe, have slipped hard as broader pressure builds.
On-chain from DefiLlama data show that PEPE is still active, but most of the trading is now happening through perpetual futures rather than DeFi.
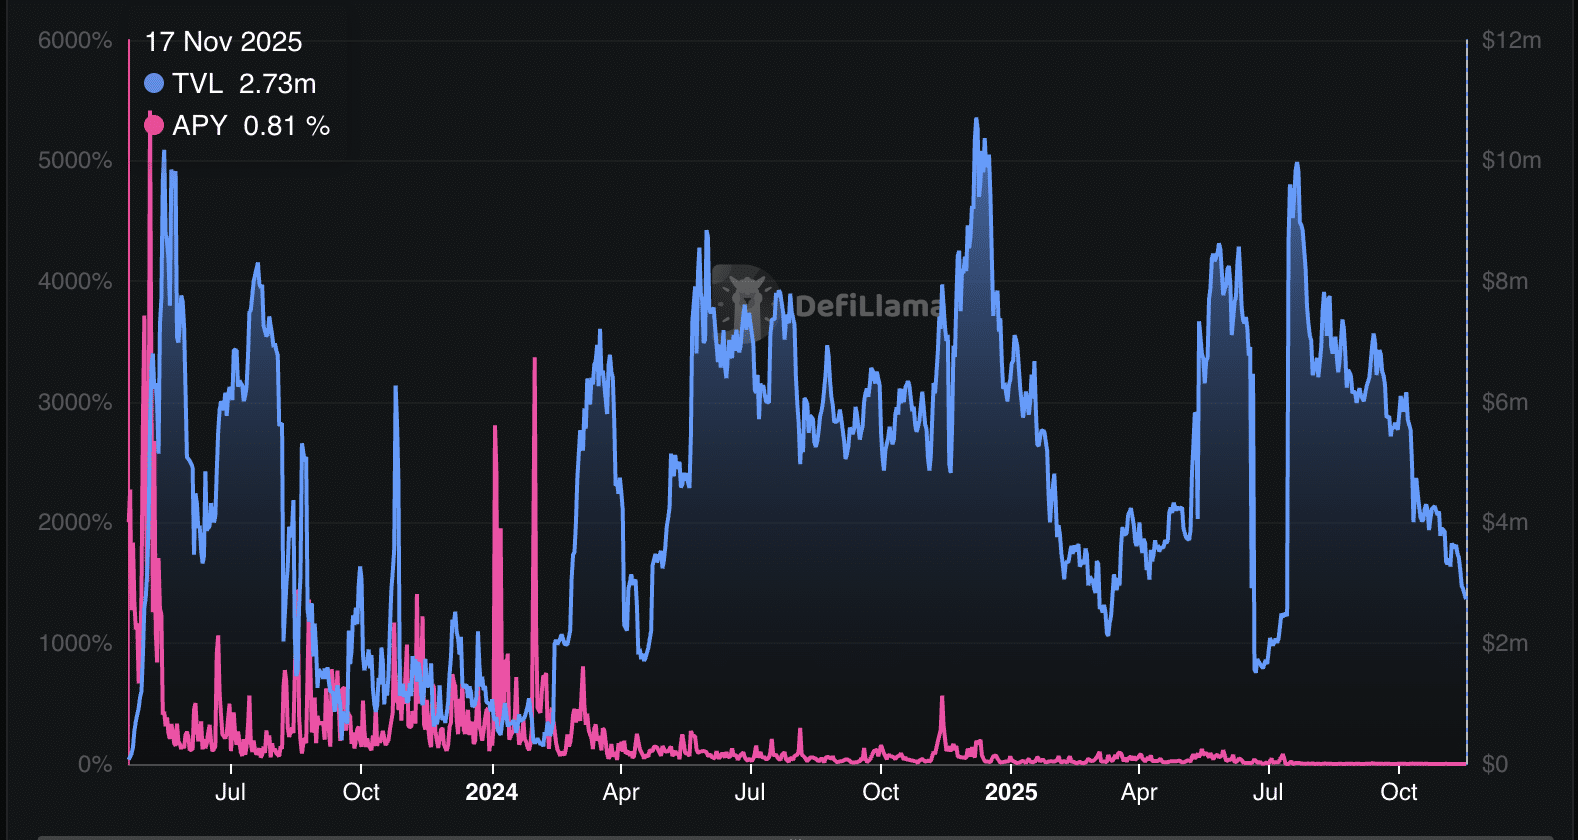
Figures from DefiLlama show the main PEPE–WETH pool on Uniswap v3 holds about $4.2M in TVL.
It signals a small and concentrated area of on-chain liquidity instead of a strong DeFi base.
CoinGlass data adds to the same picture. PEPE futures posted around $950M in 24-hour volume, while open interest stands near $170–$176M.
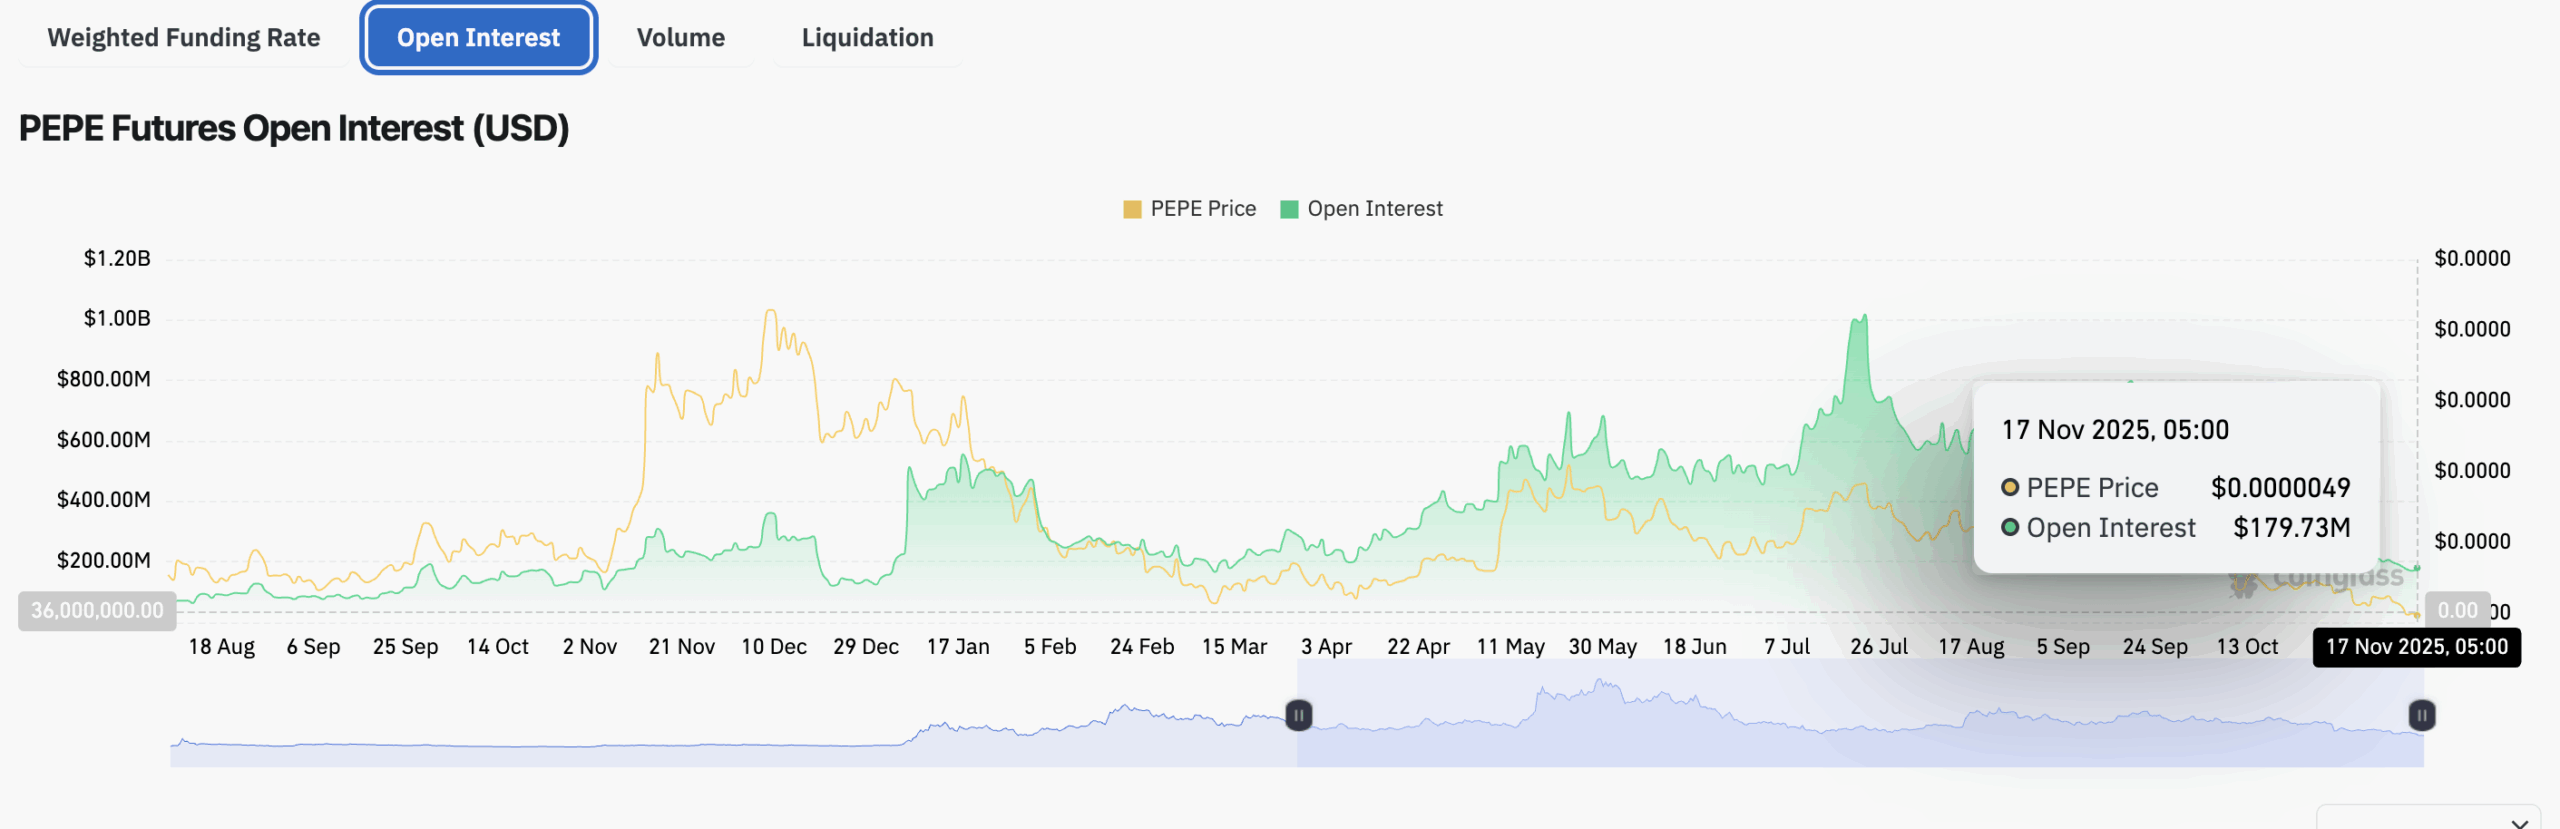
It suggests that most traders are choosing centralized perp markets over on-chain perp DEXs, keeping the bulk of activity off-chain.
DISCOVER: Best New Cryptocurrencies to Invest in 2025
PEPE Price Prediction: Is PEPE’s Downtrend Strengthening as Lower Highs Keep Stacking Up?
Pepe’s chart signals steady pressure, with the broader structure showing a downtrend that has only grown tighter in recent weeks.
On the 4-hour TradingView chart, the token stays well below its key moving averages. It hasn’t been able to build any real momentum since early autumn.
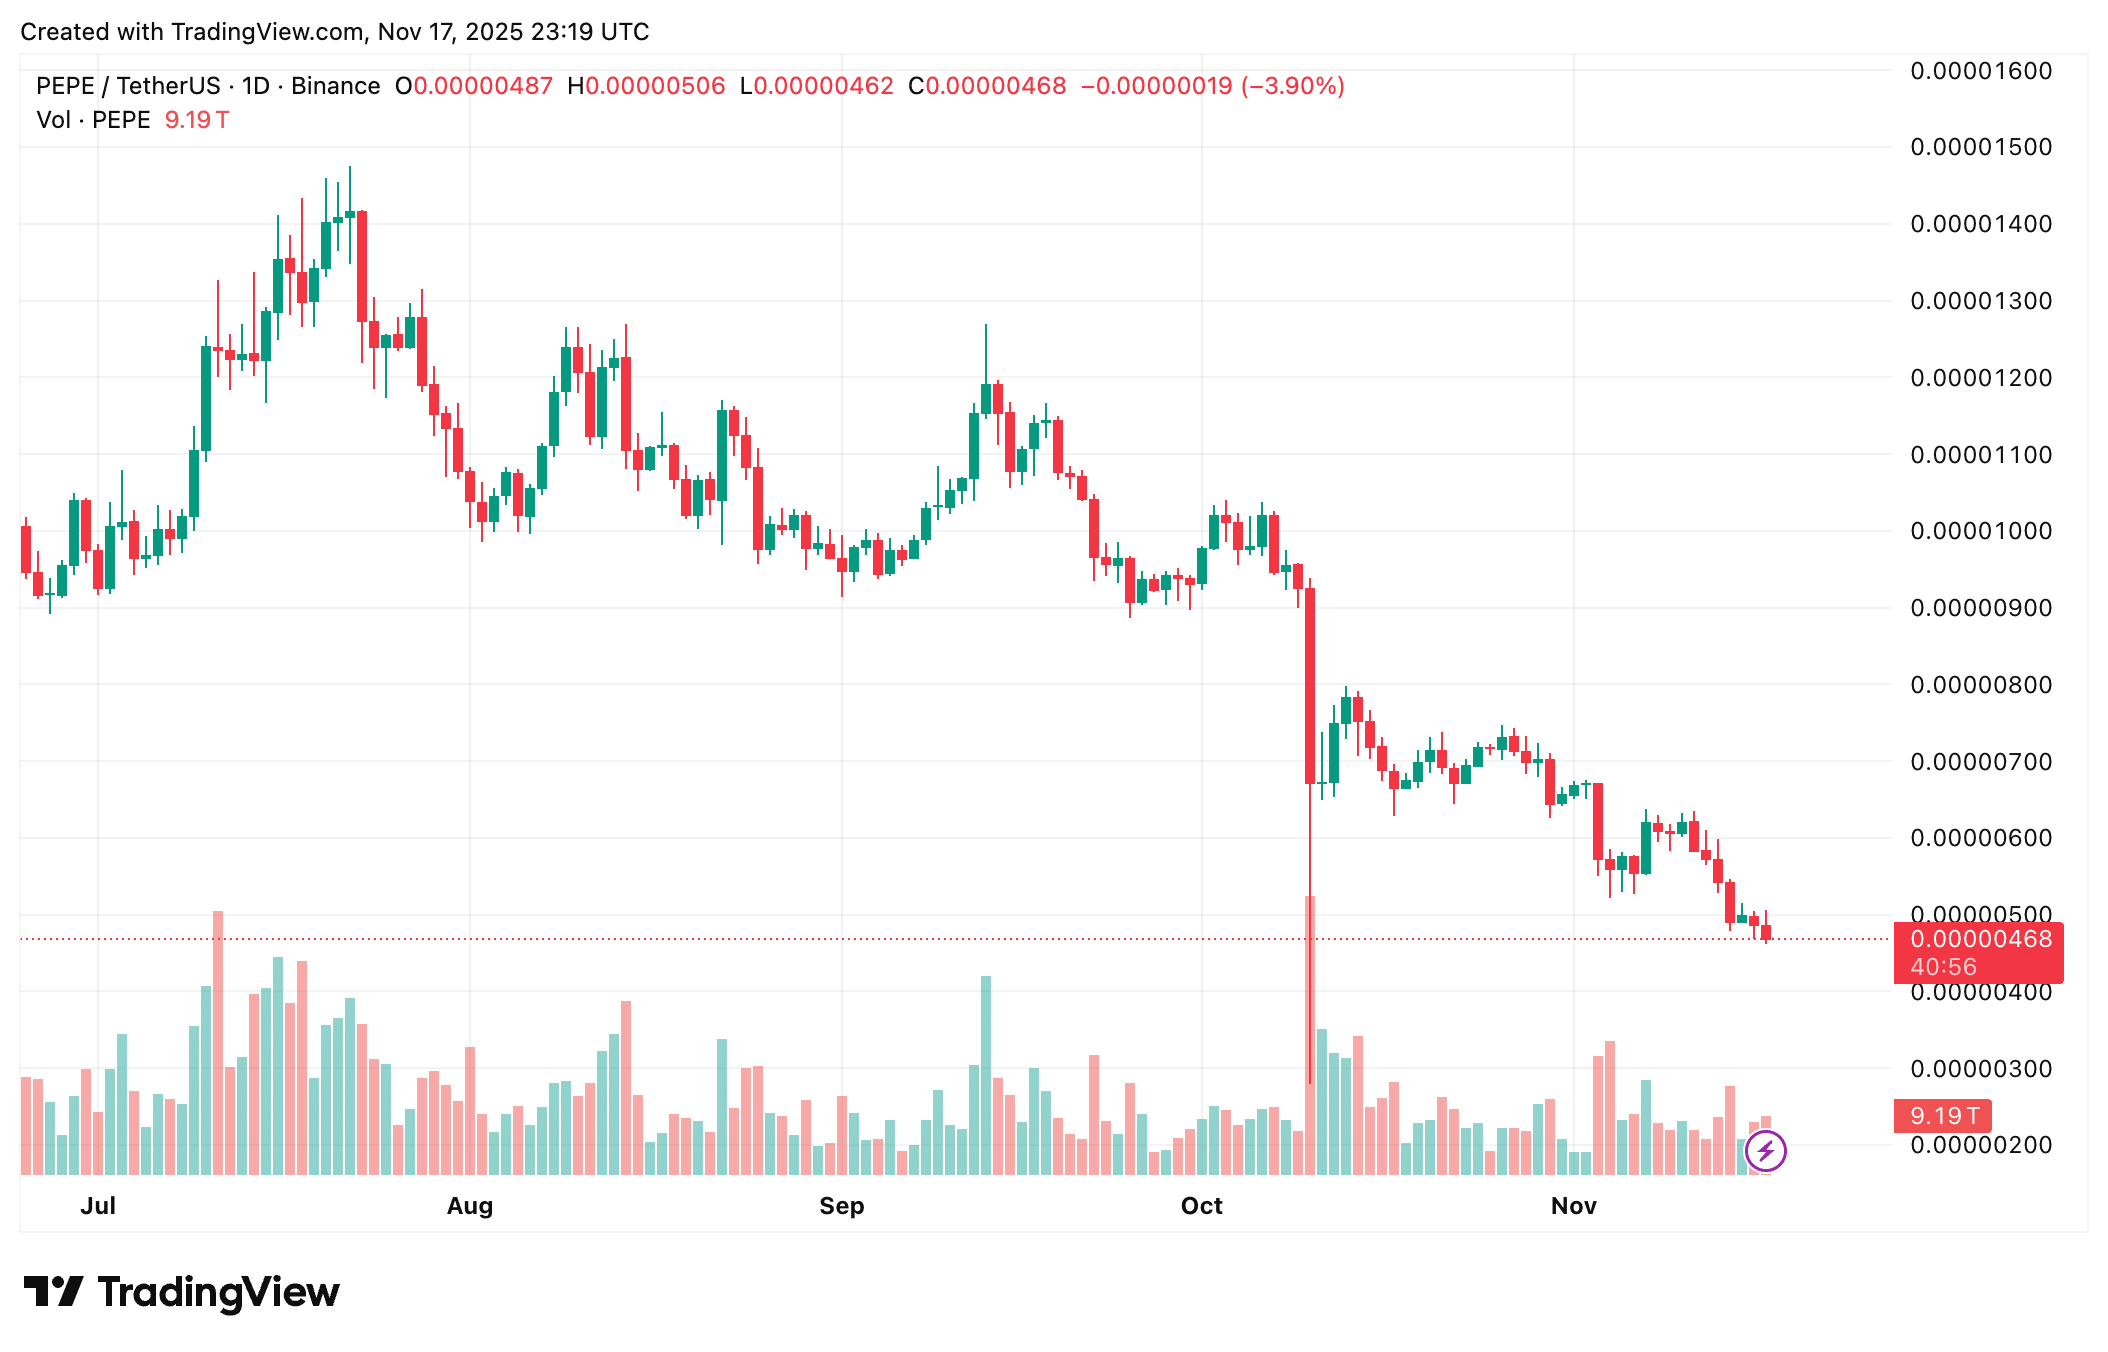
The pattern on the screen is clear. The chart shows a steady line of lower highs and lower lows from mid-September through November.
Each rebound has been smaller than the one before it. Sellers keep stepping in as soon as the price moves toward overhead levels.
The 50- and 100-period EMAs are also pointing lower and continue to block every attempt at an upside push. That signals a trend that remains firmly bearish.
Earlier in the year, PEPE moved in sharp bursts. The chart saw fast swings in May and July as sudden spikes in volume pushed the token into short rallies. That phase is over for now.
Trading activity has slowed through October and November, showing fewer participants and almost no signs of strong dip-buying.
The pullback has also been steady, not panicked, which points to ongoing distribution rather than a single washout.
The price is now sitting near the lower edge of its multi-month range. It is testing levels last seen before the spring rallies. Recent candles are narrow and show brief attempts to steady, but sellers still control the trend and keep dragging the price toward weekly lows.
There is no clear reversal setup on the chart. There’s no double bottom, no bullish divergence, and no pattern that signals a shift in momentum.
The structure still leans toward continuation unless volume picks up or buyers form a solid base.
Another key point is the lack of strong reaction zones. Earlier support between $0.00000075 and $0.00000085 has already failed and flipped into resistance.
The current range doesn’t show much historical demand. That leaves the chart exposed to deeper downside if momentum stays weak and no meaningful buying interest returns.
EXPLORE: What Is Ransomware & How to Protect Yourself in 2025
Join The 99Bitcoins News Discord Here For The Latest Market Updates
The post PEPE Price Prediction: Is Pepe Headed for a Deeper Crash as It Slides Faster Than Every Meme Coin in 2025? appeared first on 99Bitcoins.
0
0


 すべての暗号通貨、NFT、DeFiを1か所から管理
開始に使用しているポートフォリオを安全に接続します。


0
0


0
0