
Cheems Price Prediction 2026–2030: Can Cheems Hit $0.000001 Soon?

0
0

What to Know
- Cheems trades at $0.0000006875, remaining above its Bollinger midpoint as buyers attempt to sustain the recovery visible on the daily chart.
- RSI stands at 79.20, signaling strong buying momentum, although the overbought reading increases the possibility of a pullback toward nearby support.
- Breaking above $0.0000008137 could open a route toward $0.000001, while longer forecasts depend on sustained demand, trading liquidity, and market conditions.
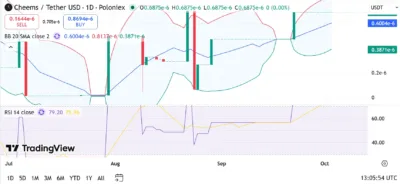
Cheems trades at $0.0000006875, with its daily chart showing a recovery above the Bollinger Band midpoint at $0.0000006004. The token remains below the upper band at $0.0000008137, placing that level between its displayed price and the psychological $0.000001 target.
According to the TradingView daily chart for Cheems/Tether USD on Poloniex, the displayed session records identical opening, high, low, and closing prices of $0.0000006875, with a 0.00% change. The latest session therefore shows no recorded price movement, despite the upward move visible in preceding candles.
The Bollinger Bands place the lower boundary at $0.0000003871, while the relative strength index stands at 79.20. These readings indicate elevated momentum alongside a substantial distance between the displayed price and lower technical support.
Also Read: EGRAG Maps XRP’s $7 Trillion Scenario With $110 Billion as First Breakout Gate
Buyers Face Resistance Below the Upper Bollinger Band
Cheems sits approximately 14.5% above the Bollinger midpoint at $0.0000006004, giving buyers a nearby level to defend during a pullback. Holding above this line would preserve the price’s position in the upper half of the Bollinger range.
The upper band at $0.0000008137 represents the next technical reference, approximately 18.4% above the displayed price. A sustained move through that boundary would strengthen the case for an extension toward $0.00000090 and $0.000001, which serve as psychological price references.
However, failure to maintain the midpoint would weaken the immediate recovery and bring the lower band at $0.0000003871 into consideration. Reaching that boundary would represent a decline of approximately 43.7% from $0.0000006875.
The chart also contains several abrupt candles and extended stretches of flat pricing. This uneven pattern makes confirmation across multiple sessions particularly relevant when assessing whether a breakout can hold.
Technical Outlook
Cheems’ RSI reading of 79.20 exceeds the conventional overbought threshold of 70, reflecting strong recent upward momentum. Its accompanying RSI average stands at 75.96, also above that threshold.
An overbought reading does not automatically signal an immediate decline, since prices can remain elevated during sustained rallies. Nevertheless, the reading increases the importance of checking whether buyers can maintain support as momentum moderates.
The Bollinger midpoint slopes upward toward the right side of the chart, supporting the visible recovery. Meanwhile, the distance between the upper and lower bands indicates a wide trading range and considerable price volatility. The displayed chart does not include a volume panel, so price movement alone cannot establish the strength of trading participation behind the recovery.
Source: Tradingview
Can Cheems Reach $0.000001?
Cheems would need to gain approximately 45.5% from $0.0000006875 to reach $0.000001. Such a move would first require buyers to overcome the upper Bollinger Band near $0.0000008137.
Holding above that boundary across successive daily closes would provide stronger technical confirmation than a brief intraday move. Buyers would then face the psychological $0.00000090 level before challenging $0.000001.
The elevated RSI leaves room for consolidation before another upward attempt. Cheems could maintain its broader recovery while moving sideways or retreating toward the midpoint, provided buyers defend that area. A breakdown below $0.0000006004 would weaken the immediate path toward the target and increase the possibility of a deeper correction.
Cheems Price Prediction (2026–2030)
| Year | Bearish scenario | Middle scenario | Bullish scenario |
|---|---|---|---|
| 2026 | $0.00000039 | $0.00000070 | $0.00000100 |
| 2027 | $0.00000030 | $0.00000085 | $0.00000130 |
| 2028 | $0.00000025 | $0.00000100 | $0.00000170 |
| 2029 | $0.00000020 | $0.00000120 | $0.00000220 |
| 2030 | $0.00000015 | $0.00000150 | $0.00000300 |
Price Forecast by Year
2026
Cheems could challenge $0.000001 if buyers defend the Bollinger midpoint and establish a sustained breakout above $0.0000008137. A weaker outcome would place the token nearer the lower band around $0.00000039.
2027
The middle scenario places Cheems at $0.00000085, while stronger demand could support the illustrative $0.00000130 bullish outcome. Renewed selling pressure and weaker market participation could instead push the price toward $0.00000030.
2028
Cheems could trade around $0.000001 under the middle scenario, with $0.00000170 representing a stronger expansion. Achieving the upper outcome would require sustained demand beyond the momentum visible in the current daily chart.
2029
The bullish scenario reaches $0.00000220, while the middle case assumes $0.00000120. Broader cryptocurrency market weakness or declining interest could leave Cheems closer to the bearish illustration of $0.00000020.
2030
The upper scenario places Cheems at $0.00000300, compared with a middle illustration of $0.00000150. These outcomes depend on future trading conditions, liquidity, and continued market participation, which the current chart cannot determine.
Conclusion
Cheems remains above its Bollinger midpoint at $0.0000006004, with the upper band at $0.0000008137 forming the next technical hurdle. Clearing that boundary could support a move toward $0.000001, approximately 45.5% above the displayed price.
RSI at 79.20 signals strong momentum but also an overbought position. Maintaining midpoint support would preserve the recovery, whereas a breakdown would increase the risk of movement toward the lower Bollinger Band.
FAQs
1. Is Cheems currently bullish?
Cheems trades above its rising Bollinger midpoint, supporting a positive short-term structure, although RSI at 79.20 indicates overbought conditions.
2. What is Cheems’ nearest technical support?
The Bollinger midpoint at $0.0000006004 is the nearest displayed support reference, followed by the lower band at $0.0000003871.
3. What is Cheems’ main resistance level?
The upper Bollinger Band at $0.0000008137 is the next technical hurdle, followed by psychological references at $0.00000090 and $0.000001.
4. Can Cheems reach $0.000001?
Reaching $0.000001 requires approximately 45.5% growth and a sustained move above the upper Bollinger Band, supported by continued buying demand.
Also Read: Aethir (ATH) Price Prediction 2026–2030: Can ATH Hit $0.01 Soon?
The post Cheems Price Prediction 2026–2030: Can Cheems Hit $0.000001 Soon? appeared first on 36Crypto.
0
0

 Manage all your crypto, NFT and DeFi from one place
Securely connect the portfolio you’re using to start.