PEPE Coin’s Symmetrical Triangle: A Prelude to a 65% Surge?
0
0

PEPE coin has recently garnered attention due to its intriguing price movements. Currently, PEPE is navigating within a symmetrical triangle pattern—a technical formation often indicative of an impending breakout. This pattern, characterized by converging trendlines connecting sequential lower highs and higher lows, suggests a period of consolidation that typically precedes significant price action.
Deciphering the Symmetrical Triangle
A symmetrical triangle reflects a state of equilibrium between bullish and bearish forces, with neither side asserting dominance. As the pattern matures, the narrowing price range implies a buildup of potential energy poised for release upon breakout. The direction of this breakout—upward or downward—often sets the tone for subsequent price movements.
PEPE’s Current Position and Potential Trajectory
As of April 7, 2025, PEPE is trading near the lower boundary of its symmetrical triangle, approaching a critical support level of around $0.00000681. Technical analysis suggests that a rebound from this support could trigger a bullish breakout, potentially propelling the price toward the upper resistance near $0.00001144—a projected increase of approximately 65%.

Technical Indicators: Bollinger Bands and Chaikin Money Flow
Two pivotal indicators lend credence to this analysis:
-
Bollinger Bands: PEPE’s price is currently engaging with the middle band, historically acting as a resistance level. A successful breach above this band could signal the onset of upward momentum.
-
Chaikin Money Flow (CMF): With a current reading at 0.4, the CMF indicates a distribution phase. However, remaining in positive territory suggests that buying pressure persists, potentially curbing further declines and supporting a bullish reversal.
Market Sentiment and Spot Trading Activity
Spot market dynamics further illuminate PEPE’s potential trajectory. Recent data reveals that traders have offloaded approximately $2.78 million worth of PEPE, contributing to downward pressure. Nevertheless, the tempered market reaction implies underlying accumulation, hinting at strategic positioning by investors anticipating a price resurgence.
 and Analyst Insights
Looking ahead, various analysts have posited projections for PEPE’s price:
-
CoinCodex Forecast: Anticipates PEPE trading between $0.00002440 and $0.00008591 in 2025, with an average price of around $0.00004897.
-
Binance Prediction: Projects a range from $0.00000708 to $0.00002405 for 2025, contingent on market trends and memecoin popularity.
These projections underscore the potential for significant appreciation, albeit within a framework of inherent volatility.
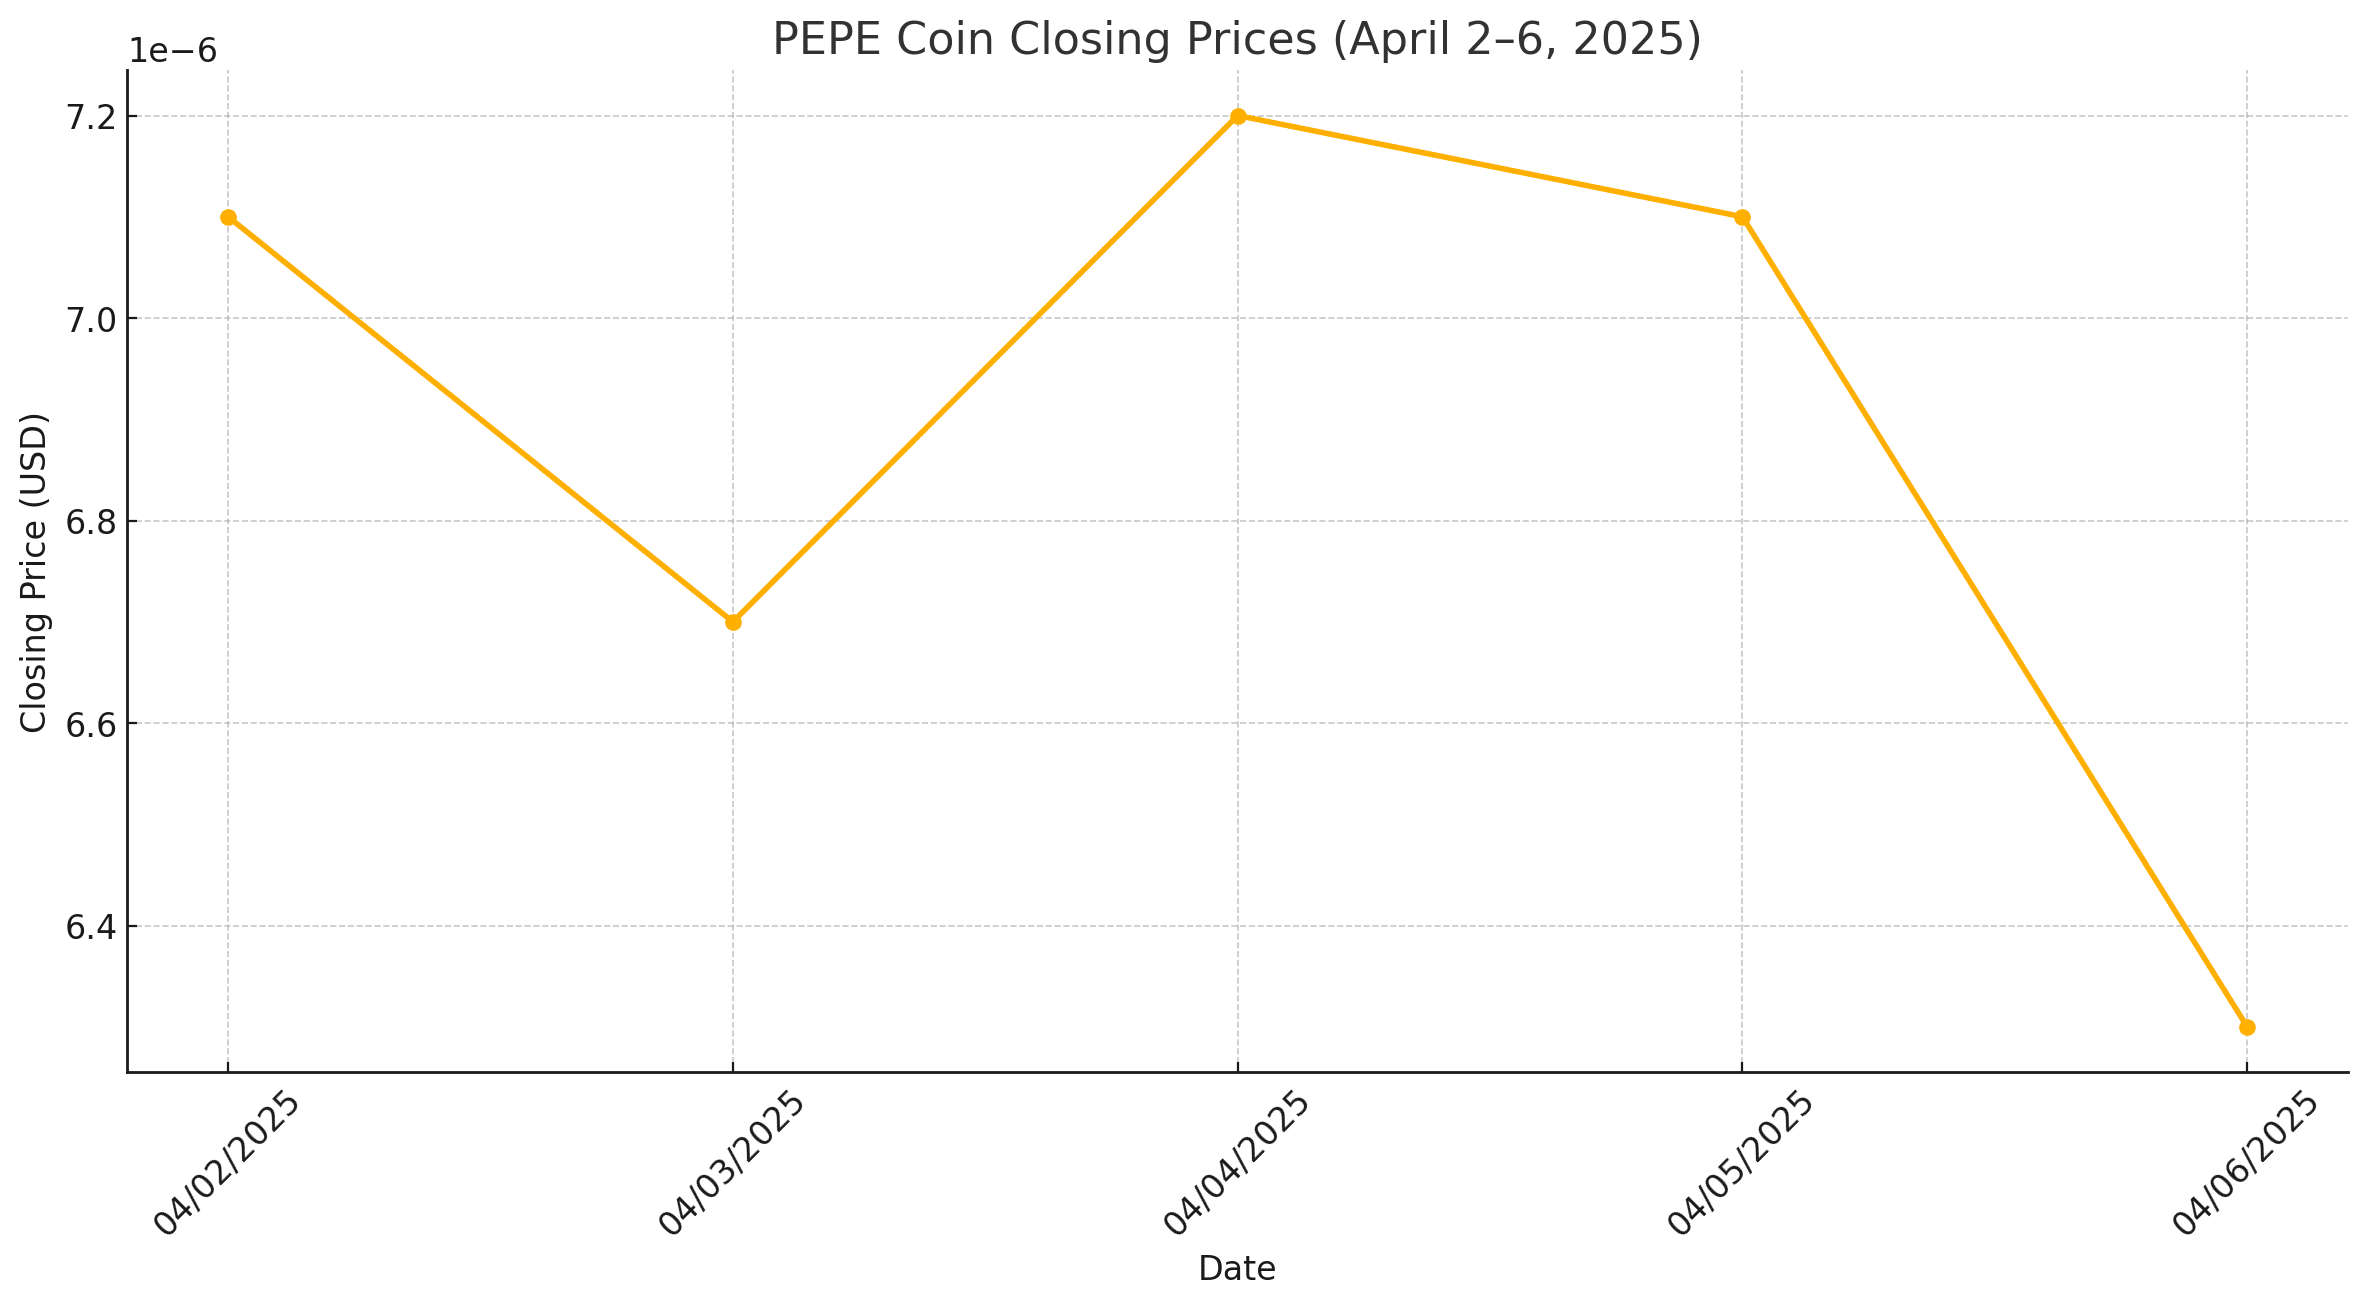
PEPE Coin Price Table
| Date | Open Price | High Price | Low Price | Close Price | Trading Volume | Market Cap |
|---|---|---|---|---|---|---|
| 04/06/2025 | $0.0000071 | $0.0000071 | $0.0000062 | $0.0000063 | $6.6 million | $2.9 billion |
| 04/05/2025 | $0.0000072 | $0.0000074 | $0.0000069 | $0.0000071 | $9.4 million | $3.0 billion |
| 04/04/2025 | $0.0000067 | $0.0000073 | $0.0000066 | $0.0000072 | $10.4 million | $2.9 billion |
| 04/03/2025 | $0.0000071 | $0.0000073 | $0.0000064 | $0.0000067 | $8.9 million | $2.9 billion |
| 04/02/2025 | $0.0000077 | $0.0000080 | $0.0000070 | $0.0000071 | $8.6 million | $3.1 billion |
Data sourced from CoinLore.
Conclusion: Navigating PEPE’s Potential
PEPE’s current positioning within a symmetrical triangle pattern, bolstered by key technical indicators and market dynamics, suggests a plausible scenario for a substantial price surge. However, investors should remain cognizant of the inherent volatility and conduct comprehensive due diligence. As always, prudent investment decisions are grounded in a balanced assessment of potential rewards and associated risks.
Frequently Asked Questions (FAQs):
-
What does a symmetrical triangle indicate in technical analysis?
It signifies a period of consolidation where the asset’s price moves within converging trendlines, suggesting an impending breakout in either direction.
-
How reliable are Bollinger Bands in predicting price movements?
Bollinger Bands are widely used to assess price volatility and potential reversal points, but they should be employed alongside other indicators for more accurate predictions.
-
What does a positive Chaikin Money Flow indicate?
A positive CMF suggests that buying pressure is prevailing over selling pressure, indicating potential bullish momentum.
-
Should I invest in PEPE based on current analyses?
Investment decisions should be based on thorough research and consideration of one’s risk tolerance. While current analyses suggest potential, the cryptocurrency market remains highly volatile.
Glossary of Terms:
Symmetrical Triangle: A chart pattern formed by converging trendlines connecting a series of sequential lower highs and higher lows, indicating a period of consolidation before a breakout.
Bollinger Bands: A technical analysis tool comprising three lines—upper, middle, and lower bands—that depict price volatility and potential overbought or oversold conditions.
Chaikin Money Flow (CMF): An indicator that measures the accumulation and distribution of an asset over a specified period, reflecting buying and selling pressure.
Support Level: A price point where a downtrend can be expected to pause due to a concentration of demand.
Resistance Level: A price point where an uptrend can be expected to pause due to a concentration of supply.
Sources
Read More: PEPE Coin’s Symmetrical Triangle: A Prelude to a 65% Surge?">PEPE Coin’s Symmetrical Triangle: A Prelude to a 65% Surge?
0
0
 Manage all your crypto, NFT and DeFi from one place
Securely connect the portfolio you’re using to start.


