
Bitcoin Slips Below 200-Week Trend as 2022 Pattern Returns: Key This Week

0
0
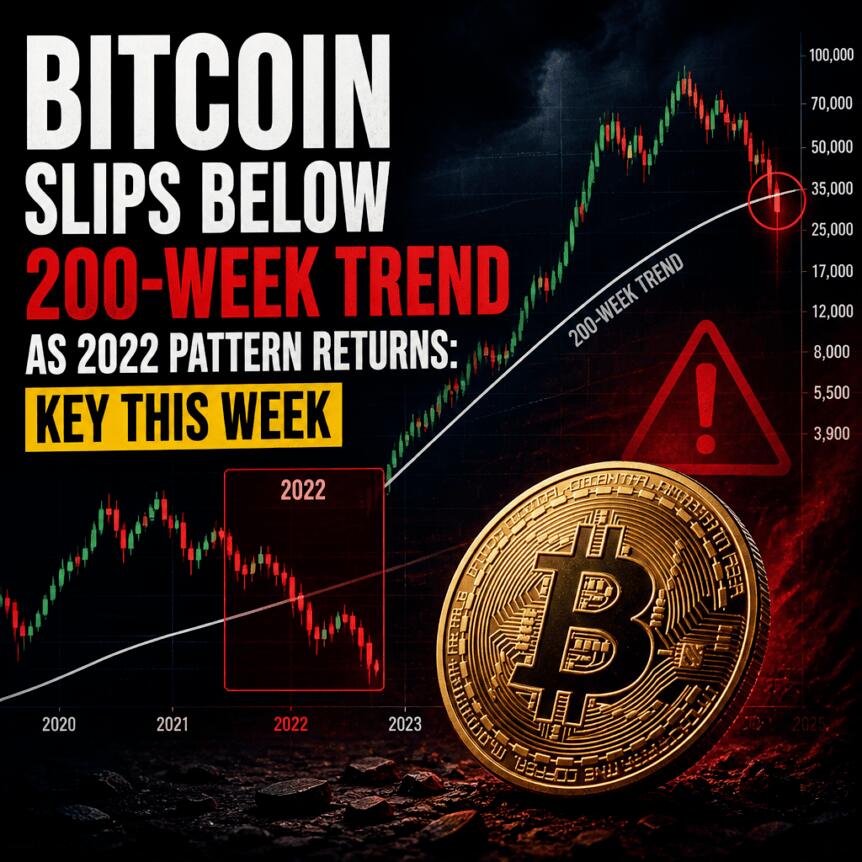
Bitcoin is starting the new week around $63,000, but the market’s technical outlook remains weighed down by history: traders are watching for confirmation of a weekly breakdown after last week’s close slipped below Bitcoin’s long-term 200-week moving average (SMA).
At the same time, macro catalysts are building. Federal Reserve minutes from the July meeting are due this week, and Japan’s second-quarter GDP release underscored risks to global liquidity even as U.S. equities hit fresh highs—an unusual backdrop that some on-chain and sentiment analysts say is leaving Bitcoin sidelined.
Key takeaways
- Bitcoin traded in a roughly $57,700 to $67,300 range, and last week’s close fell below the 200-week SMA near $64,216.
- Options pricing suggests close to a 70% chance the Federal Reserve holds rates at the September meeting, following softer inflation signals earlier.
- Japan Q2 GDP came in below expectations, adding to concerns about “global tightening” and potential knock-on effects for risk assets.
- Glassnode highlights a sentiment mismatch: consumer confidence is near decade lows while U.S. stocks reach record territory.
- CryptoQuant points to growing whale-driven exchange inflows, which are reversing some of the prior trend of BTC moving off exchanges.
Weekly close below the 200-week SMA reignites bear-market parallels
After last Sunday’s weekly close, Bitcoin saw a modest rebound, posting local highs near $63,655 on Bitstamp. However, TradingView data suggests the broader week is beginning with price action still trapped inside a narrow consolidation band, with neither bulls nor bears able to establish a decisive move.
Analyst Benjamin Cowen emphasized that BTC/USD has returned below the 200-week SMA. In earlier reporting from Cointelegraph, the 200-week line was described as a defining feature of the 2022 bear market—acting as resistance after Bitcoin capitulated below it in August before entering a long bottoming phase.
“What is interesting is how in both summer 2022/2026, Bitcoin capitulated below the 200W SMA, then bounced, then gave it up in mid-August,” Cowen wrote on X.
Traders are also watching specific levels. Rekt Capital said Bitcoin failed to reach his targeted weekly-close level of $63,220, which he argues keeps the door open for additional downside. In his view, a rejection from that zone would confirm a breakdown and potentially push price lower within the existing approximate $58,000 to $66,000 range.
“A rejection from $63,220 would fully confirm the breakdown and send price lower within the current ~$58,000-$66,000 Range,” Rekt Capital wrote on X.
Fed minutes and odds of a hold: markets shift from hawkishness to pause
This week’s macro focus centers on the release of preliminary Purchasing Managers’ Index (PMI) readings for manufacturing and services, alongside the July Federal Reserve minutes expected on Wednesday.
Recent inflation data has been influential in shaping expectations. Cointelegraph previously noted that last week’s CPI and PPI releases pointed to a softer-than-expected inflation trajectory, prompting traders to reconsider the likelihood of additional rate hikes.
According to CME Group’s FedWatch Tool, markets are currently pricing in nearly a 70% probability that the Fed will hold rates at the 3.50%–3.75% range for the September meeting. That compares with roughly 42% odds a month earlier.
Analysis from Mosaic Asset Company—citing CPI coming in at 3.4% year-on-year—argues that moderating inflation helps prevent the policy outlook from turning overly hawkish, even though inflation remains far above the Fed’s 2% target. The report also points to how the Fed’s prior meeting ended with policy dissent, and it notes that the split was the largest since 1970.
Separately, Bloomberg quoted Cleveland Fed President Beth Hammack discussing the risk that returning inflation to 2% could take years—raising questions about whether public patience would be sufficient if progress toward the target is slow. The point matters for Bitcoin because extended tight or uncertain policy expectations can quickly change the liquidity backdrop that crypto tends to trade against.
What to watch next: the tone of the July minutes—especially any discussion around dissent—may determine whether near-term rate expectations drift further toward “hold” or reprice back toward “hikes.”
Japan’s GDP miss adds liquidity stress even as U.S. equities rally
Risk-asset traders are also monitoring Japan after Q2 GDP data missed expectations. The release showed quarterly and annual growth of 0.3% and 1.1%, respectively—below forecasts of 0.5% and 2.0%.
The data arrives as markets look for the Bank of Japan to potentially begin raising rates from current levels around 1.0% in September, a shift tied to surging bond yields and a weakening yen. Cointelegraph previously reported that Japan and the U.S. conducted a rare joint intervention in yen markets after JPY/USD hit multi-decade lows.
Beyond growth, the GDP print included a notable weakness: the first decline in private consumption in eight quarters. Oxford Economics’ Japan lead economist Norihiro Yamaguchi told CNBC that the boost to consumption from policy measures is already fading and that inflation pressures could increase in the second half as costs filter through—potentially deteriorating purchasing power.
For Bitcoin, the indirect channel is financial conditions. CryptoQuant contributor Axel Adler Jr. warned that while the situation is not yet a clear “sell risk assets” signal, the market is approaching a critical threshold. In a post on X, he highlighted a combination of conditions that could tighten global financial conditions: Japan’s government bond yields rising further (notably above 3%), additional BOJ rate hikes, a stronger yen, and rising U.S. Treasury yields. He added that if these factors align, normalization of Japan’s rates could end up pressuring both stocks and Bitcoin.
What to watch next: whether Japan’s yield and yen dynamics stay contained or accelerate—because traders often treat FX and sovereign yields as leading indicators of cross-asset liquidity.
Sentiment and ETF flows: Bitcoin risks being left out of the “capital rotation”
While macro uncertainty builds, some analysts argue the bigger issue may be positioning. Glassnode, in its “The Week Onchain” newsletter, described a divergence between Bitcoin and equities: U.S. consumer confidence remains among the weakest readings of the past decade, even as the stock market has reached an all-time high and stays near those levels.
Glassnode said the contradiction looks less puzzling once the driver is identified: households anticipating higher living costs and a softer economy may be reallocating away from cash and into assets, with equities absorbing much of that flow. The firm also pointed out that the S&P 500 reached all-time highs and that the University of Michigan’s consumer sentiment survey is expected to decline further in August.
According to Glassnode, Bitcoin is not participating in that same rotation. A key sign would be whether institutional inflows return to U.S. spot Bitcoin ETFs in a sustained way.
Cointelegraph’s article cites that last week spot Bitcoin ETFs saw net outflows of $267.2 million, based on data from Farside Investors. It also notes that only one out of five trading days ended with net inflows, totaling just $7.8 million.
What to watch next: whether outflows extend or reverse. Sustained inflows would directly challenge the idea that Bitcoin is being ignored by the same sentiment-driven capital that is supporting equities.
Exchange reserve shifts: whale inflows boost liquidity available to trade
On-chain supply dynamics are adding another layer of pressure. CryptoQuant analysis argues that whale activity is increasing exchange inflows and contributing to a reversal in BTC leaving exchanges—an important nuance because exchange balances can affect how much BTC is available for trading or hedging.
The report highlights that Binance’s whale ratio reached 0.71 on Aug. 10, the highest since early March. CryptoQuant also said Binance’s BTC reserves totaled 674,332 BTC on Sunday, up 2.57% month-to-date and at their highest level since November 2025.
“Exchange deposits do not necessarily mean immediate selling, but they increase the amount of BTC available for trading or hedging,” CryptoQuant commented.
The broader context matters: Cointelegraph previously reported that exchange activity had been skewed toward derivatives as Bitcoin has traded in a tight range since early June. In that earlier coverage, Binance futures volume was noted as significantly larger than spot volume in early August, reinforcing the idea that the market’s “tight range” behavior may be fueled as much by leverage and hedging as by spot demand.
For traders and long-term investors, the next signals are likely to come from three directions: the Fed minutes’ implications for policy expectations, whether Japan’s rates and yen continue to tighten financial conditions, and whether ETF flows and exchange-reserve trends move in a way that either reconnects Bitcoin to broader risk appetite—or further isolates it.
This article was originally published as Bitcoin Slips Below 200-Week Trend as 2022 Pattern Returns: Key This Week on Crypto Breaking News – your trusted source for crypto news, Bitcoin news, and blockchain updates.
0
0

 Manage all your crypto, NFT and DeFi from one place
Securely connect the portfolio you’re using to start.

0
0


0
0

0
0