Why Is the Crypto Market Down Today?

0
0


The crypto market has extended its downtrend by another day, reflecting cautious sentiment among investors. The total crypto market capitalization fell by 0.37% over the past 24 hours. The leading coin, Bitcoin, has been down by 0.23%, while Raydium has been the market’s top loser over the past day.
In the news today:
- Republican lawmakers from two key House committees have introduced a new crypto bill to create a comprehensive regulatory framework for digital assets. The draft builds on the FIT21 Act passed in 2024, focusing on reducing market concentration while promoting innovation and protecting consumers.
- The SEC’s Crypto Task Force has released the full agenda for its next roundtable discussion, confirming a focus on tokenization. The event will be split into two parts, likely covering real-world assets (RWAs) and broader financial instruments.
TOTAL at Key Support Level: Will Market Capitalization Hold?
Trading activity across the broader crypto market has marked another day of decline, with the total market capitalization falling by a modest 0.37% over the past 24 hours. The pullback comes amid mixed investor sentiment and ongoing macroeconomic uncertainty.
As of this writing, the market cap stands at $2.89 trillion, having shed $10.63 billion of its value during that period.
At its current value, TOTAL sits at a critical support level. While price has dipped below this threshold a few times recently, it has consistently provided strong support against any major price breakdown since April 23.
However, with buying pressure steadily weakening, TOTAL could be on the verge of slipping below this key support floor. If that happens, the total market capitalization may decline, potentially dropping to $2.86 trillion.
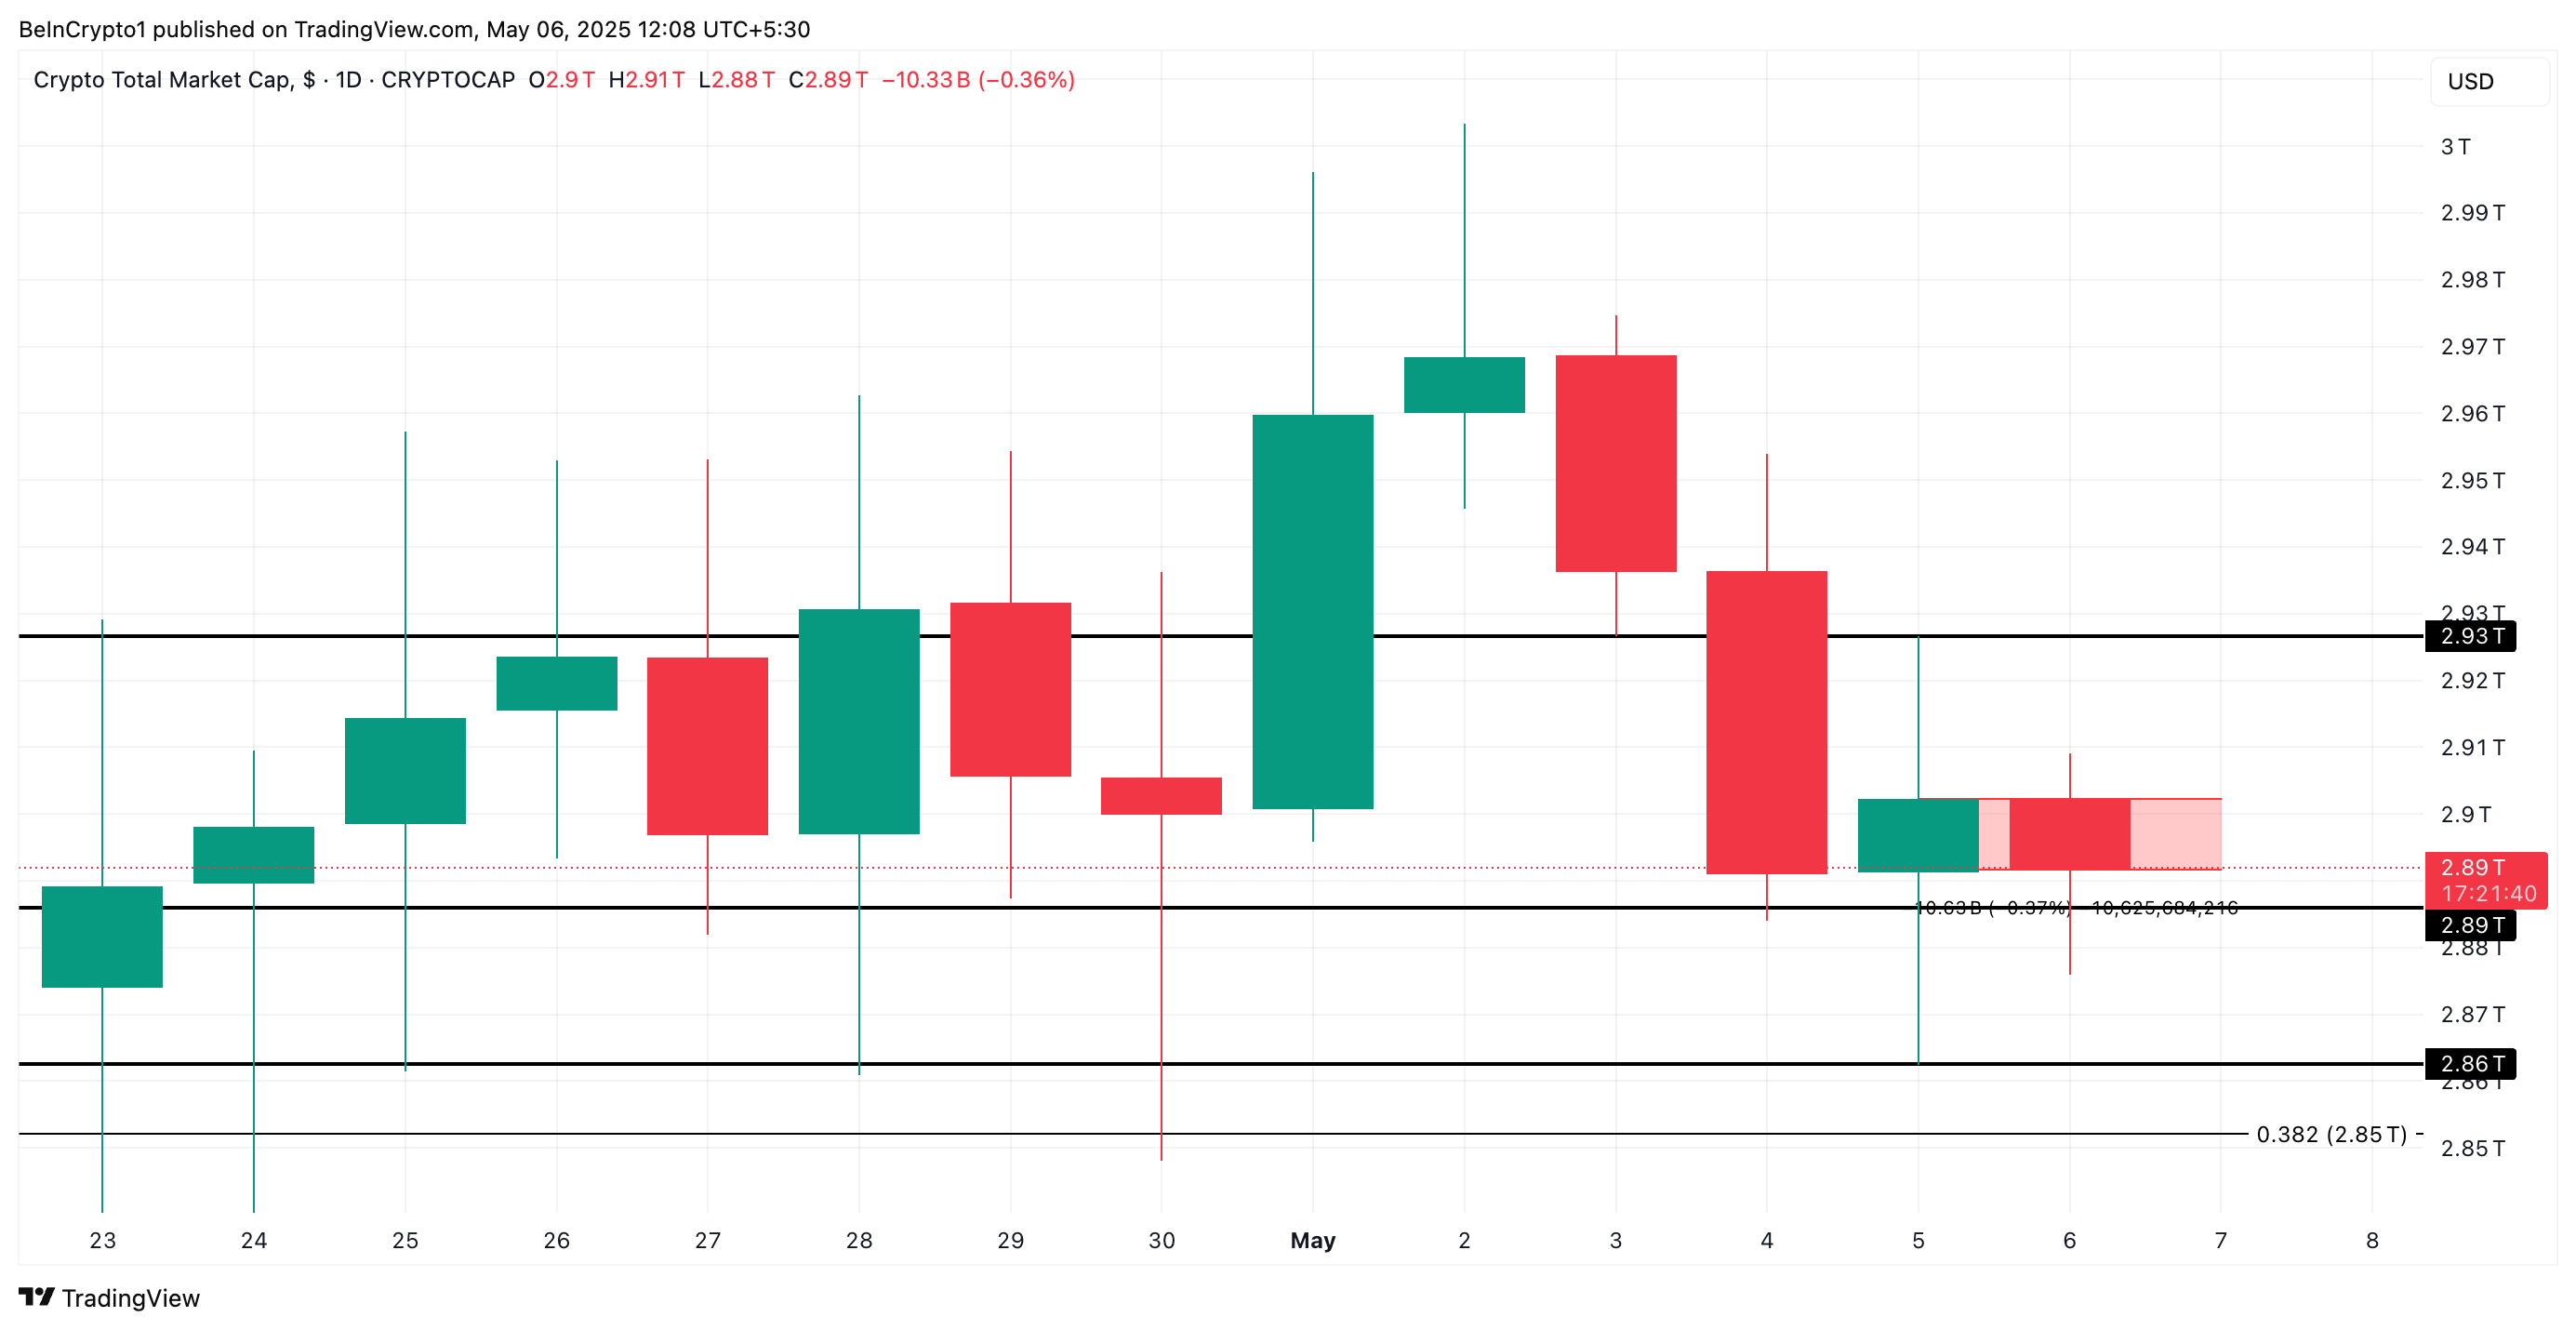 Total Crypto Market Cap Analysis. Source: TradingView
Conversely, a renewed wave of buying interest could invalidate this bearish outlook. In that scenario, TOTAL may rebound and climb back to $2.93 trillion.
ETF Activity Signals Institutional Confidence in Bitcoin
BTC has mirrored the broader trend with a slight 0.23% decline during the same period. Despite the price weakness this week, BTC spot exchange-traded funds (ETFs) in the US recorded another day of net inflows on Monday, signaling persistent institutional interest even amid short-term price dips.
According to SoSoValue data, Bitcoin spot ETFs recorded a total net inflow of $425.45 million on Monday, marking three consecutive days of positive inflows.
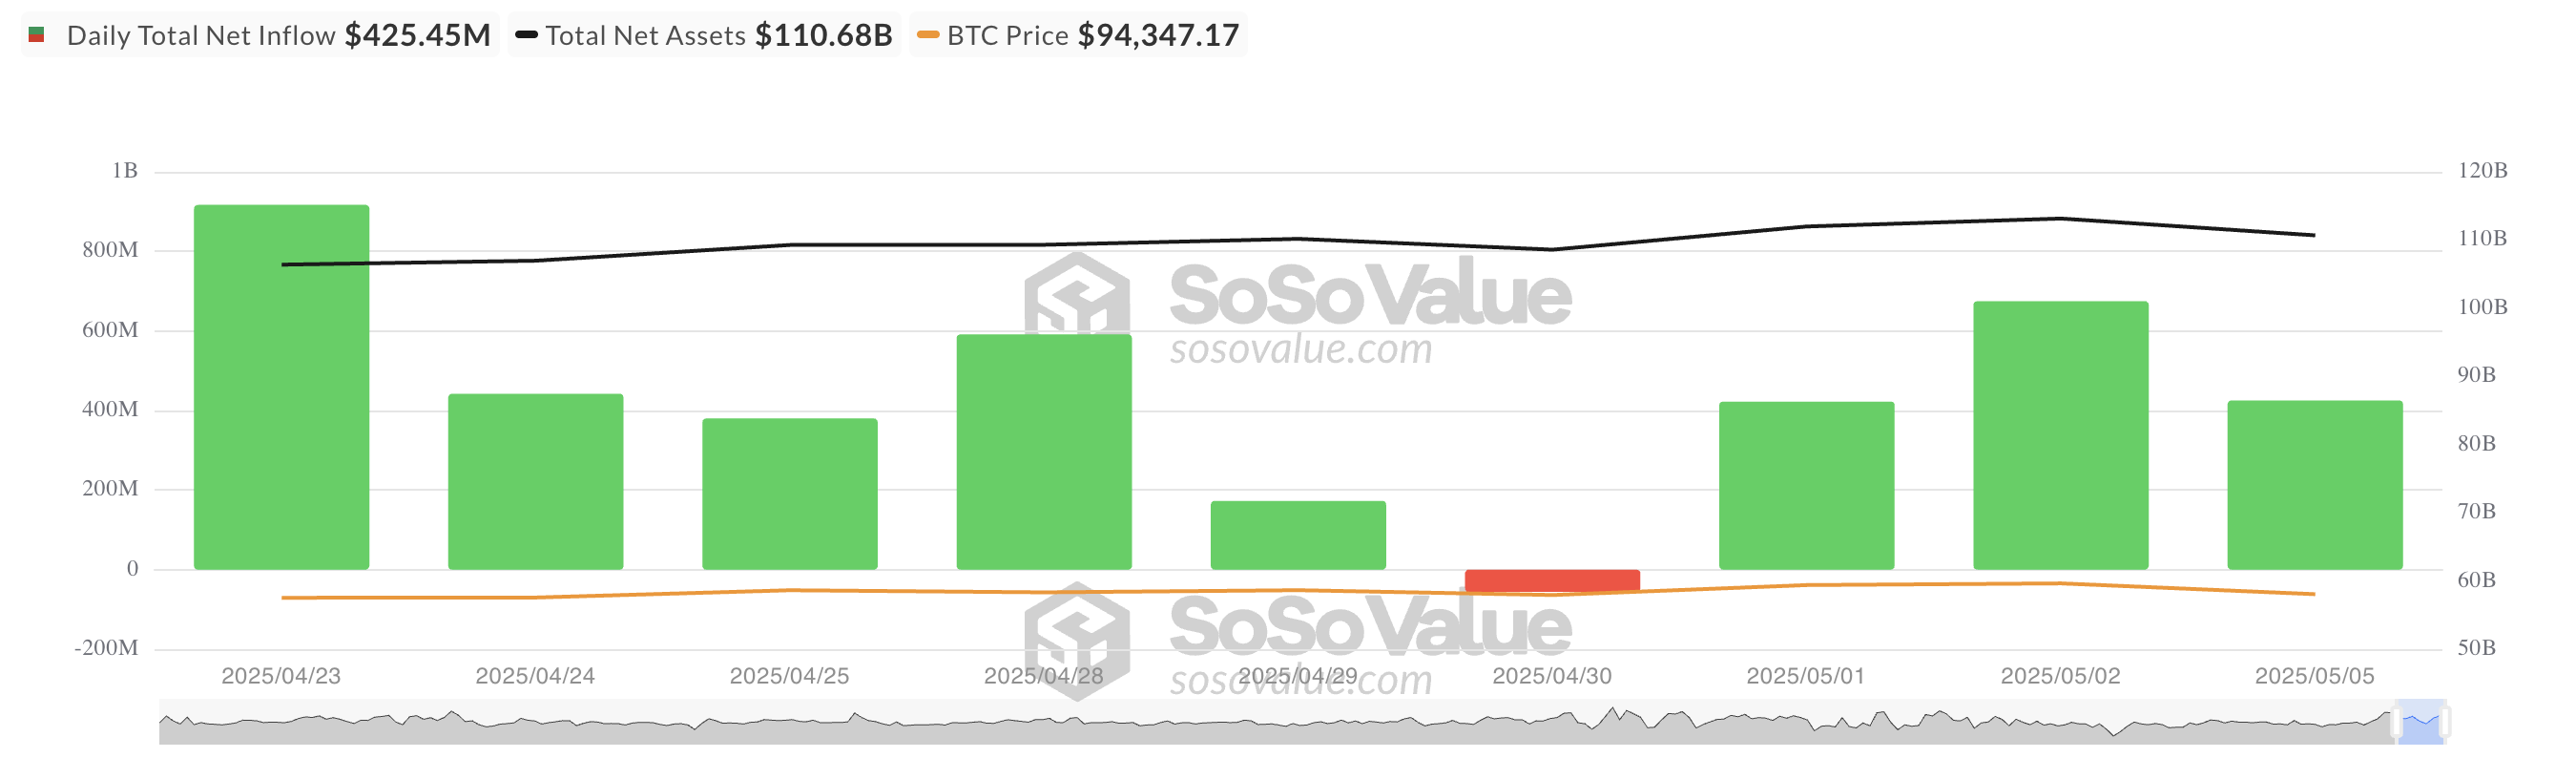 Total Bitcoin Spot ETF Net Inflow. Source: SosoValue
BlackRock’s iShares Bitcoin Trust (IBIT) posted the highest inflow among all BTC ETFs. On Monday, the fund attracted $531.18 million in new investments, pushing its cumulative net inflows to $44.21 billion.
The largest net outflow among Bitcoin spot ETFs came from Fidelity’s ETF FBTC, which saw $57.82 million leave the fund.
At press time, BTC trades at $94,460. If traders maintain their “wait and see” approach, the coin’s price could remain range-based in the short term. If an upside breakout occurs, the coin could rally to $96,187.
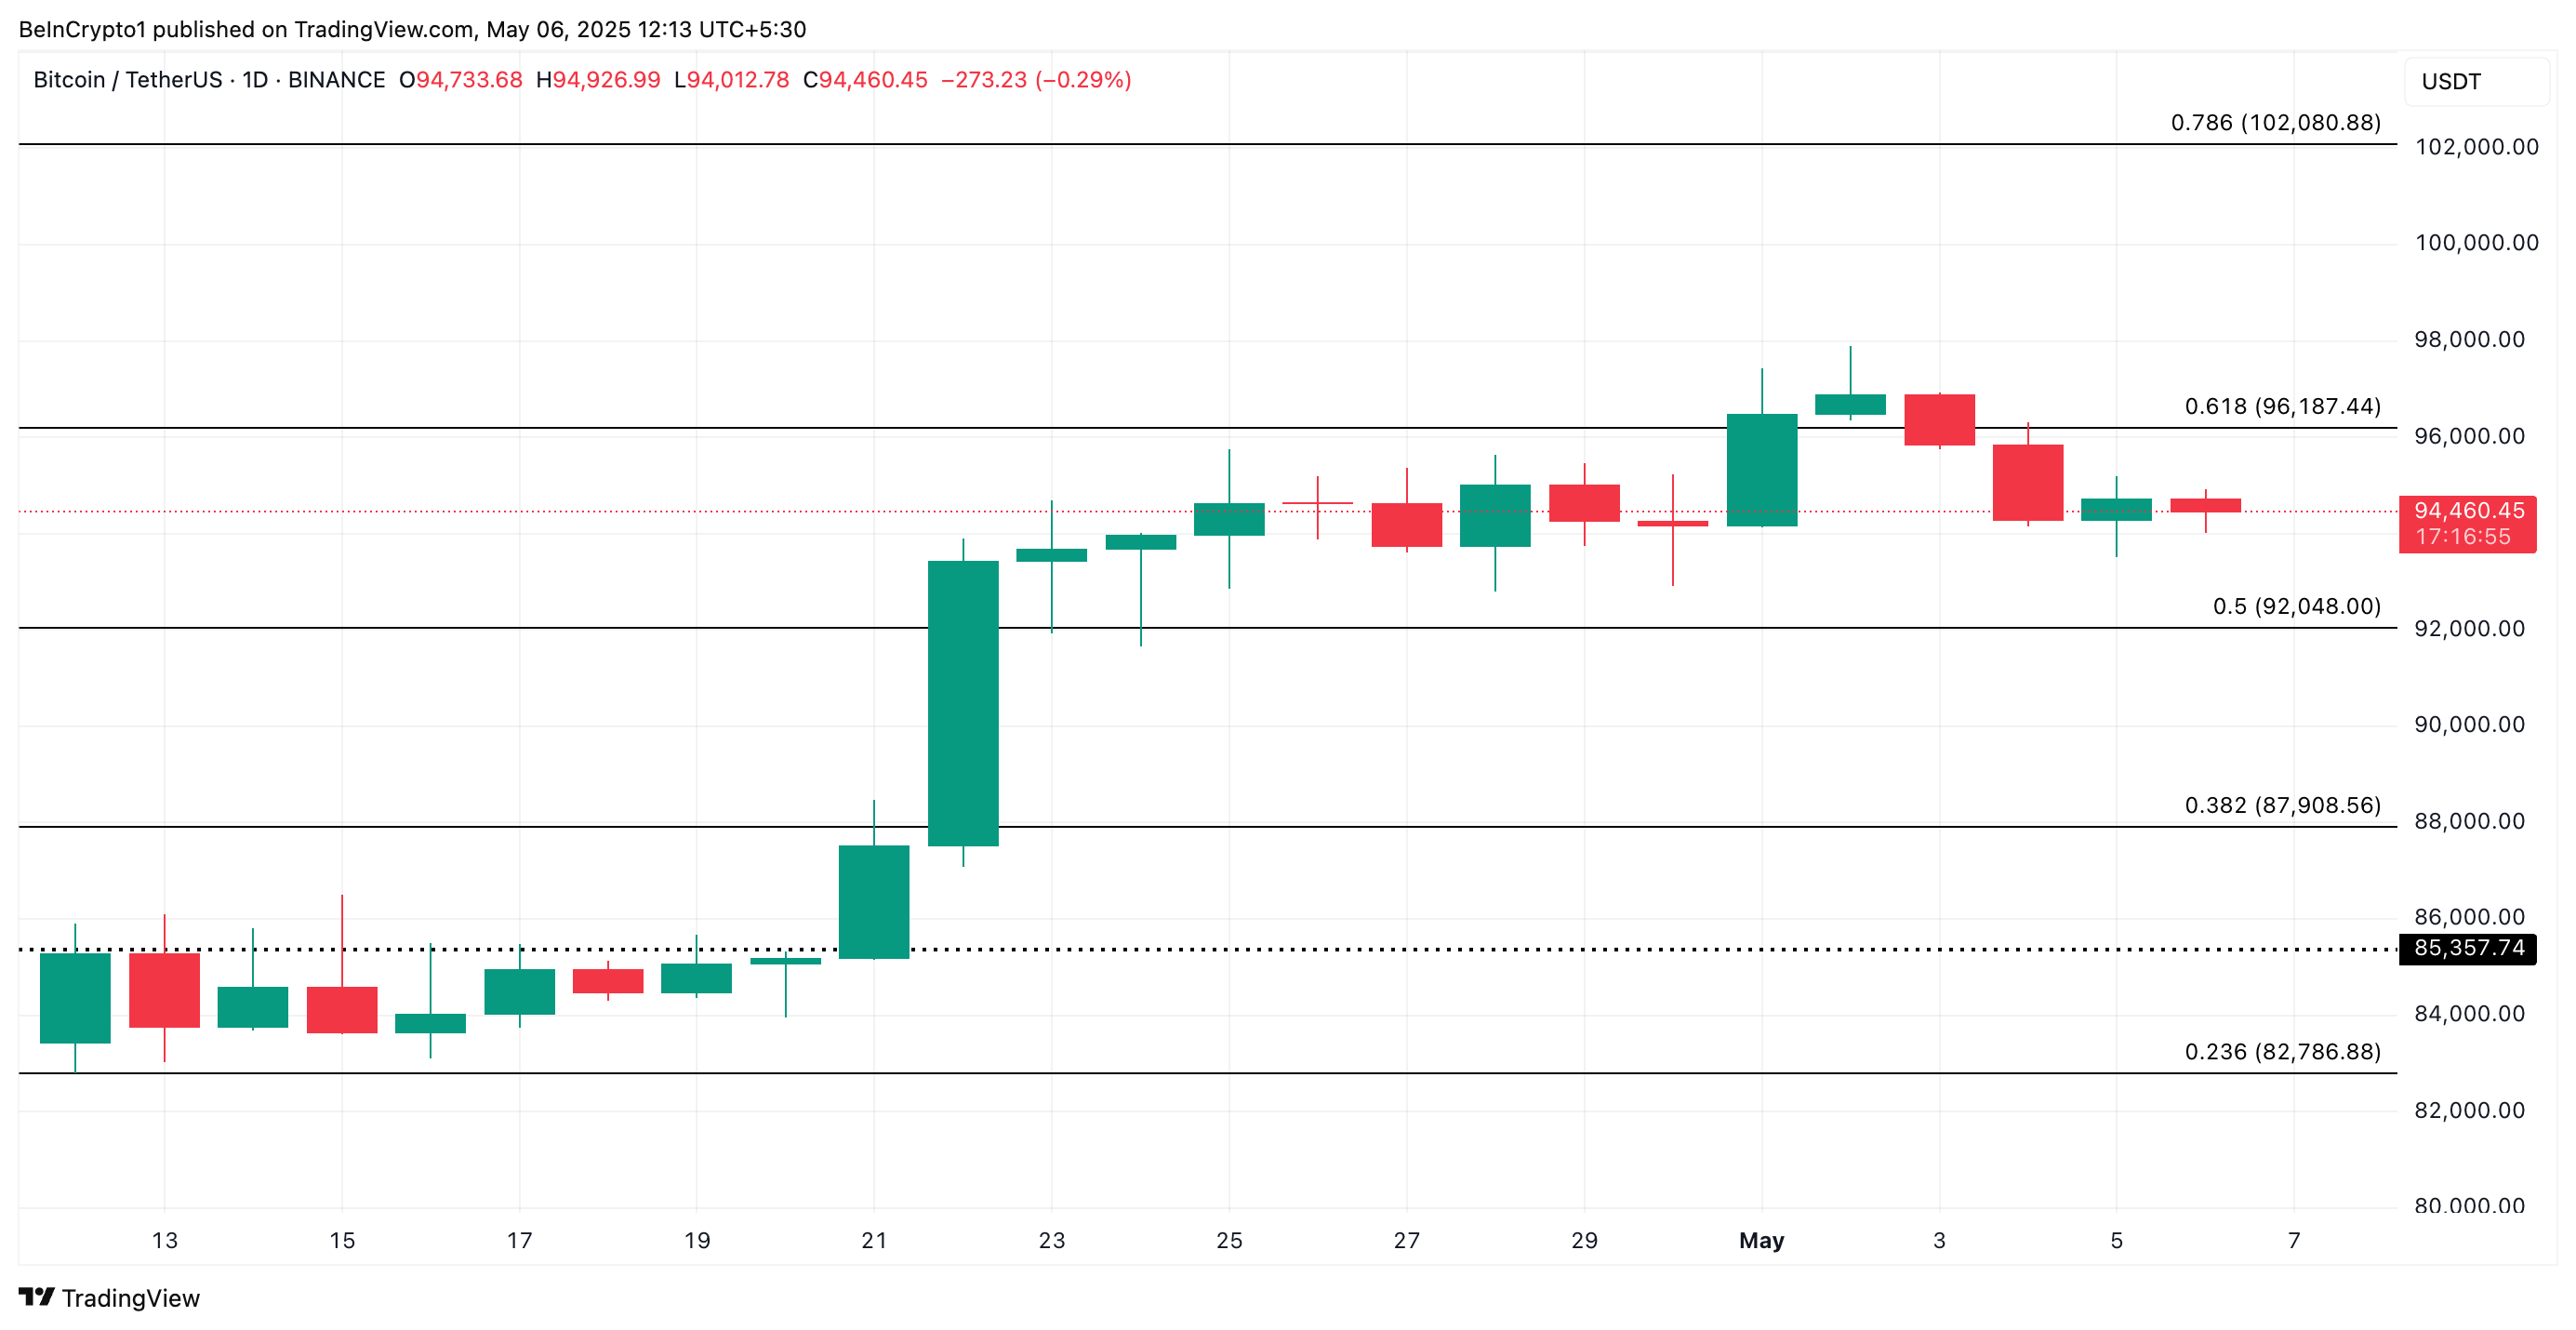 Bitcoin Price Analysis. Source: TradingView
However, a break to the downside could send BTC’s price to $92,048.
RAY Tumbles with Rising Sell Pressure
RAY is down 14% over the past day. It currently trades at $2.35, lingering under severe bearish pressure.
Its daily trading volume has rocketed by 121% during the same period, reflecting the spike in selloffs among RAY holders.
When an asset’s price drops while trading volume increases, it signals strong selling pressure, with more market participants actively offloading their positions. This combination suggests bearish sentiment in the RAY markets and indicates the potential for further downside.
In this case, RAY’s price could fall to $1.38.
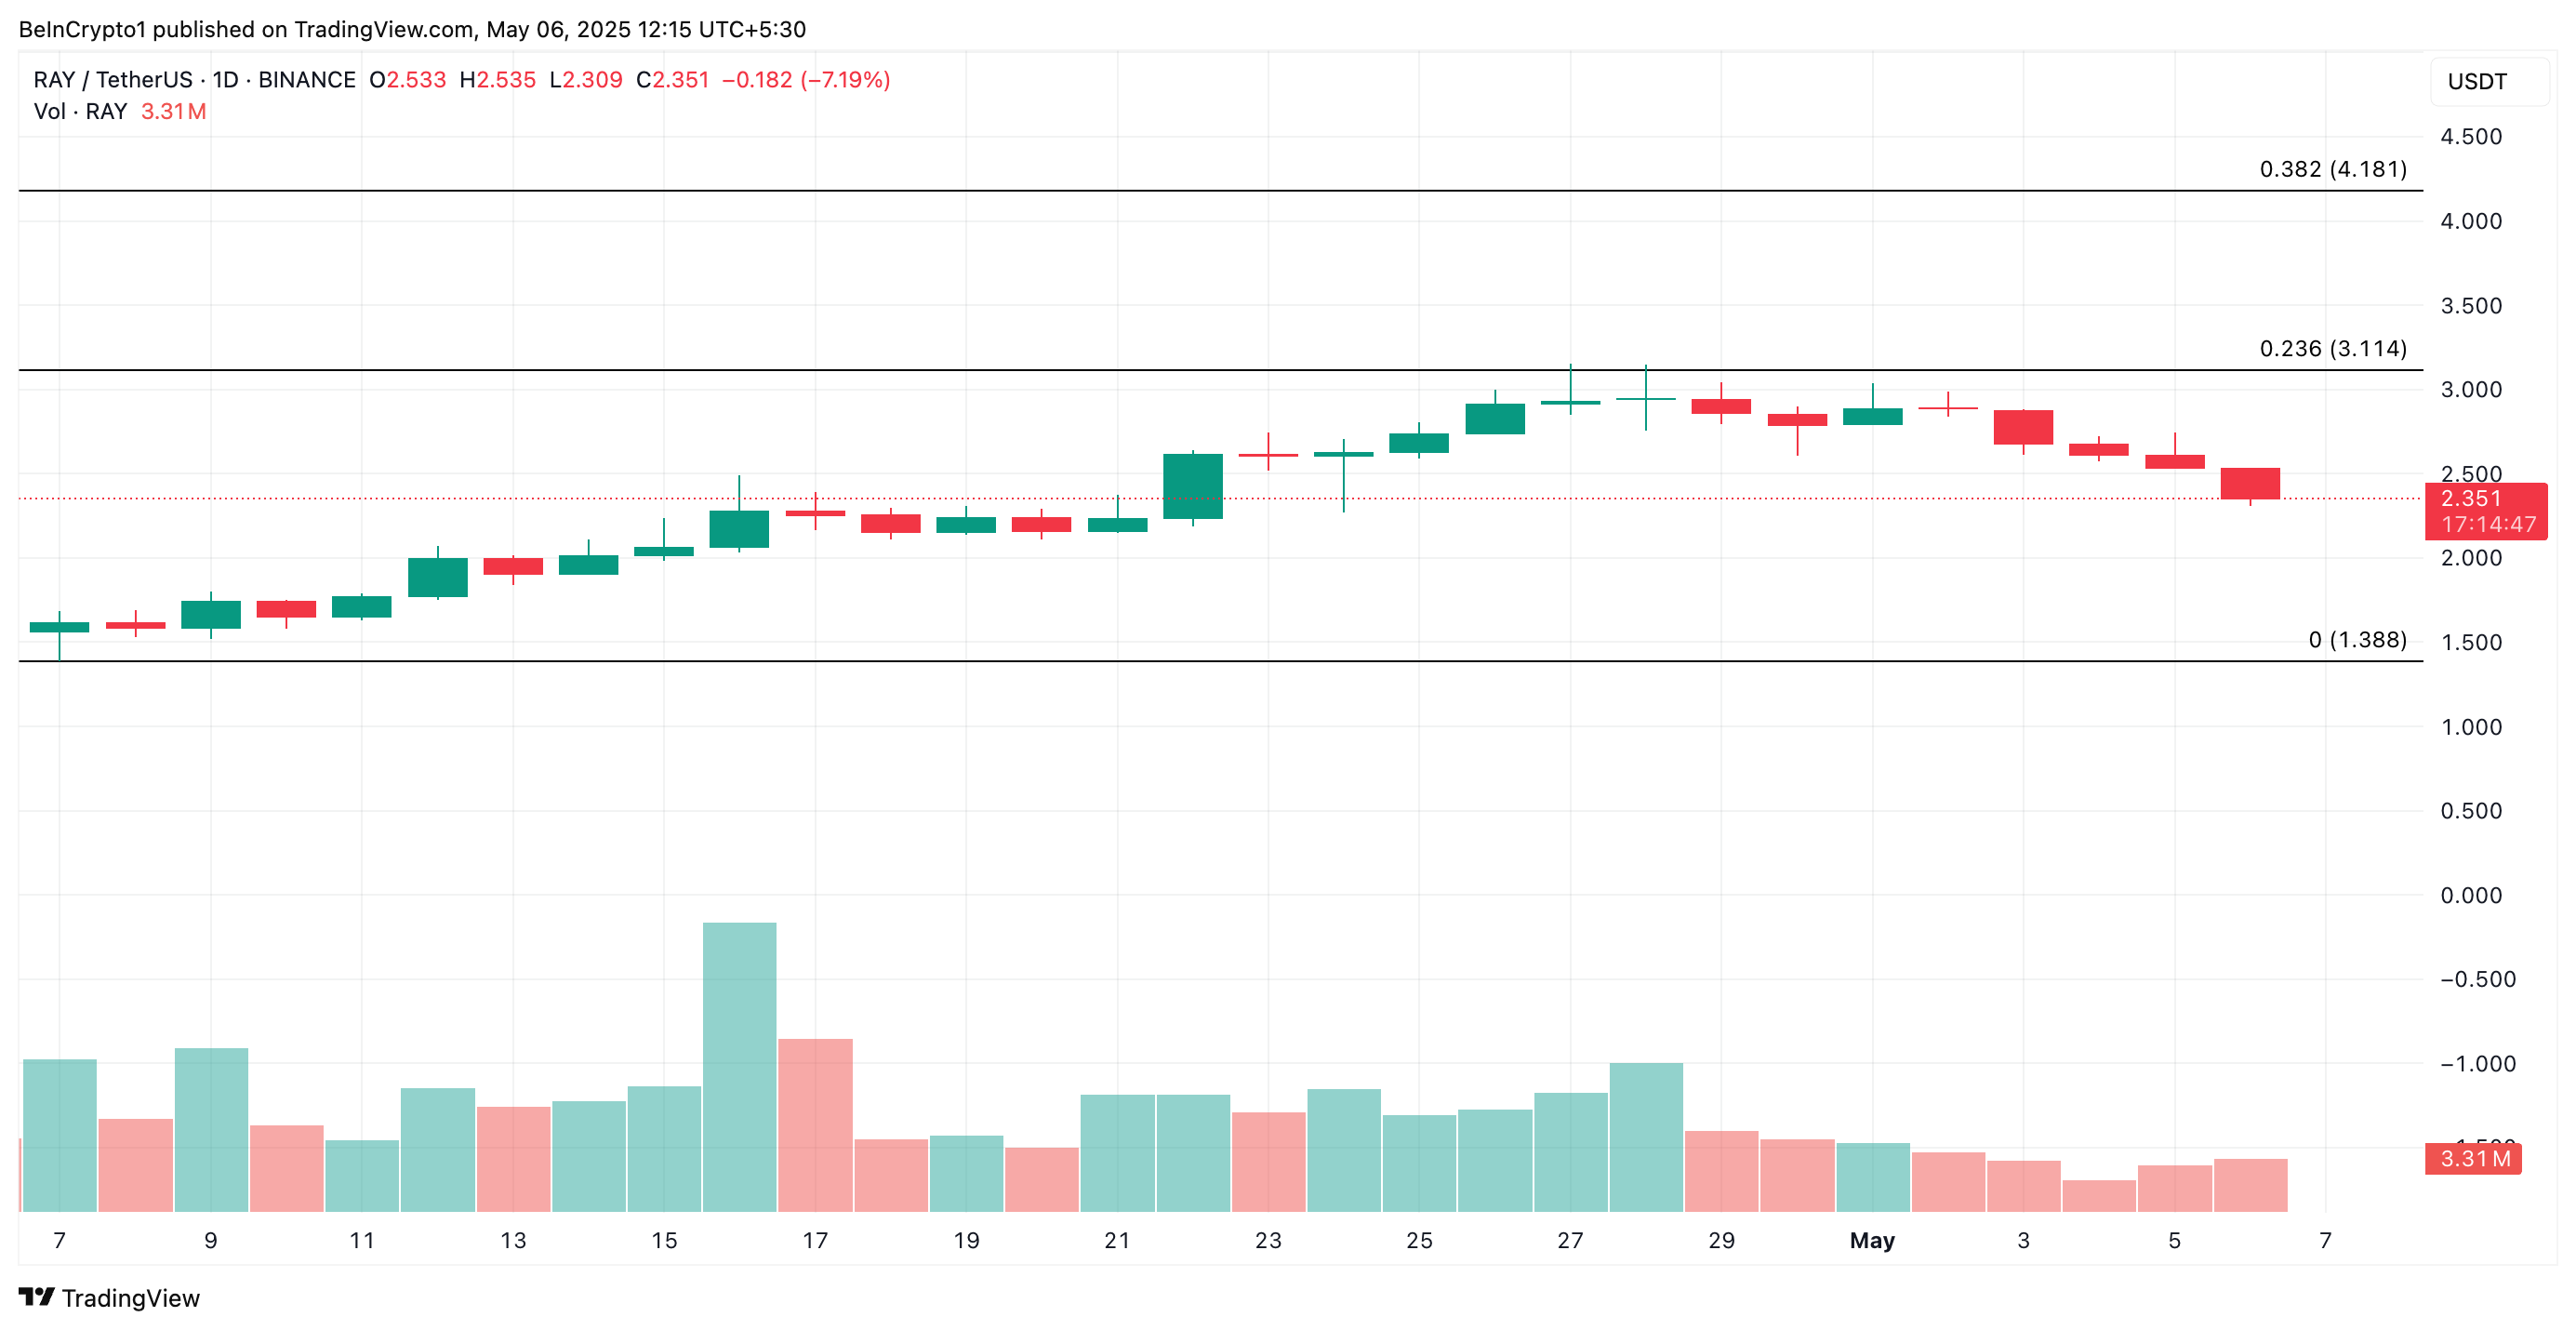 Raydium Price Analysis. Source: TradingView
On the other hand, if demand climbs, the token’s value could rally to $3.11.
0
0


 Manage all your crypto, NFT and DeFi from one place
Securely connect the portfolio you’re using to start.

0
0


