OKB’s 160% Rally Meets $58 Million Sell Wall — Is a Free Fall Next?

0
0
OKB, the native token of OKX, has delivered an eye-popping 160% surge in just 24 hours, briefly setting a new all-time high above $135. The OKB price rally comes on the back of bullish narratives, from quarterly token burns and a shrinking circulating supply to speculation about a potential OKX IPO.
Yet, beneath the surface, three key signals suggest the rally’s foundation may be far shakier than the headline numbers imply.
Exchange Inflows Signal a $58 Million Incoming Pressure!
Nansen data shows 553,000 OKB tokens, worth roughly $58 million at $106.19 (price at the time of writing), have entered exchanges in the last 24 hours. This 36.03% jump in exchange balances can inflict significant selling pressure.
 OKB price and rising exchange inflows: Nansen
Such a sharp spike in supply on exchanges often points to a readiness to sell, more so post a rally. But there is one silver lining in play.
While exchange inflows show a wave of potential selling, one cohort has been doing the opposite. The top 100 OKB addresses now hold 299.93 million tokens — and that’s after a 25% increase in holdings.
At that scale, their net addition works out to roughly 59.98 million tokens, which far exceeds the 553,000 OKB that entered exchanges over the past 24 hours. This disparity suggests whales are still buying aggressively into the rally, potentially absorbing sell pressure before it can cascade into a deeper pullback. However, whale accumulation doesn’t always guarantee immediate upside; such buying can be long-term positioning rather than short-term defense.
For token TA and market updates: Want more token insights like this? Sign up for Editor Harsh Notariya’s Daily Crypto Newsletter here.
Liquidation Clusters Add Downside Fuel
BingX’s liquidation heatmap reveals $1.1 million in long positions concentrated near the $92.6 mark, with a smaller pocket just above $100. If exchange inflows begin pressuring prices lower, these levels could act as tripwires for a cascade of forced selling.
 OKB liquidation map is long-biased: Coinglass
Liquidations are self-feeding; a drop into the first cluster can trigger sell orders that push the price into the next, compounding losses. With OKB’s recent vertical move, the gap between the current price and the first major cluster is not wide, raising the odds of a sharp unwind if momentum flips.
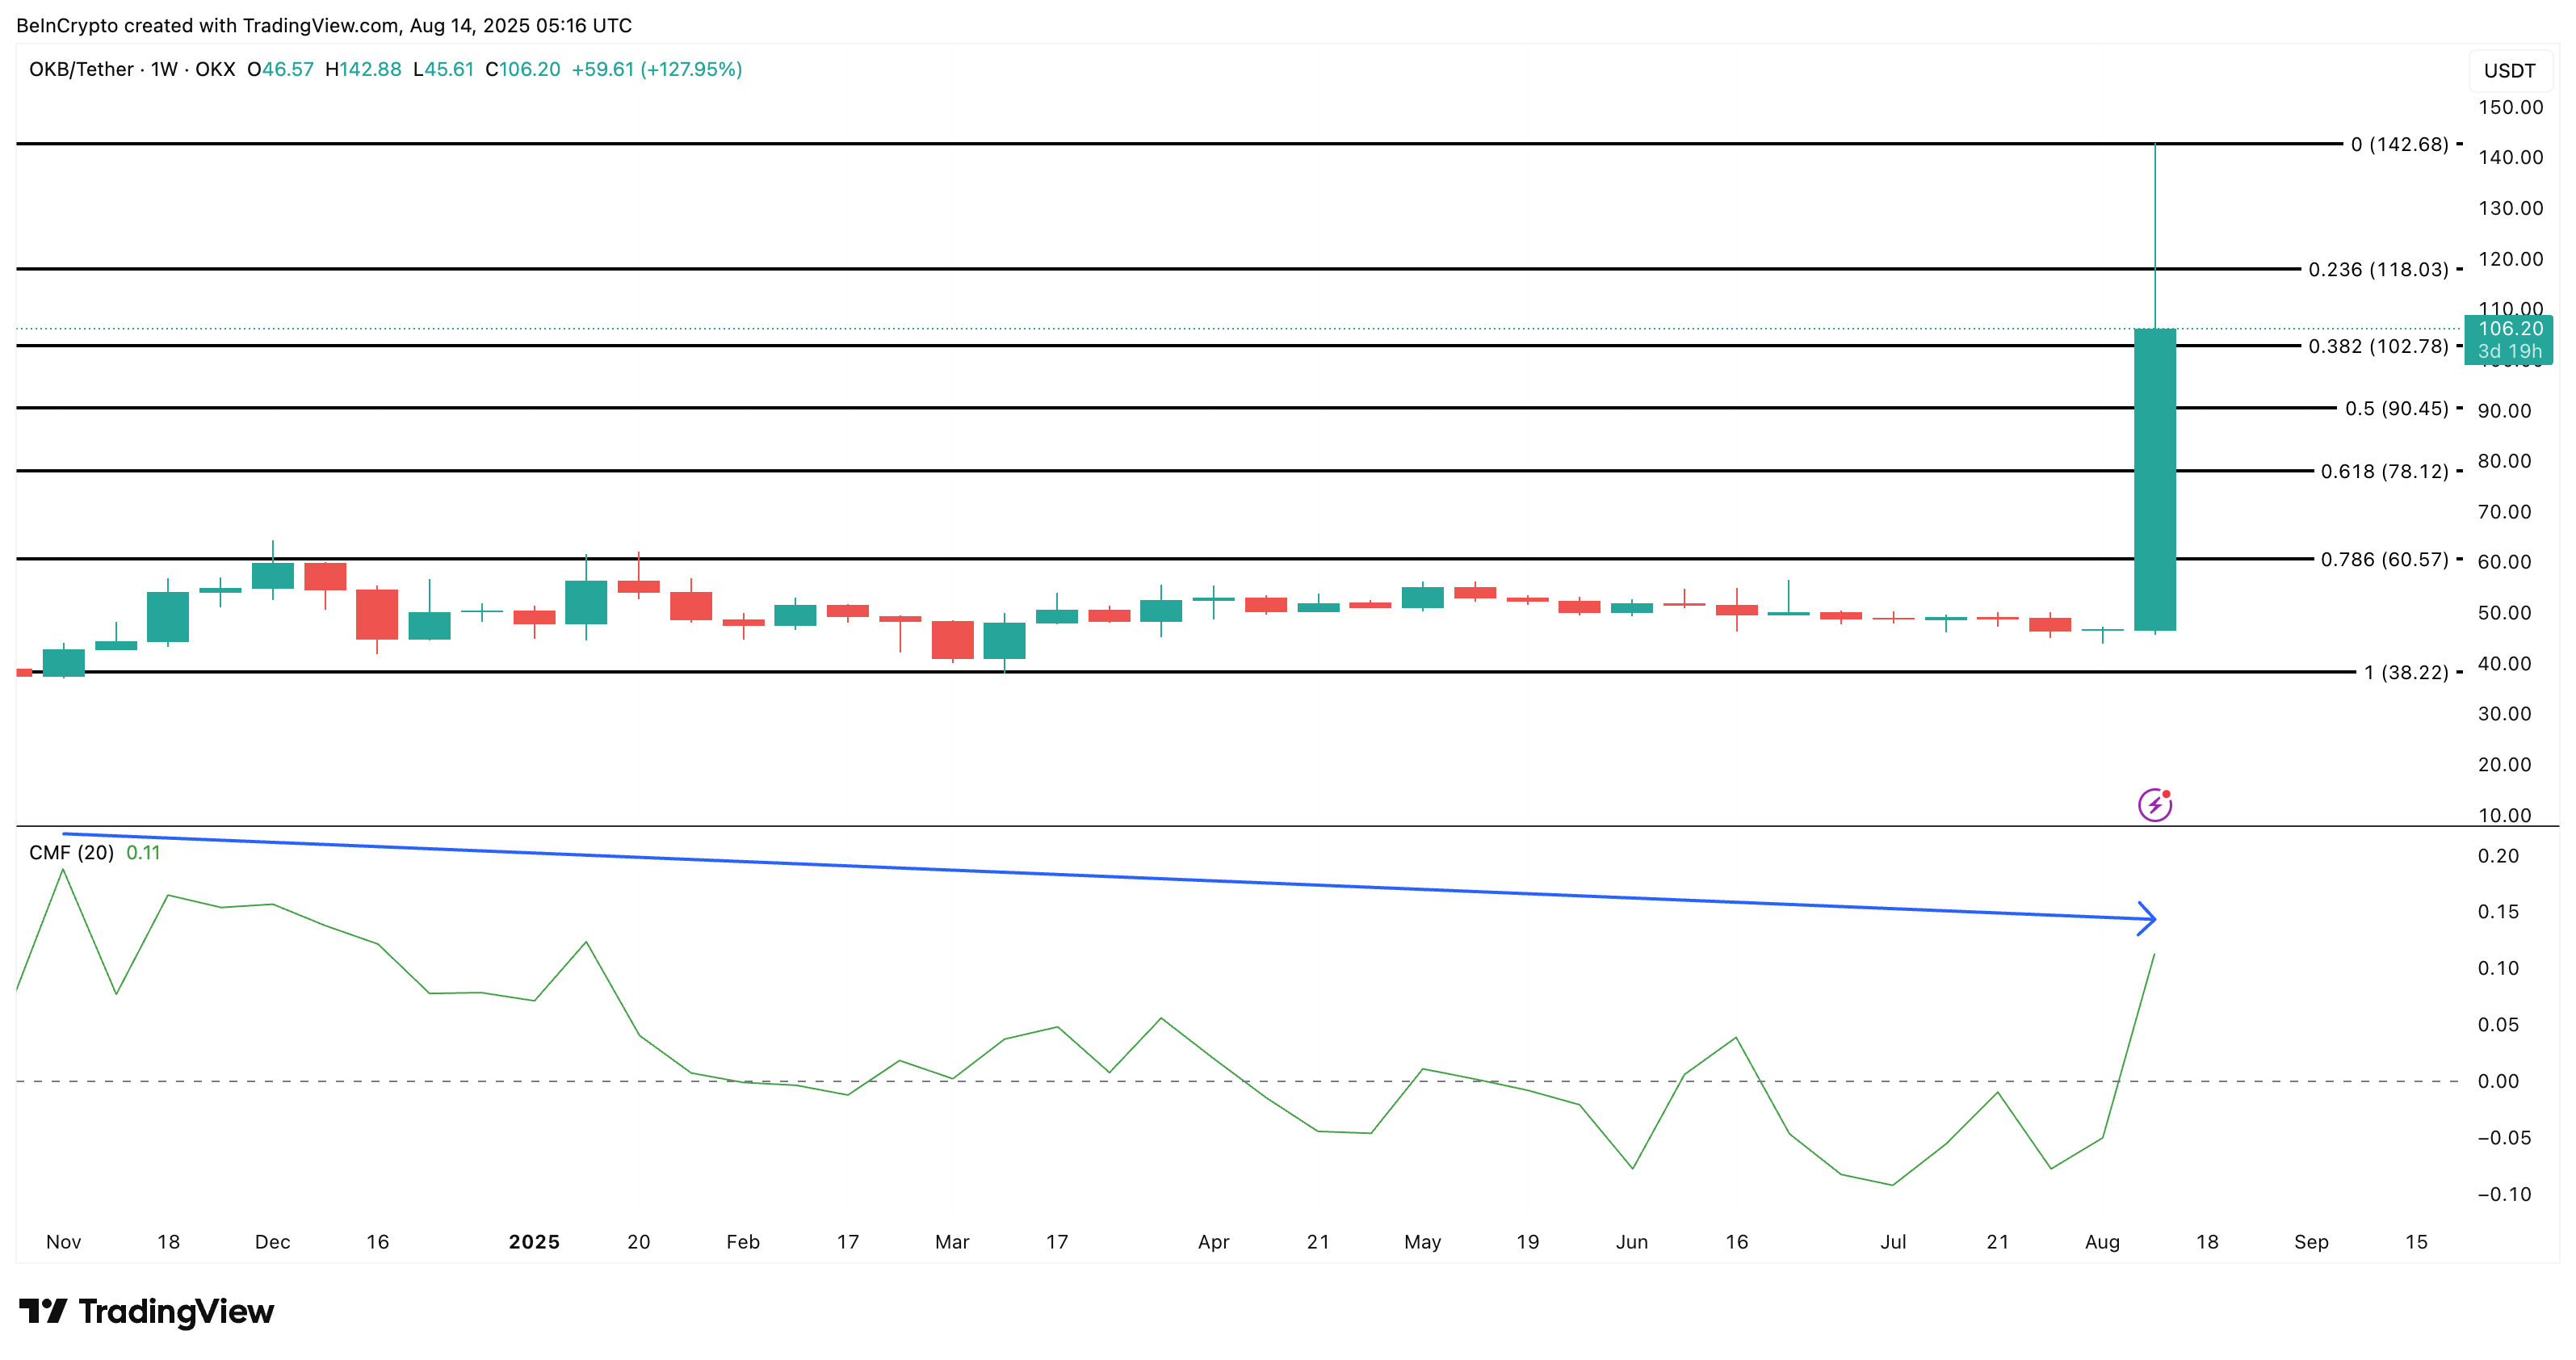
Weekly OKB Price Chart And CMF Show Weakening Underlying Strength
Unlike volatile daily movers, OKB’s price action tends to develop over longer timeframes, making the weekly chart a better tool for spotting sustainable trends.
The OKB price chart shows the price pausing after failing to push through the $142 mark. However, at present, it is respecting the $102 support level. Breaking down this support level will trigger several long liquidations as the major cluster currently exists between $106 and $102.
 OKB price analysis: TradingView
Overlaying the Chaikin Money Flow (CMF) reveals a lower high compared to November 2024 levels, even as the price reached record levels.
This divergence signals weaker capital inflows driving the latest push, suggesting the rally could be running on reduced buying pressure and is purely news-driven. When coupled with the sell wall and liquidation clusters, the CMF’s softening trend acts as a validation that upside energy may be fading.
Also, if the $102 level gets broken, the next key support zones per the weekly chart exist at $90 and $78 respectively. Reaching these levels would validate the “free fall” narrative. Also, as we are tracking the OKB price on a weekly timeframe, the supposed fall or even a consolidation might move slowly.
However, if the OKB price manages to reclaim the $118 resistance, the exchange inflows slow down and top addresses keep accumulating, the short-term bearish hypothesis loses steam. Then, the price might likely retest the $142 level.
0
0


 Manage all your crypto, NFT and DeFi from one place
Securely connect the portfolio you’re using to start.

0
0

0
0

0
0

0
0