
0
0
In this Stellar (XLM) price prediction for 2025, 2026-2030, we will analyze the price patterns of XLM by using accurate trader-friendly technical analysis indicators and predict the future movement of the cryptocurrency.
TABLE OF CONTENTS |
INTRODUCTION |
|
STELLAR (XLM) PRICE PREDICTION 2025 |
|
| STELLAR (XLM) PRICE PREDICTION 2026, 2027-2030 |
| CONCLUSION |
| FAQ |
| Current Price | $0.2503 | 24 – Hour Price Change | 2.24% Down |
| 24 – Hour Trading Volume | $205.78M |
| Market Cap | $7.72B |
| Circulating Supply | 30.77B XLM | All – Time High | $0.9381 (On Jan 04, 2018) |
| All – Time Low | $0.001227 (On Nov 19, 2014) |
| TICKER | XLM |
| BLOCKCHAIN | Stellar |
| CATEGORY | Stellar Consensus Protocol |
| LAUNCHED ON | 2014 |
| UTILITIES | Governance, Fast Transactions, gas fees & rewards |
Stellar (XLM) is the native cryptocurrency of the Stellar network. The token is well-known as Stellar Lumens (XLM). Stellar is a peer-to-peer (P2P) decentralized payment network that was launched in 2014. Stellar Lumens (XLM) is used as the transaction fees on the network. It also serves as the intermediate payment currency across cross-bridge transactions.
The supply of XLM and the network’s development is supported by Stellar Development Foundation (SDF), Stellar’s native non-profit organization. Stellar network secures its blockchain with Stellar Consensus Protocol (SCP). SCP is a modified consensus mechanism that is based on the Federated Byzantine Agreement (FBA). Hence, nodes are selected based on voting and later verify and validate transactions onto the distributed ledger.
The Stellar network also holds its own decentralized exchange. Stellar network bridges the off-chain financial institutions to the on-chain payment ecosystem. Thus, its prime motto is to accelerate the mission of banking the unbanked.
Stellar (XLM) ranks 14th on CoinMarketCap in terms of its market capitalization. The overview of the Stellar price prediction for 2025 is explained below with a daily time frame.
In the above chart, Stellar (XLM) laid out a Descending Channel pattern. A descending channel, also known as a falling channel, is a bearish technical analysis pattern formed by two parallel downward-sloping trendlines. The upper trendline connects a series of high points, indicating resistance where the price struggles to rise above, while the lower trendline connects the lower points, acting as support.
This pattern suggests that sellers are in control, with the price consistently making lower highs and lower lows. Traders often look to sell near the upper trendline and buy near the lower trendline, as the price typically oscillates within this defined range. Overall, the descending channel helps traders identify potential shorting opportunities and assess market sentiment.
At the time of analysis, the price of Stellar (XLM) was recorded at $0.2094. If the pattern trend continues, then the price of XLM might reach the resistance levels of $0.2667, $0.3756 and $0.4381. If the trend reverses, then the price of XLM may fall to the support level of $0.2005.
The chart given below elucidates the possible resistance and support levels of Stellar (XLM) in 2025.
From the above chart, we can analyze and identify the following as resistance and support levels of Stellar (XLM) for 2025.
| Resistance Level 1 | $0.2667 |
| Resistance Level 2 | $0.6423 |
| Support Level 1 | $0.1415 |
| Support Level 2 | $0.0703 |
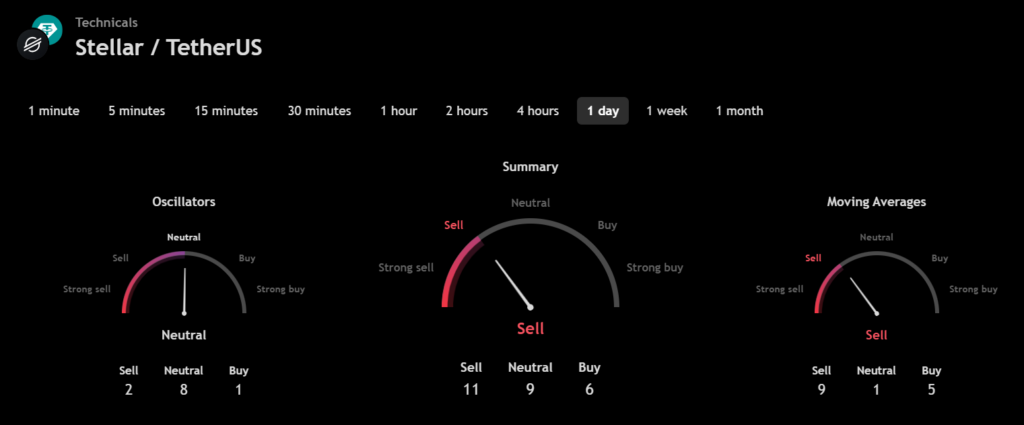
The technical analysis indicators such as Relative Volume (RVOL), Moving Average (MA), and Relative Strength Index (RSI) of Bitcoin (XLM) are shown in the chart below.
From the readings on the chart above, we can make the following inferences regarding the current Stellar (XLM) market in 2025.
| INDICATOR | PURPOSE | READING | INFERENCE |
| 50-Day Moving Average (50MA) | Nature of the current trend by comparing the average price over 50 days | 50 MA = $0.2605 Price = $0.2474 (50MA > Price) | Bearish/Downtrend |
| Relative Strength Index (RSI) | Magnitude of price change;Analyzing oversold & overbought conditions | 48.8728 <30 = Oversold 50-70 = Neutral >70 = Overbought | Oversold |
| Relative Volume (RVOL) | Asset’s trading volume in relation to its recent average volumes | Below cutoff line | Weak volume |
In the below chart, we analyze the strength and volatility of Stellar (XLM) using the following technical analysis indicators — Average Directional Index (ADX) and Relative Volatility Index (RVI).
From the readings on the chart above, we can make the following inferences regarding the price momentum of Stellar (XLM).
| INDICATOR | PURPOSE | READING | INFERENCE |
| Average Directional Index (ADX) | Strength of the trend momentum | 28.8490 | Weak Trend |
| Relative Volatility Index (RVI) | Volatility over a specific period | 56.18 <50 = Low >50 = High | High volatility |
Let us now compare the price movements of Stellar (XLM) with that of Bitcoin (BTC), and Ethereum (ETH).
From the above chart, we can interpret that the price action of XLM is similar to that of BTC and ETH. That is, when the price of BTC and ETH increases or decreases, the price of XLM also increases or decreases respectively.
With the help of the aforementioned technical analysis indicators and trend patterns, let us predict the price of Stellar (XLM) between 2026, 2027, 2028, 2029, and 2030.
| Year | Bullish Price | Bearish Price |
| Stellar (XLM) Price Prediction 2026 | $2.8 | $0.08 |
| Stellar (XLM) Price Prediction 2027 | $3.1 | $0.07 |
| Stellar (XLM) Price Prediction 2028 | $3.6 | $0.06 |
| Stellar (XLM) Price Prediction 2029 | $4.2 | $0.05 |
| Stellar (XLM) Price Prediction 2030 | $5 | $0.04 |
If Stellar (XLM) establishes itself as a good investment in 2025, this year would be favorable to the cryptocurrency. In conclusion, the bullish Stellar (XLM) price prediction for 2025 is $0.6423. Comparatively, if unfavorable sentiment is triggered, the bearish Stellar (XLM) price prediction for 2025 is $0.0703.
If the market momentum and investors’ sentiment positively elevate, then Stellar (XLM) might hit $2. Furthermore, with future upgrades and advancements in the Stellar ecosystem, XLM might surpass its current all-time high (ATH) of $0.9381 and mark its new ATH.
Stellar (XLM) is the native cryptocurrency of Stellar, a peer-to-peer (P2P) decentralized payment network that was launched in 2014.
Stellar (XLM) has been listed on many crypto exchanges which include Binance, WEEX, OKX, Deepcoin, and LBank.
With the ongoing developments and upgrades within the Stellar platform, Stellar (XLM) has a high possibility of reaching its ATH soon.
On January 04, 2018, Stellar (XLM) reached its new all-time high (ATH) of $0.9381.
According to CoinMarketCap, LINK hit its all-time low (ATL) of $0.1263 on September 23, 2017.
Stellar (XLM) is one of the active cryptos that continues to maintain its bullish state. Eventually, if this bullish trend continues then Stellar (XLM) will hit $2 soon.
Stellar (XLM) price is expected to reach $2.8 by 2026.
Stellar (XLM) price is expected to reach $3.1 by 2027.
Stellar (XLM) price is expected to reach $3.6 by 2028.
Stellar (XLM) price is expected to reach $4.2 by 2029.
Top Crypto Predictions
Dogecoin (DOGE) Price Prediction
Disclaimer: The opinion expressed in this article is solely the author’s. It does not represent any investment advice. TheNewsCrypto team encourages all to do their own research before investing.
0
0
 Manage all your crypto, NFT and DeFi from one place
Securely connect the portfolio you’re using to start.

0
0

0
0


