
Bitcoin’s Historic August Leaves One Big Question for Q4

0
0

Bitcoin’s historic August just closed the books on its best month in nine years. The rally puts 2026 in rare company.
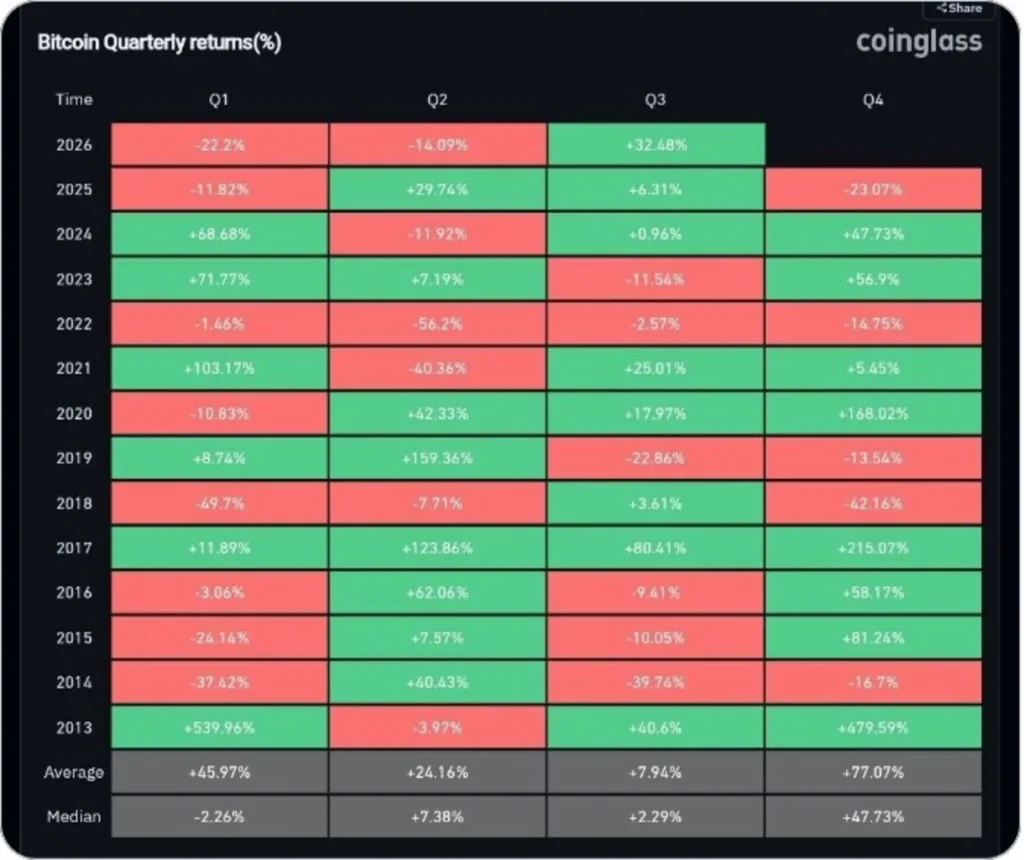
Only 2017 saw a stronger August-to-Q3 stretch, according to Coinglass’s quarterly return data.
The Quarter-by-Quarter Turnaround
The numbers tell a clear story. Bitcoin lost 22.2% in Q1 2026. It lost another 14.09% in Q2. Then Q3 flipped hard. BTC is up 32.48% quarter to date.
That beats the historical Q3 average of just 7.94%. Momentum has clearly turned.
Why 2017 Is the Comparison Point
History only offers one stronger Q3. That was 2017. Bitcoin gained 80.41% that quarter. It followed with a 215.07% surge in Q4. That run led straight into Bitcoin’s first run at $20,000.
Nobody is calling for a repeat. But the shape of the setup looks familiar. Two down quarters. Then a sharp reversal heading into year-end.
What’s Driving the Rally
Short sellers took the brunt of this move. Bitcoin shorts lost roughly $6.55 billion in August alone.
US spot Bitcoin ETFs added $1.92 billion in net inflows over the past week. That’s the strongest weekly haul since October 2025.
Some analysts point to the US Treasury’s move to double its long-dated bond buybacks as a key catalyst behind the broader risk-on shift.
Where Price Actually Sits
Bitcoin traded at $78,282.14 as of August 31, 2026 (11:00 UTC). That’s up 13.5% over 90 days, per CoinGecko.
The chart shows the real turning point. Price sat near $60,000 through late June.
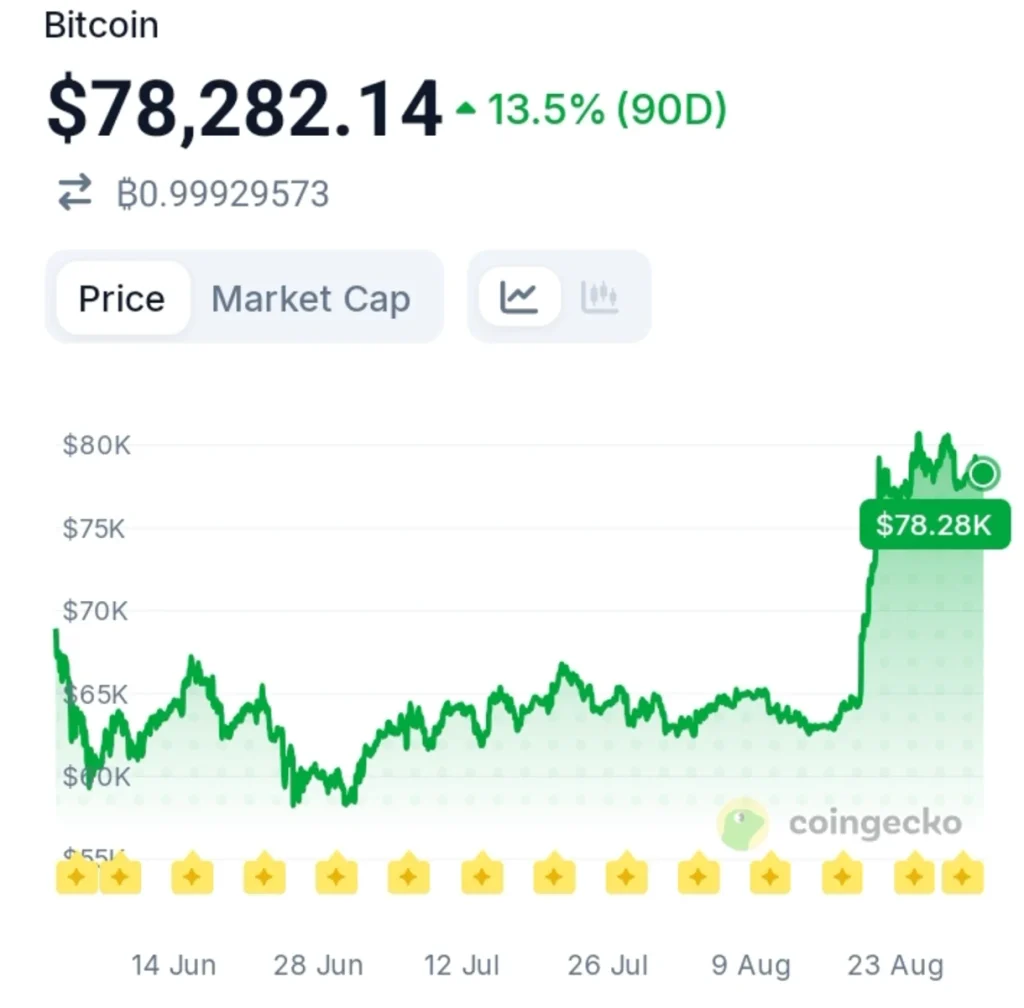
It chopped between $60,000 and $68,000 for most of July and early August. Then it broke sharply higher around August 21.
It has held between $75,000 and $80,000 ever since. This wasn’t a slow grind. It was a fast, decisive move.
The One Big Question for Q4
Techgaged tracked this exact reversal from the other side. In early June, Bitcoin cracked below $70,000 as ETF outflows and negative realized profit signals piled up.
A week before that, spot ETFs logged their darkest week yet, with $1.72 billion in outflows. That’s the exact bottom this rally climbed out of.
So the question for Q4 comes down to this: Does Bitcoin follow the 2017 script and keep accelerating, or does a quarter this strong simply borrow gains from the one ahead?
Two down quarters built real pessimism into positioning, and that pessimism is still unwinding.
That favors continuation over stall. But a rally this fast, this concentrated in one month, usually cools before it doubles down.
Watch the $75,000 level. Holding it through early Q4 would say the rally has real legs left. Losing it quickly would say August already did most of the work.
Disclaimer:
This article is for informational purposes only and does not constitute financial, investment, or trading advice. The views expressed are based on publicly available data, market observations, and the author’s interpretation at the time of writing. Cryptocurrency markets are highly volatile and unpredictable, and past performance or current technical setups do not guarantee future results. Readers should conduct their own research and consult with a qualified financial advisor before making any investment decisions. TechGaged does not accept liability for any losses incurred based on the information presented.
The post Bitcoin’s Historic August Leaves One Big Question for Q4 appeared first on TechGaged.com.
0
0

 Manage all your crypto, NFT and DeFi from one place
Securely connect the portfolio you’re using to start.


