Arbitrum price prediction 2024 – 2030: ARB breaks key barrier

0
0

Key takeaways:
- Our ARB predictions anticipate a high of $0.765 by the end of 2024.
- In 2025, it will range between $0.987 and $1.19, with an average price of $1.02.
- In 2030, it will range between $6.57 and $7.60, with an average price of $6.76.
Layer 2s have made quite a buzz over the last few months because of their high network activity. Arbitrum led the Layer 2 pack with a total value locked (TVL) of $2.888 billion. Arbitrum is an Optimistic Rollup solution that shifts network operations away from the Ethereum mainnet while maintaining Ethereum-level security.
Arbitrum’s BOLD testnet also went live; when integrated into the mainnet, the update will enable permissionless validation on Arbitrum. This means that anyone can challenge the state of the Arbitrum network. Currently, validators are allow-listed.
Is Arbitrum a good investment? Will it go up? Where will it be in 5 years? Let’s answer these questions and more in our Arbitrum price prediction.
Overview
| Cryptocurrency | Arbitrum |
| Ticker | ARB |
| Current price | 0.593 |
| Market cap | $1985,445,847 |
| Trading volume | $206,708,784 |
| Circulating supply | 3,339,278,542 |
| All-time high | $2.40 on Jan 12, 2024 |
| All-time low | $0.5773 on Jul 5, 2024 |
| 24-hour high | $0.6264 |
| 24-hour low | $0.5908 |
Arbitrum price prediction: Technical analysis
| Metric | Value |
| Volatility (30-day variation) | 6.53% |
| 50-day SMA | $0.7639 |
| 200-day SMA | $1.3334 |
| Sentiment | Bearish |
| Fear and greed index | 37 (Fear) |
| Green days | 13/30 (43%) |
Arbitrum price analysis: ARB breaks key support levels
Key takeaways:
- ARB is down nearly 17% since last week.
- It registers consecutive red candles, a signal for a bearish continuation over the next few days.
Arbitrum resumed its downward drive along with the broader market downturn. According to the latest market data, ARB is down nearly 17% since last week, putting more pressure on the bulls to slow the bearish tide.
ARB/USD 1-day chart analysis
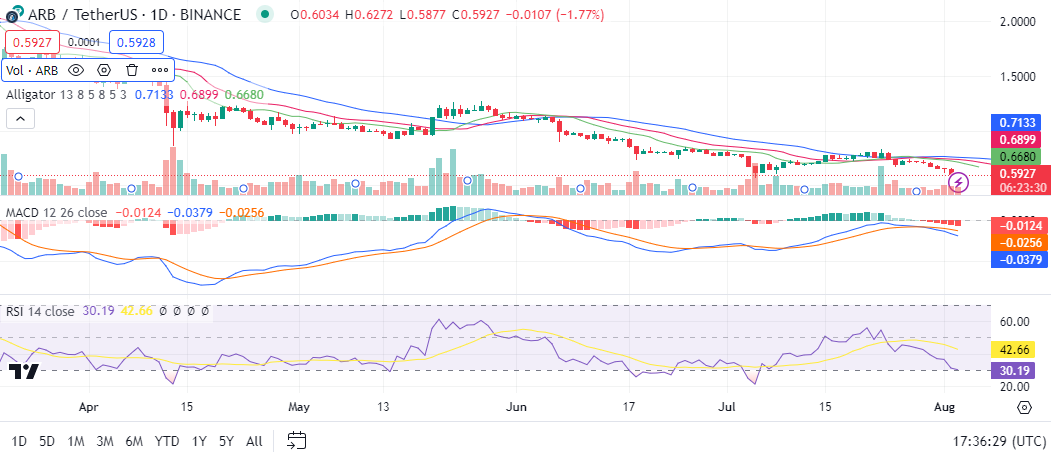
ARB price analysis for August 3. Arbitrum has maintained a constant bear run since March. So far, it has lost over half its value from the year’s high. Earlier this week, it made another bearish break out as it fell below the $0.63 support. It consistently registered red candles over the last four days, a signal for a bearish continuation over the next few days. The move didn’t go unnoticed, as the RSI now breaks into oversold territory as market sentiment turned fearful, forcing traders to sell their holdings.
ARB/USD 4-hour chart analysis
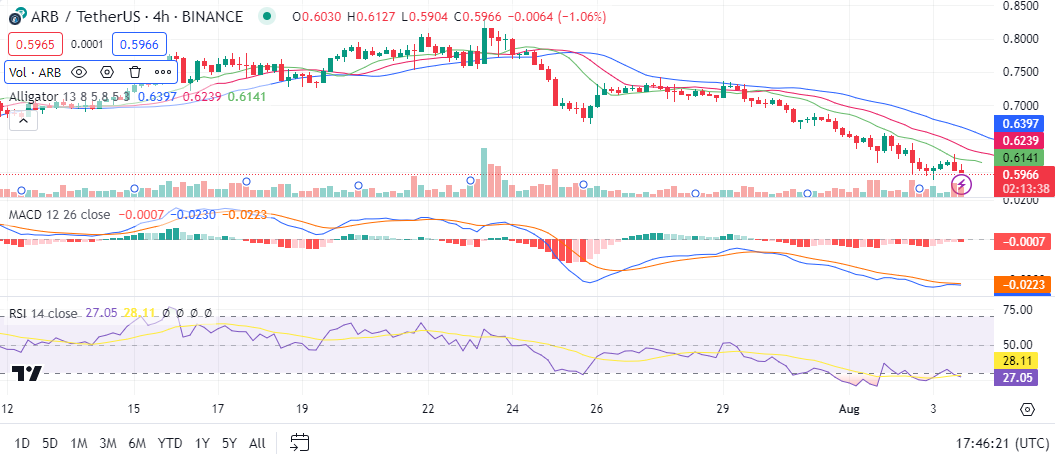
The 4-hour chart highlights Arbitrum’s decline this month. According to the analysis, ARB registered negative momentum over the last five days, with rising volatility, as shown by the William Alligator trendlines. The market action forced ARB into oversold territory with the relative strength index now at 26.28.
Arbitrum technical indicators: Levels and action
Daily simple moving average (SMA)
| Period | Value ($) | Action |
| SMA 3 | 0.6777 | SELL |
| SMA 5 | 0.6830 | SELL |
| SMA 10 | 0.7118 | SELL |
| SMA 21 | 0.7309 | SELL |
| SMA 50 | 0.7639 | SELL |
| SMA 100 | 0.9184 | SELL |
| SMA 200 | 1.3334 | SELL |
Daily exponential moving average (EMA)
| Period | Value ($) | Action |
| EMA 3 | 0.6992 | SELL |
| EMA 5 | 0.7099 | SELL |
| EMA 10 | 0.7243 | SELL |
| EMA 21 | 0.7374 | SELL |
| EMA 50 | 0.8025 | SELL |
| EMA 100 | 0.9477 | SELL |
| EMA 200 | 1.1157 | SELL |
What can we expect from ARB price analysis next?
Per our analysis, Arbitrum is bearish, with the Fear & Greed Index showing investors are fearful as it drops lower into oversold territory. The direction of the next breakout is potentially bullish; however, a lower breakout also remains plausible. Looking ahead, let’s explore the ARB price prediction from 2024 to 2030.
Is Arbitrum a good investment?
Arbitrum is a leading Layer 2 blockchain with an impressive TVL. The network also achieves development milestones, like quadrupling transactions after integrating EIP-4844, which cuts transaction costs by 90%. Despite a gloomy month, price predictions suggest a different narrative.
Why is Arbitrum down?
Arbitrum’s current drop is inconsistent with the network’s activity. This year’s drop in coin prices is consistent with the drop in crypto market valuation.
Will Arbitrum recover?
Arbitrum has formed a new ATL and indicates the potential to drop lower; despite this, network participation has remained consistently high, and as a result, Daily active addresses (DAA) have remained relatively high. This suggests AR will eventually recover. These indicators point to an eventual recovery.
Will Arbitrum reach $1?
Aribtrum’s 200-day SMA is above $1, meaning ARB is oversold and has the potential to rise above its value within the coming three months.
Will Arbitrum reach $10?
According to Cryptopolitan price predictions, it is unlikely that ARB will trade at $10 in the period ending in 2030.
Will Arbitrum reach $100?
According to Cryptopolitan price predictions, it is unlikely that ARB will trade at $100 in the period ending in 2030.
Does Arbitrum have a good long-term future?
A high adoption rate is crucial for any blockchain’s long-term success and sustainability. Arbitrum’s performance in this regard is a positive sign of its future performance despite the price declines.
Recent news
DuelNow, a decentralized sports betting market on Arbitrum, closed an $11 million funding round led by GEM Digital Limited. This makes it the latest in a string of venture investments in Web3 gambling amid surging activity on Polymarket, a crypto-betting platform on the Polygon blockchain network.
ARB price prediction August 2024
The Arbitrum price forecast in August is a maximum price of $0.765 and a minimum price of $0.584. The average price for the month will be $0.591.
| Month | Potential low ($) | Potential average ($) | Potential high ($) |
| August | 0.584 | 0.591 | 0.765 |
ARB price prediction 2024
For the second half of 2024, ARB’s price will range between $0.584 and $0.749. The average price for the period will be $0.718.
| Year | Potential low ($) | Potential average ($) | Potential high ($) |
| 2024 | 0.584 | 0.718 | 0.765 |
Arbitrum price predictions 2025-2030
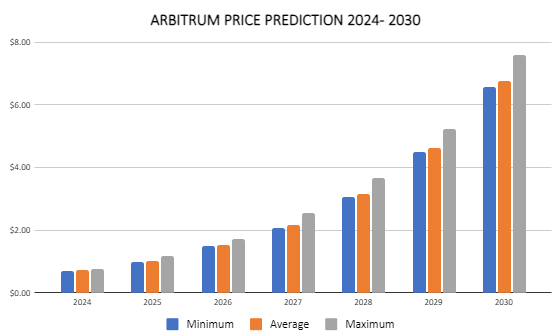
| Year | Potential low ($) | Potential average ($) | Potential high ($) |
| 2025 | 0.987 | 1.02 | 1.19 |
| 2026 | 1.48 | 1.53 | 1.72 |
| 2027 | 2.08 | 2.16 | 2.56 |
| 2028 | 3.06 | 3.17 | 3.67 |
| 2029 | 4.48 | 4.61 | 5.22 |
| 2030 | 6.57 | 6.76 | 7.60 |
Arbitrum price prediction 2025
The Arbitrum price forecast for 2025 is a high of $1.19. It will reach a minimum price of $0.987 and an average price of $1.02.
Arbitrum ARB price prediction 2026
The year 2026 will also be bullish. Our analysis estimates that it will range between $1.48 and $1.72, with an average price of $1.53.
Arbitrum price prediction 2027
Arbitrum’s price prediction climbs even higher into 2027. According to the prediction, ARB’s price will range between $2.08 and $2.56, with an average price of $2.16.
Arbitrum coin price prediction 2028
Our analysis indicates a further acceleration in ARB’s price. It will trade between $3.06 and $3.67 and an average price of $3.17.
Arbitrum price prediction 2029
According to the 2029 ARB price prediction, the price of ARB will range between $4.48 and $5.22, with an average price of $4.61.
ARB price prediction 2030
The ARB price prediction for 2030 indicates that the price will range between $6.57 and $7.60, with an average of $6.76.
ARB market price prediction: Analyst’s ARB price forecast
| Platform | Potential low ($) | Potential average ($) | Potential high ($) |
| Digitalcoinprice | 1.18 | 1.43 | 1.96 |
| Changelly | 2.19 | 1.18 | 1.74 |
| Gate.io | 0.61 | 0.64 | 0.79 |
Cryptopolitan’s ARB price prediction
Our predictions show that ARB will achieve a high of $0.749 in the second half of 2024. In 2025, it will range between $0.987 and $1.19, with an average of $1.02. In 2030, it will range between $6.57 and $7.60, with an average of $6.76. Note the predictions are not investment advice. Seek independent professional consultation or do your research.
Arbitrum historic price sentiment
- The Arbitrum airdrop snapshot occurred on Feb 6, 2023, and eligible participants started claiming on Mar 23, 2023. The claiming period ended on Sep 24, 2023.
- The airdrop granted 11.5% of the total supply to eligible users, 1.1% to DAOs operating in the Arbitrum ecosystems, and 44% to employees and Offchain Labs investors. The 44% is subject to lock-up periods and a vesting schedule. The rest was sent to the Arbitrum DAO treasury.
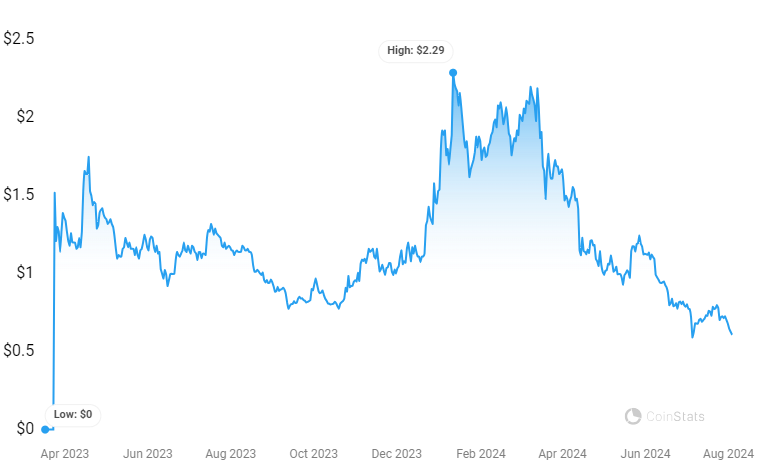
- On Sep 11, 2023, it fell to its all-time low at $0.7453.
- Bitcoin halving and crypto ETF hype helped the coin recover from October. By the end of the year, it had risen to $1.4.
- The run continued into 2024. On Jan 12, it reached its all-time high at $2.40.
- Per Coinmarketcap data, ARB broke below its listing price in June 2024.
- In July 2024, it registered a new all-time low of $0.5773.
0
0


 Manage all your crypto, NFT and DeFi from one place
Securely connect the portfolio you’re using to start.


0
0

