Mask Network Price Prediction 2025–2029: Will MASK Hit $3.90 Soon?
0
0

Mask Network (MASK) is under intense bearish pressure after a rapid sell-off triggered by an early June rejection from the $3.70 zone. The token has lost more than 30% in value since peaking earlier this month, erasing nearly all of its June gains.
After the sharp reversal, MASK is now trading around $1.84, just above a critical support zone at $1.82. Traders are closely monitoring this level, as a breakdown could expose the token to deeper losses toward previous consolidation areas.
The sell-off follows a blow-off top pattern after a parabolic rally that lifted MASK from April lows of $0.92 to a high of $3.69. However, the price failed to hold above key Fibonacci and structural levels, confirming the beginning of a broader correction phase.
Also Read: XRP Charts Mirror Tesla’s Breakout — Is a 3,500% Pump Coming Soon?
Technical Analysis
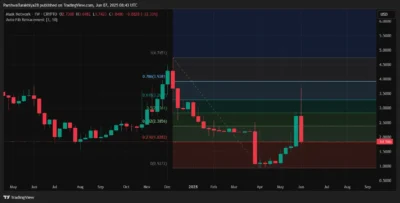
MASK climbed rapidly from May to early June and touched a high of $3.69 before getting rejected at the 61.8% Fibonacci level, which was $3.28. The cryptocurrency has now moved lower to the 23.6% Fib support near $1.82.

Source: Tradingview
The market broke down an ascending triangle pattern in late May during the 4-hour chart session. The breakout failed; there was a strong bearish engulfing candle, and the price fell below $2.70 while the highs kept forming lower each time.
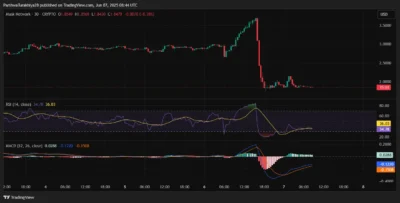
On the 4-hour and 30-minute charts, the RSI reads 34.7 and 36.0, respectively, meaning the bearish trend hasn’t ended yet. Another sign of weakness appears as the MACD changes, the histogram remains below zero, and momentum loses speed.

Source: Tradingview
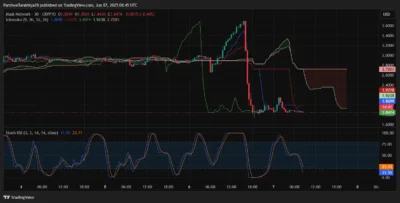
The price on the 30-minute chart is currently below the Ichimoku cloud, with prices also trading beneath the Tenkan-sen and Kijun-sen lines, indicating continued downside pressure in the market.

Source: Tradingview
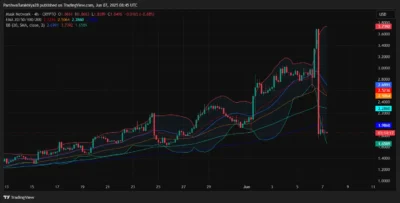
Markets are still heavily affected by higher volatility after experiencing a fast decline. Bollinger Bands on the 4-hour chart have opened up a lot, and right now, the price is below important exponential moving averages (EMA20, EMA50, EMA100, EMA200). Economic conditions could bring prices back down below $1.65 if support gets broken.

Source: Tradingview
MASK Price Prediction Table: 2025–2029
| Year | Minimum Price | Average Price | Maximum Price |
| 2025 | $1.28 | $1.96 | $2.38 |
| 2026 | $1.60 | $2.35 | $3.28 |
| 2027 | $1.88 | $2.75 | $3.90 |
| 2028 | $2.15 | $3.20 | $4.45 |
| 2029 | $2.50 | $3.65 | $5.10 |
Yearly Outlook
2025
Sellers have put much pressure on MASK because the price could not sustain its rise above critical levels of retracement. The break of $1.82 may bring prices closer to $1.60–$1.28. Recovery in the short term will happen if $2.12 is attained and the price starts to move over the old trendline.
2026
If MASK locates a base late in 2025 and regains investors’ trust, it may move toward the $3.28 barrier once more. An extended rise above the $2.38 Fibonacci level will prove that the trend is reversing more strongly.
2027
Working on Web3 privacy and decentralized applications may help recover from the crash. If the major cryptocurrencies recover, MASK might end up at around $2.75 and set its highest price at $3.90.
2028
Growing adoption and technical updates may support further upside. If user activity rises, the price can hold steady near $3.20 and rise further to $4.45.
2029
If the market continues to develop and more people use MASK, it could reach $5.10. Merchant’s advancement in creating new linkages and adopting new networks is likely to influence how the company is valued in the long run.
Conclusion
Mask Network is feeling the heat after a recent 30% price fall. The market’s price trend has been broken, and all indicators suggest that bears might now have the upper hand.
Should the support at $1.82 fail, then prices can head toward the $1.60–$1.28 area. If bulls are to stand firm again, MASK needs to move past $2.12 and keep above its resistance level. At this point, the main outlook is still cautious.
FAQs
1. Why is the Mask Network price falling today?
MASK broke below a key rising wedge and lost primary support levels after a failed rally, triggering high-volume selling pressure.
2. What support levels are critical right now?
Current support is at $1.82. If this level breaks, bears may target $1.60 and $1.28.
3. Are momentum indicators bearish?
RSI and MACD are both showing bearish conditions across multiple timeframes, confirming downward momentum.
4. What is needed for a recovery?
A reclaim of $2.12 with substantial volume is needed to reverse the short-term trend and push toward $2.38.
5. Can MASK reach $5.00 by 2029?
If adoption grows and the project continues expanding in the Web3 space, MASK could trade between $3.65 and $5.10 by 2029.
Also Read: SEC Nod Sparks Altcoin Boom as XRP, ADA, SOL, XLM Join Nasdaq Index
The post Mask Network Price Prediction 2025–2029: Will MASK Hit $3.90 Soon? appeared first on 36Crypto.
0
0
 Manage all your crypto, NFT and DeFi from one place
Securely connect the portfolio you’re using to start.


