SPX6900 Cools After Parabolic Rally, SPX Going Back To $1.77 ?

0
0
The post SPX6900 Cools After Parabolic Rally, SPX Going Back To $1.77 ? appeared first on Coinpedia Fintech News
- SPX Price rallied over 230% from May to mid-June, peaking just below its all-time high of $1.77.
- Open Interest surged to $171M before a sharp 25% decline, suggesting overleveraged longs were flushed.
- Spot outflows hit $6.4M on June 14, signaling strategic exits
SPX6900USD Technical Analysis: A Classic Parabolic Advance
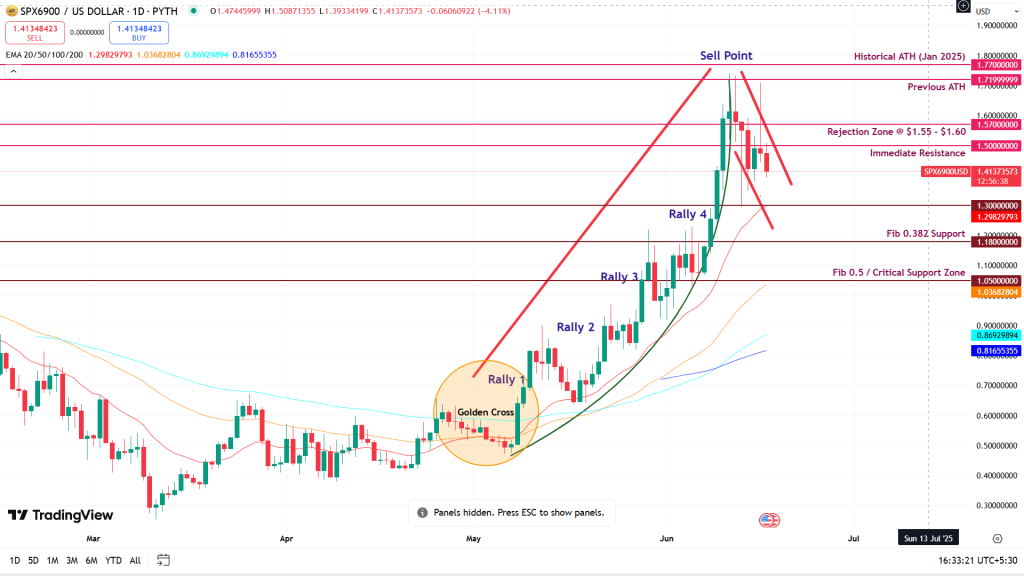
The rally was triggered by a golden cross on May 6, when the 50-day EMA crossed above the 200-day EMA—a bullish signal in technical analysis.
Following this crossover, SPX coin accelerated through successive resistance zones, kicking off a multi-leg parabolic advance.
SPX Price followed a textbook parabolic rally between May 7 and June 11, rallying from $0.50 to almost break its previous all-time high of $1.77 in just over a month. The move unfolded in four accelerating legs, each followed by shallow pullbacks.
This structure often signals a blow-off top or exhaustion phase, especially when volume and sentiment spike at the peak.
A temporary top formed on June 11 as the SPX price began to fade under $1.70. The correction intensified on June 14, driven by heavy profit-taking, and is now consolidating above key support at $1.30.
Indicators Point to Cool-Off, Not Collapse
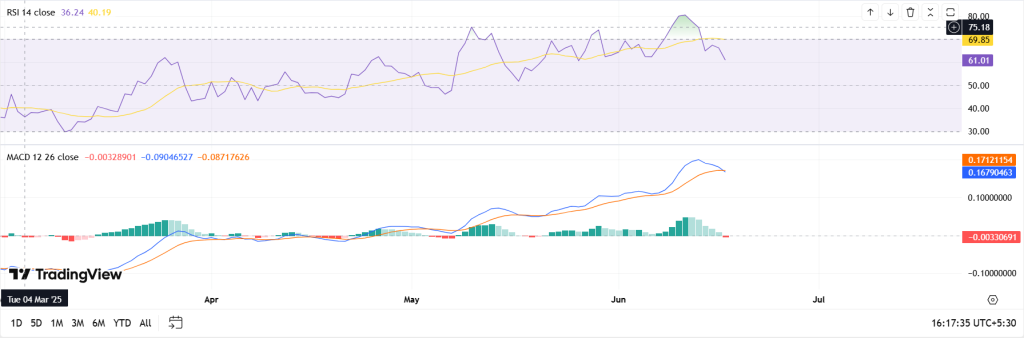
- RSI has dropped from 75 to 40.19, cooling from overbought territory.
- MACD shows a bearish crossover, confirming waning momentum.
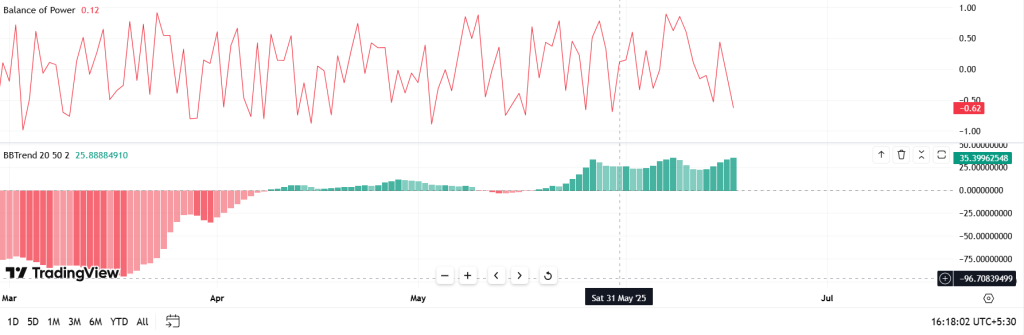
- Balance of Power is soft at 0.12, while BBTrend and BBP show weakening bullish energy.
The indicators align with a standard post-rally reset. A base is likely forming between $1.30–$1.35.
Derivatives Flash Warning: Open Interest Collapse, Sentiment Flip
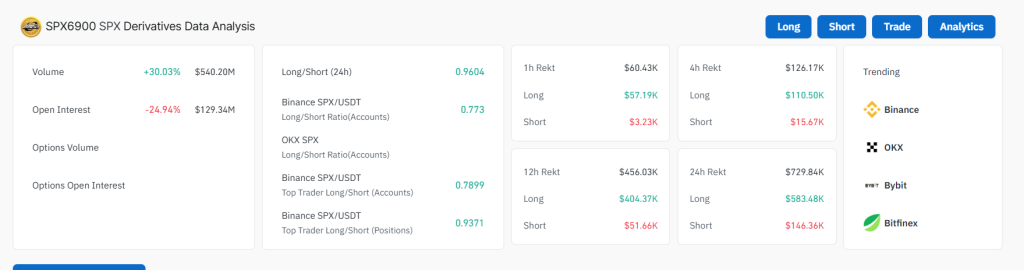
Open interest reached an ATH of $171.7M on June 13, but rapidly fell by 25% as the price retraced. At the same time, long/short ratios flipped bearish across major exchanges:
- Binance L/S (accounts): 0.773
- 24h Global L/S: 0.9604
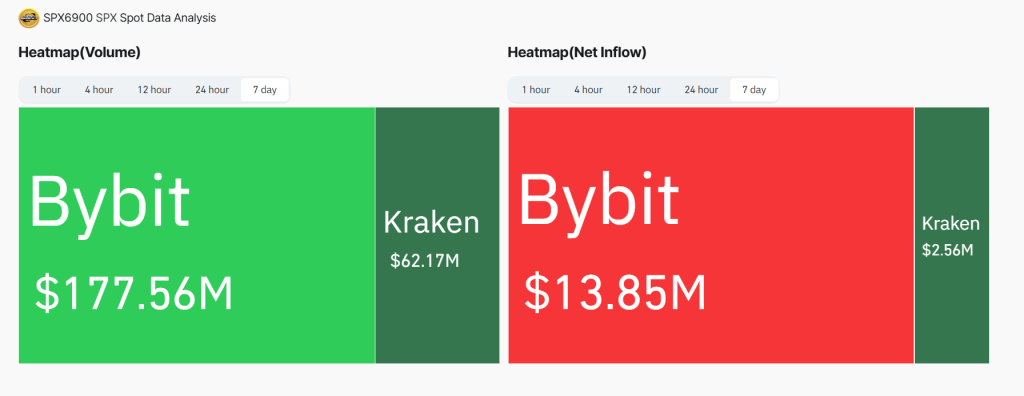
This shift indicates that traders began aggressively closing long positions or opening shorts as the rally lost momentum. Bybit, which led trading volume with $177M, also saw over $13M in net outflows.
Spot Flow Reversal Confirms Profit-Taking
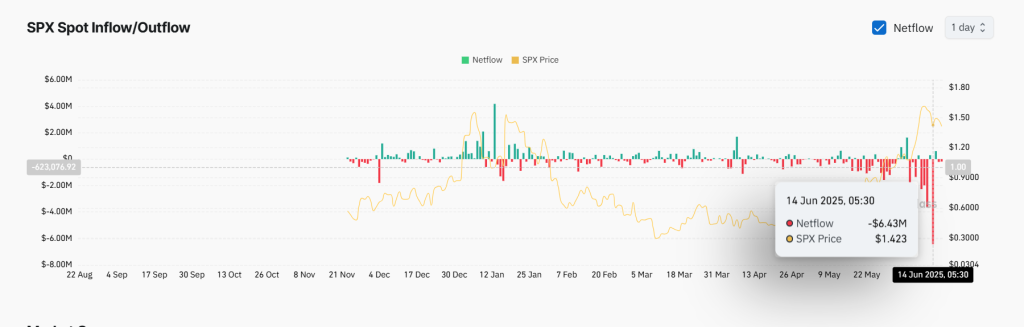
On-chain flows show over $6.4M in net outflows on June 14 alone, with additional daily exits continuing through June 17. Coinbase saw light inflows (~$367K), but Kraken and OKX recorded significant net exits, confirming that the move was not retail-driven accumulation but strategic unloading.
SPX6900 Price Prediction: Bounce or Breakdown?
SPX coin trades at $1.39. Holding $1.30 support could see price test $1.50 and potentially retarget the $1.71 ATH by late June. A breakout may push SPX toward $2.00.
If $1.30 fails, downside targets include $1.18 and $1.05 (Fib retracement levels).
For now, SPX shows signs of stabilizing. Traders should watch for volume return near $1.50 and RSI flattening to confirm bullish continuation.
SPX6900’s rally followed technical structure, and its cooldown reflects healthy market rotation. A breakout or breakdown in coming sessions will define the next meme cycle leg.
0
0


 Manage all your crypto, NFT and DeFi from one place
Securely connect the portfolio you’re using to start.

0
0

0
0

