Will Shiba Inu (SHIB) Overcome Its Current Downturn?
4d ago•

bullish:
1
bearish:
0
Share
- SHIB has declined by 9.90%, over the past week.
- The burn rate of SHIB is up by 482% in the last 24 hours amid a reduced rate.
Top meme coins in the market are priced in red. Among them, the dog-themed meme coin Shiba Inu (SHIB) has been seemingly in bearish mode for the past few days. In the last 24 hours, the meme token lost over 2.63% and trades within the $0.000017 range.
On the other hand, SHIB’s burn rate has been displaying reduced surges over the past several days. Increasing over 482% in the past 24 hours, approximately 60 million SHIB tokens have been burned as per data. To date, the Shiba Inu ecosystem has burned a total of 410,727,706,468,542 SHIB, leaving over 583.37 trillion SHIB left in circulation.
Recently, there has been misinformation about the upcoming token of the Shiba ecosystem, TREAT. Shiba Inu’s lead, Shytoshi Kusama, addressed the community regarding it on X. Kusama wrote, “Sadly @cryptocom wrote about our TREAT token that is not yet launched, assuming incorrectly that it was”.
Will SHIB Continue Underperforming?
Over the past month, SHIB has declined 3.57%. The highest and lowest price noted was at $0.000019 and $0.000013 respectively. In the past week, Shiba Inu’s price action showed a drop of 9.90%, from $0.00001981 to $0.00001695. At press time, the meme coin traded at $0.00001732, with a market cap of $10.20 billion. Meanwhile, the daily trading volume has dropped by 26.83% to $316 million, as per CoinMarketCap data.
The daily relative strength index (RSI) currently stands at 47.07, indicating that the asset is approaching the neutral zone. Meanwhile, the short-term 9-day moving average (9MA) is at $0.00001819, which stays above the price and the 21-day moving average (21MA) is at $0.00001709, seemingly below the price action. which suggests SHIB seems volatile in the market.
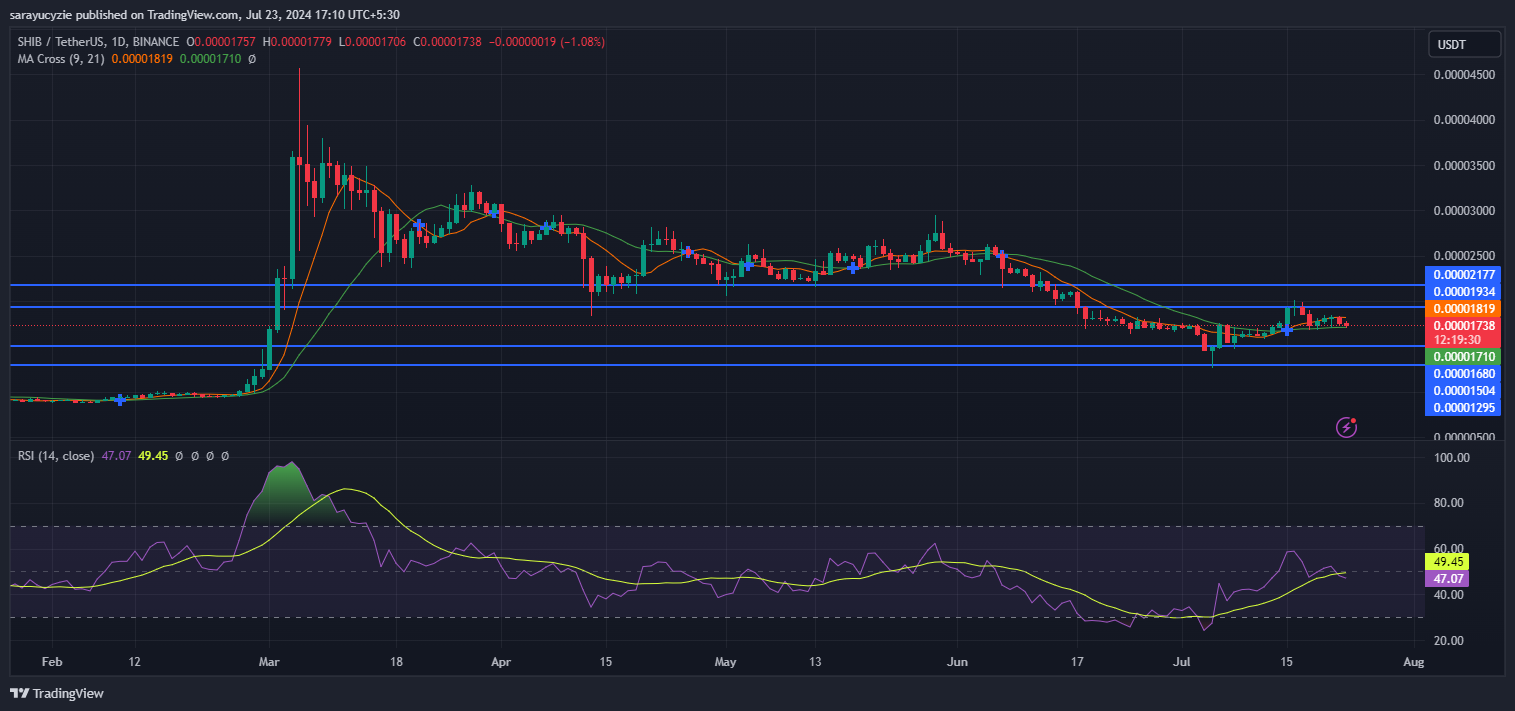
Shiba Inu’s 24-hour price action suggests that if the asset breaks the initial resistance at $0.00001934, it is expected to climb further to $0.00002177. In contrast, if SHIB fails to hold above the initial resistance, it might drop to $0.00001504. The potential dip of the Shiba Inu can be at $0.00001295.
Highlighted Crypto News
4d ago•
bullish:
1
bearish:
0
Share


 Manage all your crypto, NFT and DeFi from one place
Securely connect the portfolio you’re using to start.

bullish:
0
bearish:
0

bullish:
1
bearish:
0

