Will Bitcoin Attain a New ATH or Slip Below $100k in November

0
0

Bitcoin started October on a very high note, registering massive gains during the first few days. It quickly flipped September’s high on the first day, surging by over 4%.
However, the asset gradually lost momentum the next day but broke above $120k for the first time since August. The 1-day chart reveals that the upward momentum progressively reduced in the days that followed.
Nonetheless, prices slowly crept towards the previous all-time high and broke it. The apex coin registered a new ATH on Oct 6, surging from $123,519 to $126,272. Investors expected more, but selling pressure increased the next day, and the asset lost almost 3%.
Trading action on Oct 7 marked the beginning of a downtrend that ravaged BTC for most of the month. The biggest decline of the day happened on Oct 10 when the asset lost over 7% in a single day. It retraced from $121,695 to $109,683 before rebounding.
Although it saw notable buying pressure two days ago, the decline continued the next week. BTC revisited its lowest level since June, dropping to a low of $103,530. Although it rebounded and reignited calls of uptober, the current price suggests that the apex coin is edging closer to registering significant losses this month.
In summary, Bitcoin opened October at $114k but may end the session at $109k. The closing figure suggests a more than 4% decline, meaning uptober never happened.
Why Did Bitcoin Dip?
The downtrend began when Donald Trump hinted at imposing tariffs on China. The downtrend worsened after he made the formal announcement. Investors sold massively on the news, causing the stock to slip to June’s low.
Data from Sosovalue revealed that the US spot Bitcoin exchange-traded fund saw massive outflows in the days following the tariff announcement. However, this investment fund will conclude the session with a total net inflow of $3.61 billion, despite the price downtrend.
However, a previous outlook had suggested that such a massive decline would occur in October. It cited the weak spot volume as a reason for the conclusion and noted a decrease in highs on the 1-month scale as another factor.
Following the rebound, another analysis suggested that price action would support a range-bound movement for the rest of the session and hinted at a bearish close. This is unfolding at the time of writing, but investors remain puzzled as to why the bullish events of a few days ago failed to result in significant price hikes.
Nonetheless, a report blamed long-term holders for the decline. As a result, traders remain on edge about the next price action, with some expecting further retracement in November. Others remain optimistic about the coming month, calling for a surge to $130k.
What Does November Hold?
Bitcoin will start November with massive uncertainty, as traders remain undecided about the next price action. Historical data indicate that November is another bullish month. On average, the apex coin gains over 40%, making it the most profitable one for Bitcoin.
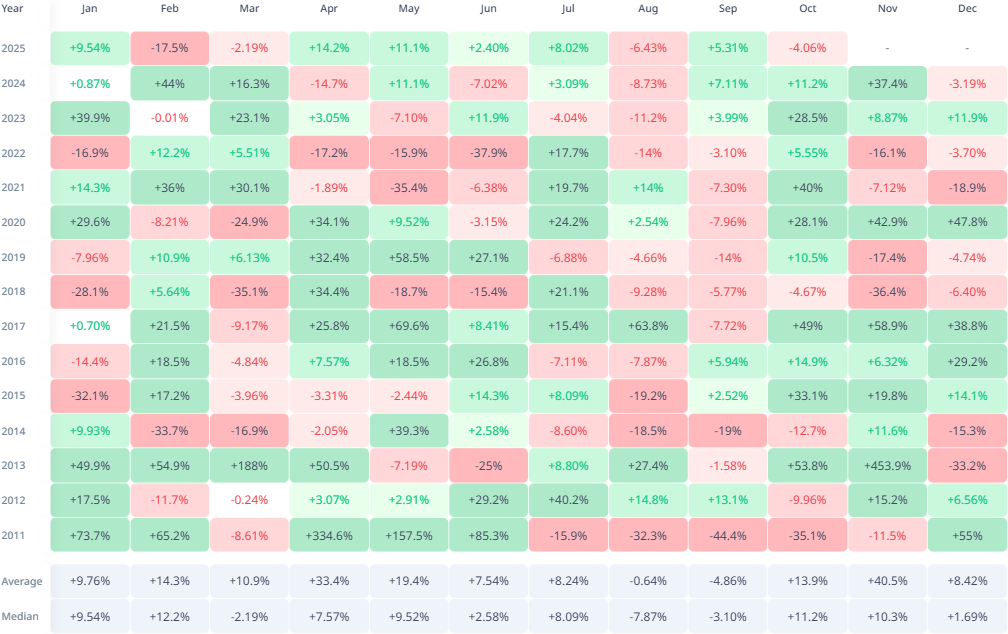
Bitcoin registered its highest gain in 2013, surging by over 435%. However, there are also periods when it registered significant losses. It posted its biggest decline of 36% in 2018. In total, the asset saw significant losses in five of the last fourteen years.
Matching price action between October and November shows no patterns. Nonetheless, the gains or losses in the tenth month were amplified the next month. For example, the last time BTC lost almost 5%, it retraced by over 36% in November.
However, there are several instances when prices went in opposite directions. In a nutshell, price actions in October barely detect what happens the next month. Nonetheless, considering that this is BTC’s most profitable month, there’s a high chance of significant increases.
Widening the scope reveals a possible pattern that may influence how prices unfold in the coming month. In three out of the last five bearish Q4s, October was bearish. If the trend repeats, the tenth month may be negative.
1-Day Chart Flashes Sell Signal
Bitcoin has been on the decline for most of the current week. The downtrend started after it peaked at $116,381, but lost momentum and dropped to a low of $106,303. It is edging closer to a green close on Friday.

Nonetheless, indicators are blaring warnings. The first to consider is the Bollinger band. It is worth noting that BTC has seen a significant decline in volatility since the start of the week, compared to two weeks ago. As a result, the bands are coming together.
Additionally, the asset is trading between the lower and the middle bands. When the asset trades within this region, concerns arise about potential further declines. In some instances, prices have retraced even lower.
The moving average convergence divergence is another indicator that raises concerns about the next price action. Its 12 EMA is in contact with the 26 EMA, and a bearish crossover is imminent, which may herald further decline.
The relative strength index is at 44, having recovered from 42 the previous day. However, there are fears of further decline, and most of the time, the RSI rebounds at 37.
All the listed indicators are currently negative, favouring a bearish start in November. If they play out, the apex coin will retrace even lower. It will break below the $106k support. Its next target may be $103k.
However, there’s no guarantee that the downtrend will end at this mark. A previous analysis noted that 50% of the selling pressure over the last few months came from long-term holders who held between 6 and 12 months. Their cost basis lies at $93k. BTC may drop to this level.
While the charts are currently bearish, fundamentals could alter these predictions. For example, the end of QT may happen on Dec 1. The market may experience notable price increases in the days leading up to this event.
The post Will Bitcoin Attain a New ATH or Slip Below $100k in November appeared first on CoinTab News.
0
0


 Manage all your crypto, NFT and DeFi from one place
Securely connect the portfolio you’re using to start.


