
Bitcoin Price Prediction: Options Hint At Quiet Sentiment Shift

0
0

Where is Bitcoin's price right now?
Bitcoin is trading close to $64,000 this week, holding steady after a rough June.
The coin is still down sharply from its October 2025 high near $126,000. But the last two weeks have looked calmer.
This Bitcoin price prediction looks at fresh options data, on-chain activity, and ETF flows to see what might come next.
What is the BTC options market saying?
Options traders are quietly turning more hopeful.
The put/call ratio, a gauge of how many traders are betting on price drops versus price gains, has dropped to a six-month low near 0.59.
That means call options, bets that price will rise, are far outweighing puts right now.
Glassnode's latest options report backs this up. The firm noted that volatility is easing, the put/call ratio is at its lowest point in six months, and upside exposure is rebuilding.
Falling volatility along with more call buying usually points to traders feeling less nervous about sudden price drops.
Are Bitcoin ETFs buying or selling?
ETF flows just flipped positive again.
After outflows through most of May and June, Bitcoin ETFs pulled in $273.07 million in net inflows over the past two weeks, according to flow trackers, as BTC reclaimed the $64,000 level.
ETF | Inflow Amount | Notes |
Fidelity FBTC | ~$166M | Led the early July reversal |
ARK 21Shares ARKB | ~$91.8M | Added to the rebound |
BlackRock IBIT | $138.9M | Part of a $181.1M single-day inflow |
Softer inflation data, easing Fed rate expectations, and more upbeat talk on crypto policy all seem to be nudging sidelined buyers back in.
What does the BTC monthly chart show?
Zooming out, the monthly chart tells a longer story.
Bitcoin ran from under $1,000 in 2018 to a peak above $125,000 in late 2025. Since then, it has pulled back hard, trading down around 44% to 46% from that high during the recent slide.
The chart also flags past cycle patterns, including a roughly 77% drawdown period in 2022 and a smaller pullback near 68% in 2018, both of which came before major recoveries.
Is old Bitcoin moving again, and does that matter?
Yes, and history says pay attention.
As per Ali's tweet, A wave of dormant Bitcoin that hadn't moved in a long time shifted on-chain over a recent 24-hour window. Spikes like this in "coin age consumed" have often shown up right before big market moves, in either direction.
This doesn't tell traders which way the move will go. It's more of a warning that something is stirring beneath the surface.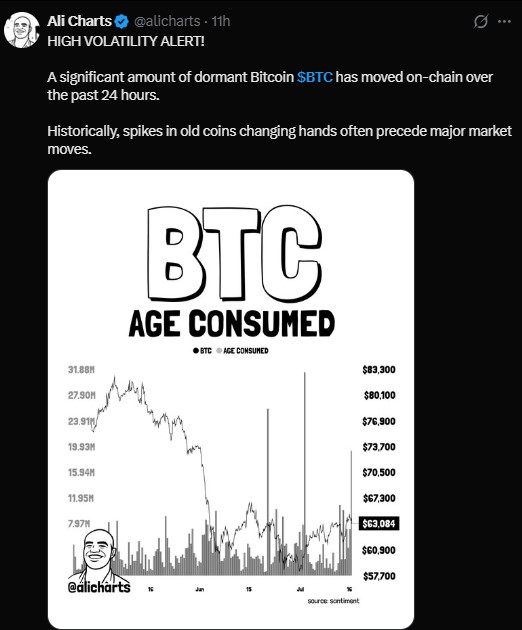
What is CVDD and why does it matter for a bottom?
CVDD stands for Cumulative Value Days Destroyed, an on-chain tool some analysts use to spot cycle bottoms.
Bitcoin has never bottomed without first trading below its CVDD price. That level currently sits near $47,453.
If BTC were to fall to that line, it would suggest even long-term holders are starting to give up and sell, something that has marked capitulation points in past cycles.
How much money got liquidated in the futures market recently?
A lot.
CoinGlass data shows that in a recent 24-hour stretch, 95,388 traders were liquidated, with total liquidations reaching $295.14 million.
The single biggest liquidation order hit on Binance, an ETHUSDT position worth $7.78 million.
Separate derivatives data on BTC itself showed open interest near $47.55 billion and options open interest around $31.43 billion, both ticking higher.
Long and short liquidations were roughly balanced over the past hour, though shorts took a bigger hit over the past 12 and 24 hours.
Timeframe | Long Liquidations | Short Liquidations |
1 hour | $11.01K | $60.18K |
4 hours | $16.67K | $107.12K |
12 hours | $1.45M | $10.27M |
24 hours | $43.22M | $29.44M |
Heavy short liquidations during a bounce often mean short sellers got caught off guard as price pushed higher.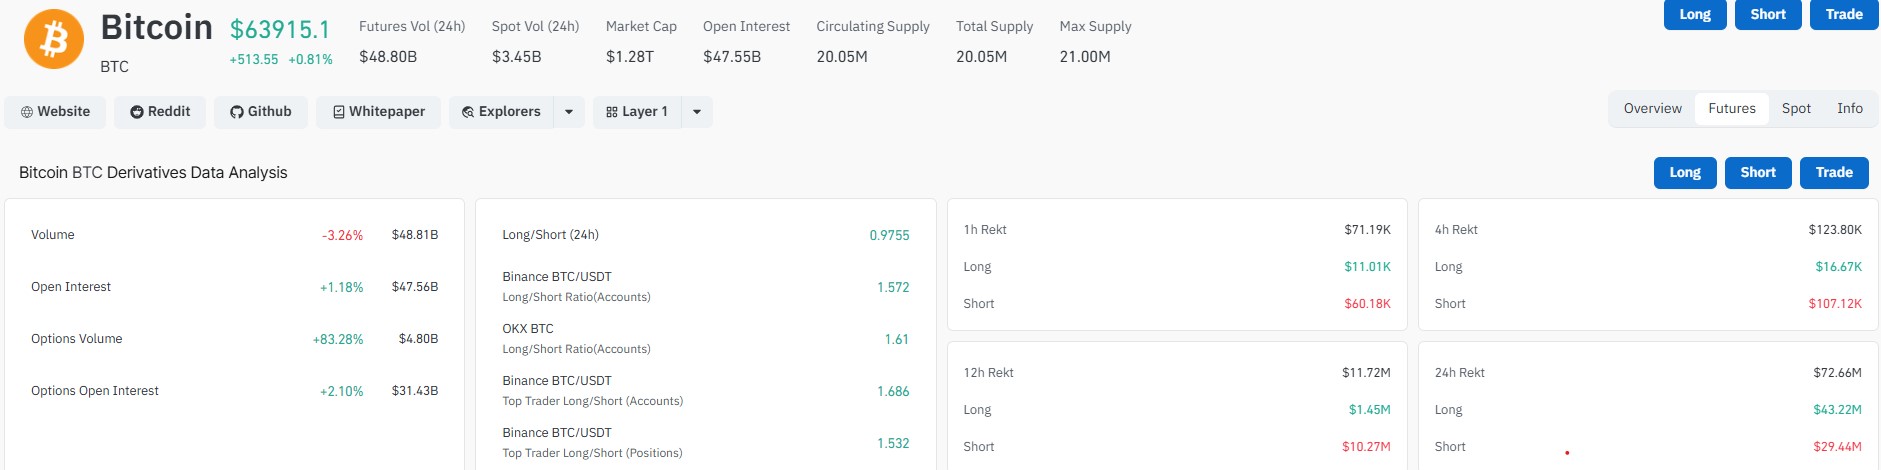
When might Bitcoin actually bottom?
There's a rough pattern worth noting, though it's far from a guarantee.
Historically, Bitcoin has bottomed roughly 12 months after each major cycle top. The last major top came in October 2025 near $126,000.
If that same spacing holds this time, the next bottom could form somewhere around October 2026. This is an open-ended observation based on past cycles, not a fixed rule, and past patterns don't always repeat.
Bitcoin Price Prediction: What To Watch Next
Putting it together, a few signals are lining up in a more constructive direction: falling options volatility, a lower put/call ratio, returning ETF inflows, and dormant coins on the move.
At the same time, on-chain data flags $47,453 as a level where long-term holder capitulation would become more likely, and the historical bottom pattern points toward October as a rough window to watch.
None of this guarantees where Bitcoin price heads next. Traders will likely keep an eye on ETF flow data, the put/call ratio, and whether BTC can hold above $64,000 in the days ahead.
Disclaimer
This article is for informational purposes only and does not constitute financial, investment, or trading advice. Cryptocurrency markets are highly volatile and involve significant risk. Past performance and historical patterns do not guarantee future results. Always do your own research and consult a licensed financial advisor before making any investment decisions.
0
0

 Manage all your crypto, NFT and DeFi from one place
Securely connect the portfolio you’re using to start.

0
0

0
0

