Dogecoin Price Pattern Signals 30% Breakout: Is $0.30 Next for $DOGE?
0
0

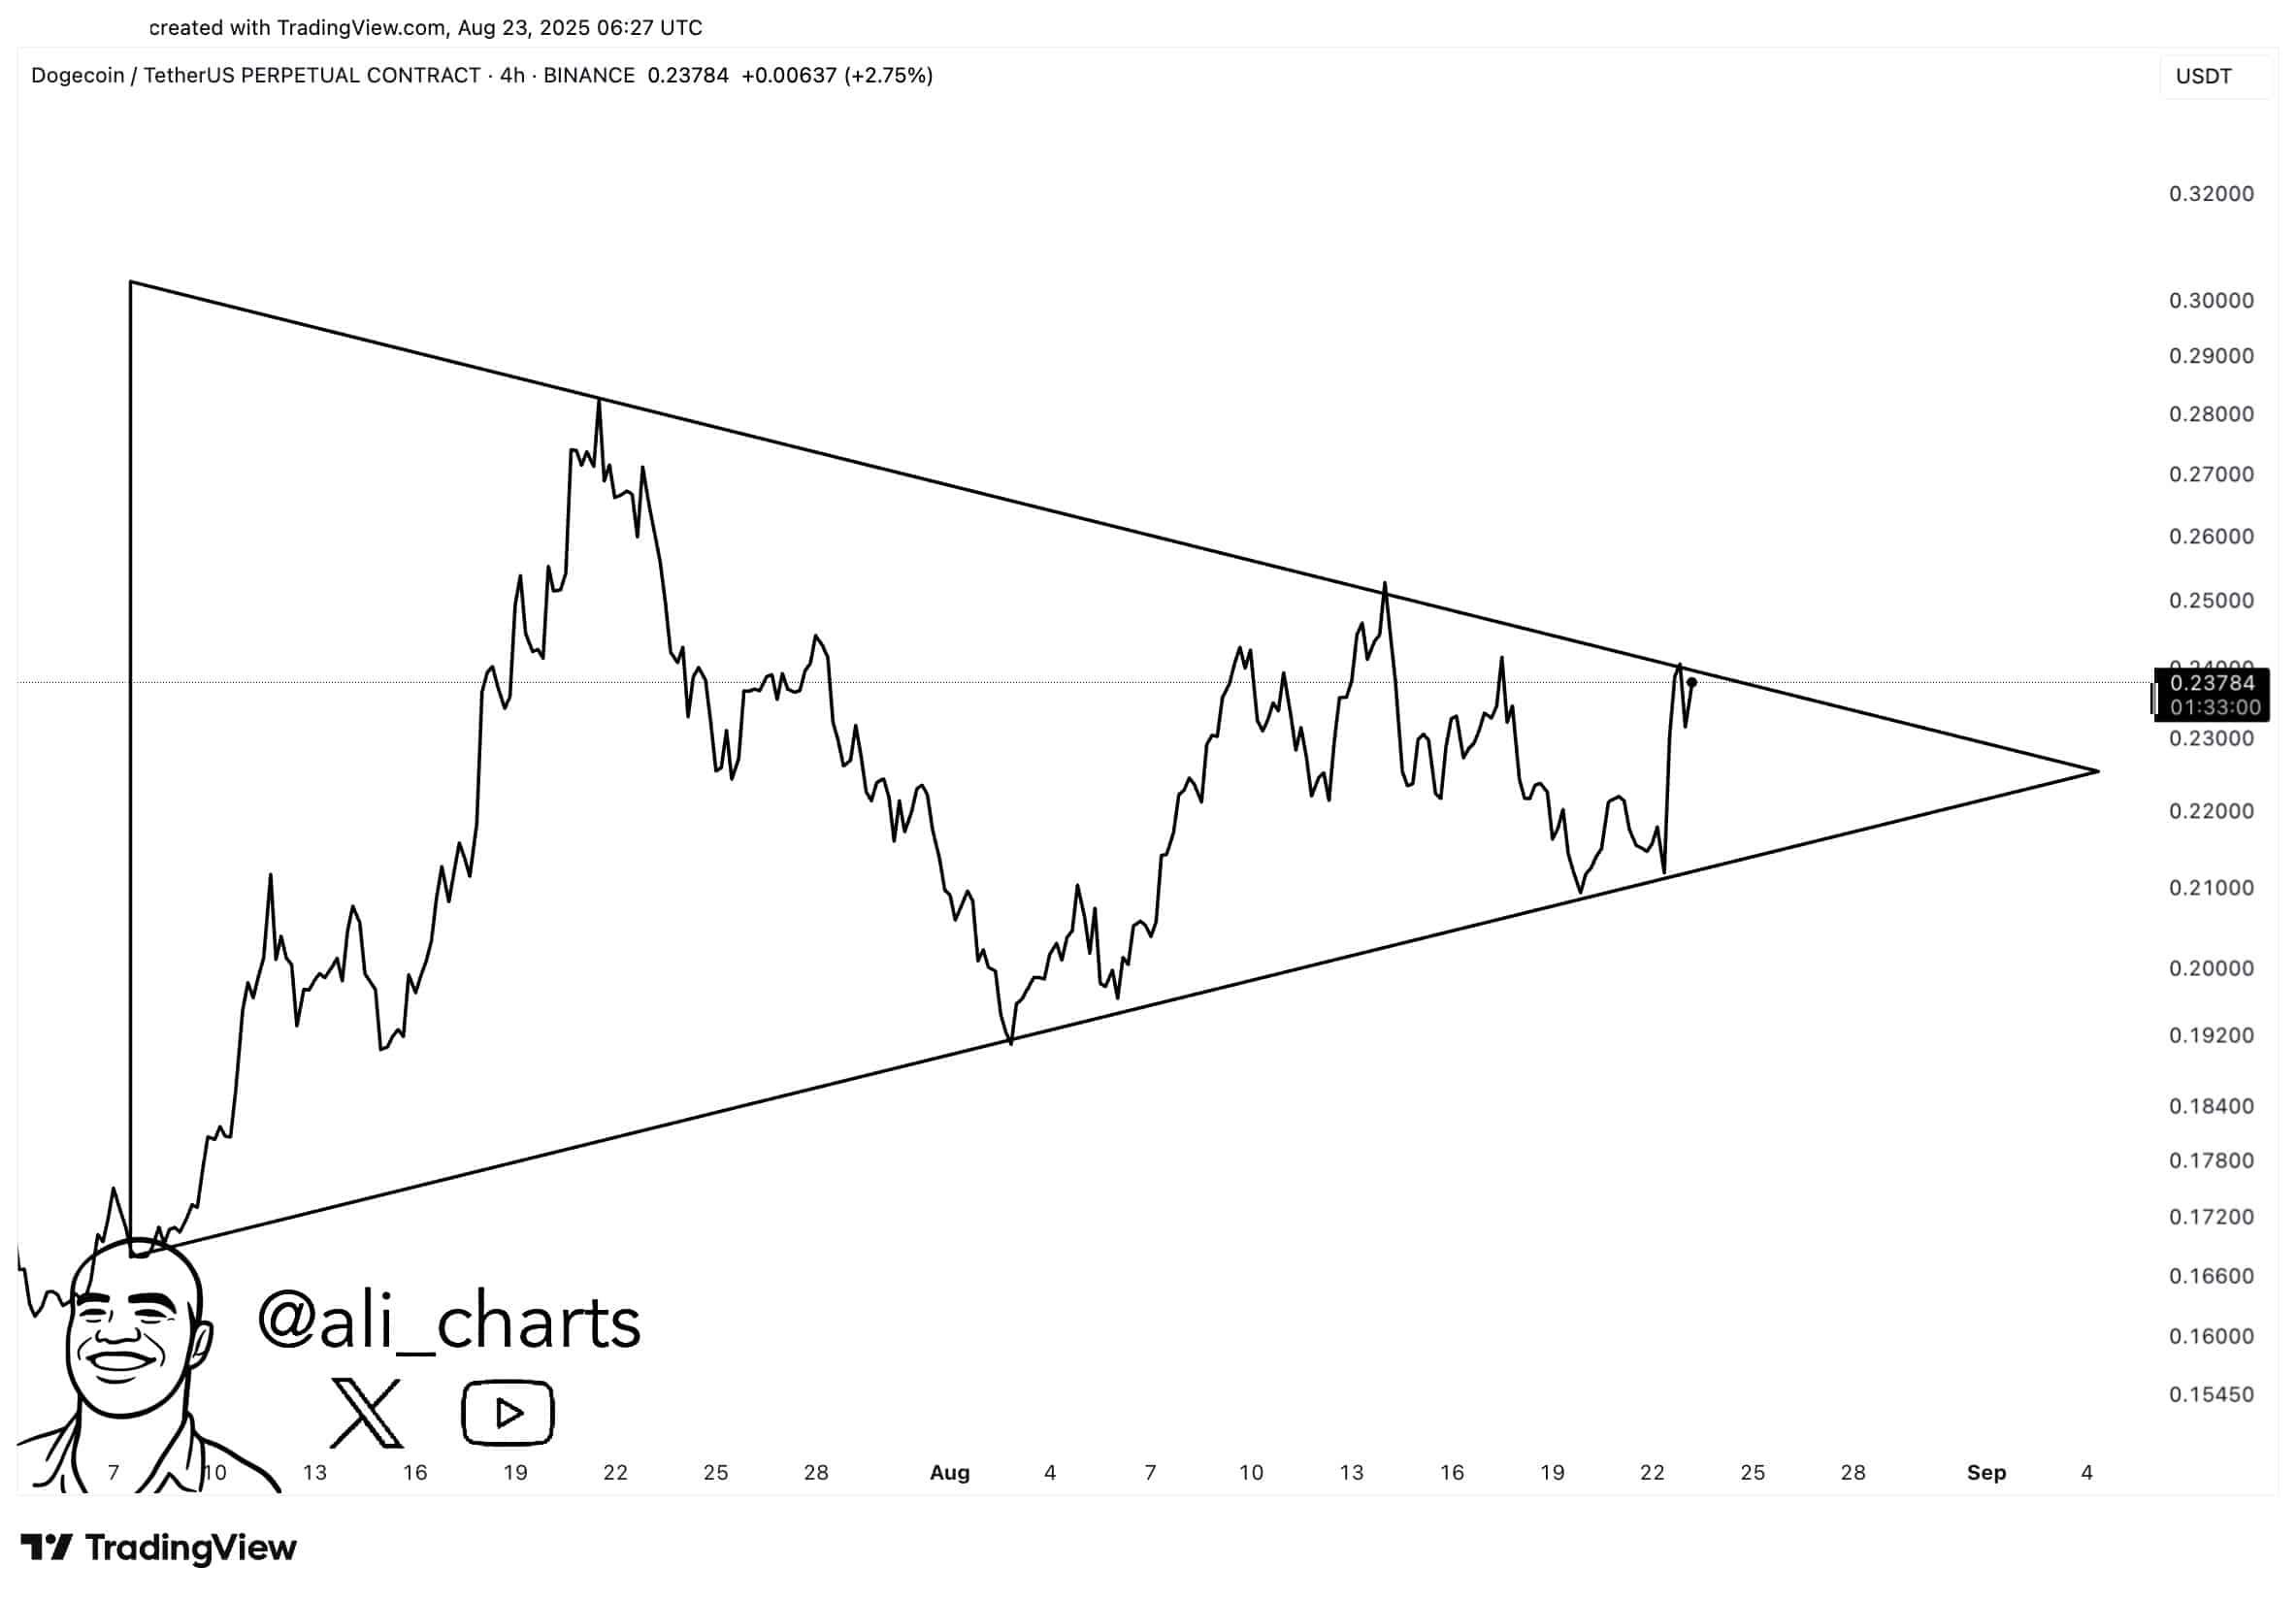
Dogecoin price has been volatile lately, dropping from $0.24 to $0.21 before briefly bouncing back after Fed Chair Powell’s speech at Jackson Hole. In the midst of this movement, crypto analyst Ali Martinez spotted a symmetrical triangle forming on $DOGE’s 4-hour chart. In previous times, this pattern is a continuation signal, suggesting Dogecoin price outlook could be bullish. If the pattern confirms, Martinez expects a 30% rally to $0.30.
Chart Patterns Suggest Next Leg in Dogecoin’s Rally
The symmetrical triangle on $DOGE’s 4-hour chart is defined by a descending top trendline and an ascending bottom trendline. Prices tend to compress within this triangle and a breakout above the upper trendline usually means continuation of the previous uptrend.
Martinez expects just that; a move to $0.30 if the price closes above the trendline for at least 2 candles.

Expert Forecasts for Dogecoin Price Outlook
| Source | Prediction | Analysis |
| Watcher Guru | $0.2608 target by late August | Neutral sentiment |
| CoinCodex | Breakout to $0.258 by early September | Wedge breakout; bullish technical indicators. |
| DigitalCoinPrice | Range of $0.46 to $0.50 for 2025 | Longer-term forecast citing 209.8% upside by 2027. |
| TechBullion | $0.25–$0.30 in August 2025 | Median price range based on broader market momentum. |
| LeveX | Conservative price range $0.22–$1.07 in 2025 | Models vary from moderate to ultra-bullish, driven by utility and sentiment. |
Bull, Base, and Bear Cases for Dogecoin Price Outlook
In the Bull Case, If $DOGE breaks above the triangle, it could go to $0.30 and potentially $0.42 if the broader market is strong. Institutional ETF movements and new sentiment could fuel that move.
In the Base Case, $DOGE will trade between $0.24 and $0.26 for the next few weeks and maintain the symmetrical structure without a big breakout or breakdown.
In the Bear Case, If the triangle breaks down or a macro market shift hits risk assets, $DOGE could go back to $0.20 or lower. Fear & Greed Index and fading retail interest could deepen corrections.
What’s Driving $DOGE’s Price Outlook
Analysts tie Dogecoin’s potential to broader crypto momentum, especially from Bitcoin and Ethereum, as well as technical patterns. A breakout from the symmetrical triangle could attract speculative capital, while tools like Fear & Greed Index and smoothed technical indicators suggest sentiment is neutral to bullish.
Ali Martinez’s “double bottom” forecast adds another layer, Dogecoin could go as high as $0.42 before September.

Conclusion
Dogecoin price outlook seems bullish but traders and investors are advised to be cautious, the symmetrical triangle is in line with the forecast but confirmation of the breakout and broader crypto trends will be essential to see if $DOGE will go up or not.
Stay up to date with expert analysis and price predictions by visiting our crypto news platform.
Summary
Dogecoin’s price is looking good as a symmetrical triangle forms on the 4-hour chart, which often precedes continuation moves. Ali Martinez thinks $DOGE will rally 30% to $0.30 if it breaks the upper trendline and holds. Expert predictions vary: some say $DOGE will hit $0.26 by early September, others $0.50 by year-end.
FAQs
What is a symmetrical triangle?
A chart pattern where price converges between descending highs and ascending lows. Breakouts often follow the direction of the initial trend.
Why is $0.30 the target?
The target is the height of the triangle added to the breakout point; following Ali Martinez’s technical modeling. Breakout confirmation awaited via closing candles above the trendline.
How does Bitcoin/Ethereum affect DOGE?
Dogecoin often follows broader crypto moves, benefits from bullish momentum from BTC and ETH.
What other analysts are saying?
Watcher Guru calls for 16.6% to $0.2608 by end of August. DigitalCoinPrice expects year-end to $0.50. Some even $1 in bullish cases.
Glossary
Symmetrical triangle – A chart pattern where trendlines converge, signaling consolidation and likely breakout.
Breakout confirmation – Waiting for price to close above the pattern’s boundary before assuming a trend change.
Fear & Greed Index – A sentiment indicator that measures market mood; higher values mean greed buying.
Sources
Read More: Dogecoin Price Pattern Signals 30% Breakout: Is $0.30 Next for $DOGE?">Dogecoin Price Pattern Signals 30% Breakout: Is $0.30 Next for $DOGE?
0
0
 Manage all your crypto, NFT and DeFi from one place
Securely connect the portfolio you’re using to start.


