
Chainlink Price Prediction: LINK Eyes $27 as ETF Inflows Rise

0
0

Chainlink just delivered one of its most aggressive daily moves in months, and the Chainlink price prediction outlook is now firmly centered on whether that strength can hold.
With fresh Grayscale buying hitting the wires the same morning, LINK is drawing attention from both chart watchers and ETF flow trackers at the same time.
The levels below come from the daily timeframe and should be rechecked if the price closes meaningfully outside the stated range.
Table of Contents
LINK Price Right Now
Grayscale Buys Another $1.53M in LINK
LINK Spot ETF Inflow Data
LINK Liquidation Data Today
Chainlink Trend and Momentum: Key Takeaways
LINK Price Prediction: Daily Chart Analysis
Technical Outlook Snapshot
Support and Resistance Levels to Watch
Risk-Reward Table
Invalidation Level
How Bitcoin Could Influence LINK
Planned Update
Glossary
CoinGabbar's Technical Analyst View
Disclaimer
LINK Price Right Now
Metric | Value |
CMP (LINK/USDT Perpetual) | $11.652 |
24h Change | +14.32% |
Market Cap | $9.39B |
Futures Volume (24h) | $1.30B |
Spot Volume (24h) | $276.79M |
Open Interest | $753.47M |
Circulating Supply | 748.09M LINK |
Total Supply | 1.00B LINK |
Max Supply | 1.00B LINK |
Open interest of $753.47M against a $9.39B market cap shows a meaningful amount of leverage has built up around this move, which lines up with how one-sided the liquidation data below looks.
Futures volume of $1.30B running well ahead of spot volume of $276.79M also points to derivatives traders driving most of the recent action.
Chart source: TradingView, LINKUSDT Perpetual Contract, 1-Day timeframe, Bybit, captured August 22, 2026, 10:47 AM IST. Data source: CoinGlass, captured August 22, 2026.
Methodology and Data Sources
This Chainlink price outlook is built strictly from the daily LINK/USDT perpetual chart on Bybit and the swing high and swing low levels marked directly on that chart, combined with CoinGlass market data, CoinGlass liquidation data, and LINK spot ETF flow data.
No external analyst targets are used anywhere in this piece.
Grayscale Buys Another $1.53M in LINK
Fresh ETF-side buying is adding weight to the LINK coin price prediction picture this morning.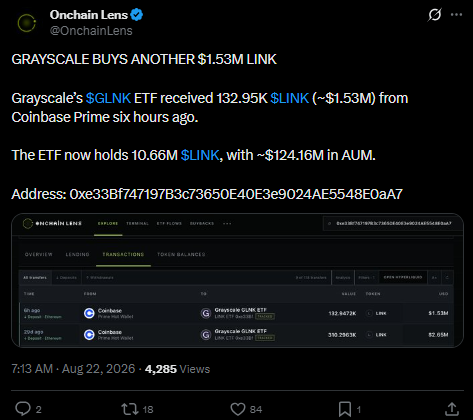
According to OnchainLens, Grayscale's GLNK ETF received 132.95K LINK, worth roughly $1.53M, from Coinbase Prime six hours before the tweet was posted. The ETF now holds 10.66M LINK in total, with about $124.16M in assets under management.
Source: OnchainLens (X/Twitter), August 22, 2026, 7:13 AM.
Every single day in this stretch shows positive net inflows, and the daily figure has been climbing, from $1.47M on August 14 to $5.16M on August 21.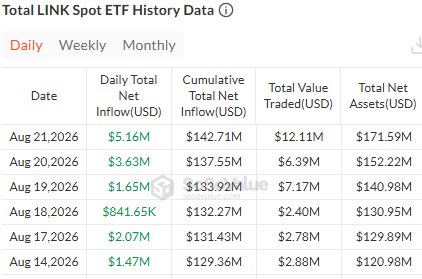
That kind of steady, accelerating ETF demand alongside the technical breakout is a combination worth tracking closely.
Source: SoSoValue ETF data, captured August 22, 2026.
LINK Liquidation Data Today
Short-side liquidations are dominating every single window here, running many times higher than long-side wipeouts across the 1h, 4h, 12h, and 24h periods.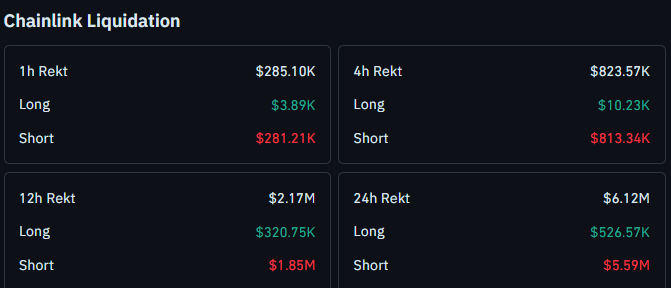
That pattern shows traders positioned against the move getting squeezed out as price pushed higher, which matches the aggressive breakout candle on the chart.
Source: CoinGlass liquidation data, captured August 22, 2026.
Chainlink Trend and Momentum: Key Takeaways
LINK is on its first retest of a daily ascending trendline after an aggressive breakout move
A direct continuation of higher targets: $14.992, then $20.757, then $27.882 as the next resistance levels
A pullback would likely find support near $10.862, the recent swing high now acting as support, or at the trendline itself
All support and resistance levels referenced here are swing highs and swing lows marked directly on the chart
Grayscale added another $1.53M in LINK to its GLNK ETF, and daily ETF inflows have been positive and rising for over a week straight
Short-side liquidations are heavily outweighing long-side liquidations at every timeframe
This is a leveraged, fast-moving setup. Levels can be invalidated quickly if broader market conditions shift, so these are reference points, not guarantees.
LINK Price Prediction: Daily Chart Analysis
LINK has just made its first retest of the ascending trendline it has been building since around June, and it did so with a genuinely aggressive move rather than a slow grind.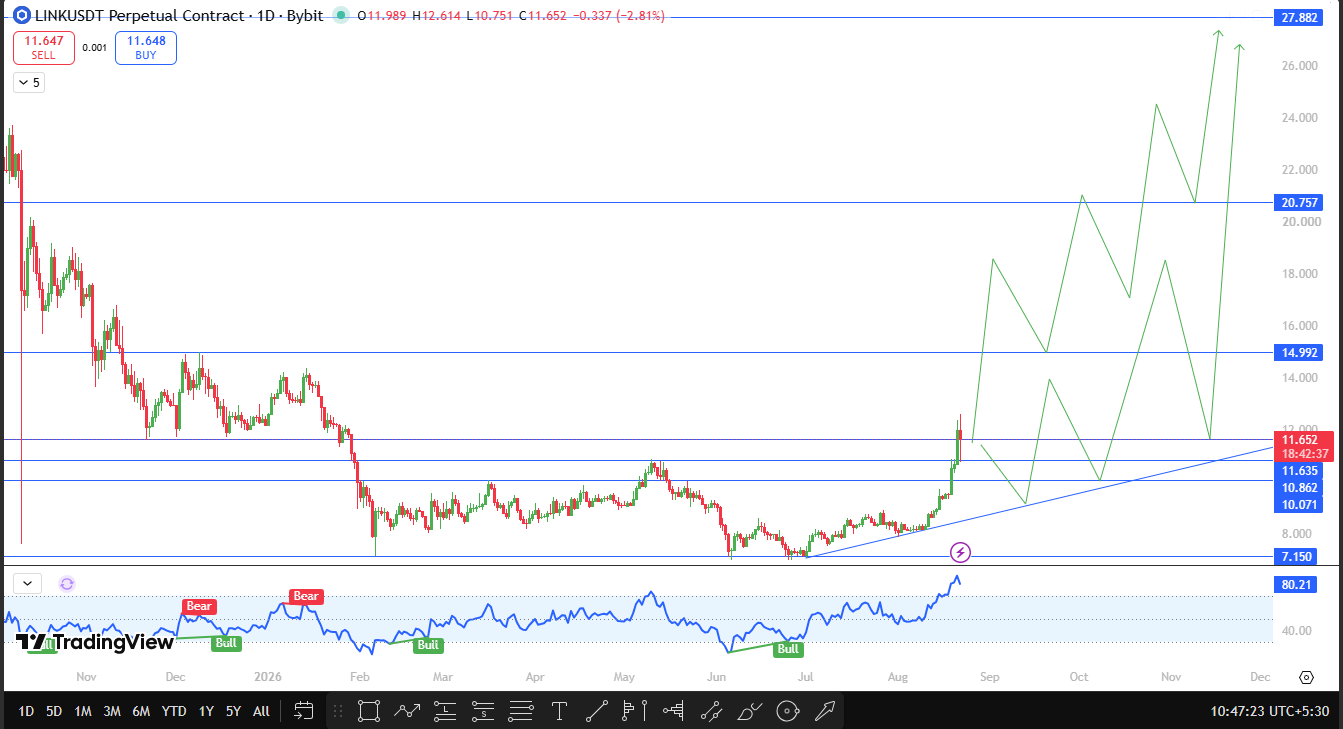
That kind of retest, where price snaps back toward the trendline with force rather than drifting into it, is generally read as a sign the underlying trend has strength behind it.
If price continues directly from here without much of a pullback, the next levels in view are $14.992, followed by $20.757, and then $27.882 further out. These are the swing high levels visible on the chart, not projected or calculated targets.
If instead LINK pulls back a little before continuing, the recent swing high around $10.862 becomes the level to watch, since a broken swing high often acts as support once price has moved back above it.
There is also a scenario where price retests the ascending trendline itself, which would carry the same significance as testing that support zone, since the trendline and the $10.862 area are tracking closely together right now.
The one condition that changes this outlook is a break and close below the trendline followed by continued downside.
As long as that does not happen, the structure here stays bullish, whether LINK runs straight up or takes the slower route through a pullback first.
Technical Outlook Snapshot
Indicator | Reading | Signal |
Price Structure | First retest of ascending trendline, aggressive move | Bullish |
Momentum Oscillator (TradingView Bull/Bear tag) | 80.21, tagged Bull | Bullish |
Short-Side Liquidations (24h) | $5.59M vs. $526.57K long side | Confirms squeeze higher |
ETF Flows (7-day trend) | Positive and accelerating | Bullish |
Immediate Support | Trendline / $10.862 zone | Key zone to hold |
Support and Resistance Levels to Watch
Type | Level | Note | % From CMP |
Resistance | $27.882 | Swing high level | +139.31% |
Resistance | $20.757 | Swing high level | +78.13% |
Resistance | $14.992 | Swing high level | +28.66% |
Resistance | $11.635 | Nearby swing level | -0.15% |
Current Price | $11.652 | CMP | 0% |
Support | $10.862 | Recent swing high, now acting as support | -6.78% |
Support | $10.071 | Swing low level | -13.56% |
Support | Trendline | Dynamic support tracks with the $10.862 zone. | Varies |
Support | $7.150 | Deeper swing, low level | -38.62% |
Risk-Reward Table
Case | Trigger | Target |
Bull Case | Direct continuation from current levels | $14.992, then $20.757, then $27.882 |
Base Case | Pull back and hold at $10.862 or the trendline. | Resumption toward the same resistance levels |
Bear Case | Break and close below the trendline with continued fall. | Move toward $10.071, then $7.150. |
Setup Invalidation | Sustained close below the trendline with further downside | Bullish structure invalidated |
Invalidation Level
The bullish view here holds as long as LINK stays above its ascending trendline.
Only if the price breaks below the trendline on a closing basis and then continues falling does the bullish structure get invalidated, at which point the swing low levels at $10.071 and then $7.150 come back into focus as downside references.
How Bitcoin Could Influence LINK
With open interest already elevated on LINK, Bitcoin's own trend matters more than usual here.
A steady or rising Bitcoin tends to give altcoins room to test resistance levels like $14.992 and beyond, while a sharp Bitcoin drop can trigger fast unwinds on heavily leveraged pairs regardless of how strong the individual chart structure looks.
Planned Update
This piece will be revisited if LINK closes a daily candle above $14.992 or breaks and closes below its ascending trendline with continued downside, whichever comes first.
Glossary
CMP: Current market price, the live trading price at the time of publication
Ascending Trendline: A rising support line connecting a series of higher lows, used to track an uptrend's structure
Open Interest: The total value of outstanding, unsettled derivative contracts on an asset
Swing High / Swing Low: A local peak or trough on a price chart, often used as reference support or resistance
Spot ETF Net Inflow: The net dollar value of new money entering a spot ETF product on a given day
CoinGabbar's Technical Analyst View
Bull Case: LINK's aggressive first retest of its ascending trendline, combined with dominant short-side liquidations and accelerating ETF inflows, supports continuation toward $14.992 and beyond toward $20.757 and $27.882.
Base Case: A pullback to the $10.862 swing high or a direct trendline retest would be a normal pause within the same bullish structure, without changing the broader picture.
Bear Case: A break and close below the ascending trendline followed by continued downside would invalidate the current bullish read and shift focus toward $10.071 and $7.150.
Disclaimer
This article is for informational purposes only and should not be considered financial or investment advice. Cryptocurrency markets, particularly leveraged derivatives, are highly volatile and carry substantial risk of loss. CoinGabbar and the author do not hold a position in LINK at the time of publication. Readers should conduct their own research and consult a qualified financial advisor before making any investment decisions.
0
0

 Управляйте всей своей криптовалютой, NFT и DeFi из одного места
Безопасно подключите используемый вами портфель для начала.


